Economics and business correspondents regularly serve as apologists for poor policy. Their motivation is to…
Australian labour market – stronger employment growth in August demonstrates how ineffective monetary policy is
Today, the Australian Bureau of Statistics released the latest – Labour Force, Australia – for August 2023 today (September 14, 2023). Employment growth was strong in August and kept pace with the underlying population growth and the participation rise so that unemployment remained steady. The weaker result in July was probably mostly reflecting the rotation in the sample. However, there are now 10.2 per cent of the available and willing working age population who are being wasted in one way or another – either unemployed or underemployed. That extent of idle labour means Australia is not at full employment despite the claims by the mainstream commentators. The other point is that the relatively steady unemployment rate indicates how ineffective monetary policy has been, given the RBA’s intention to push unemployment up to 4.5 per cent through a sequence of interest rate rises since May 2022. Unemployment has barely budged.
The summary ABS Labour Force (seasonally adjusted) estimates for August 2023 are:
- Employment rose 64,900 (0.5 per cent) – full-time employment increased by 2,800 and part-time employment increased by 62,100. Part-time share of total was 30.2 per cent.
- Unemployment fell 2,600 to 540,500 persons.
- The official unemployment rate was unchanged at 3.7 per cent.
- The participation rate rose 0.1 point to 67 per cent.
- The employment-population ratio rose 0.1 point to 64.5 per cent.
- Aggregate monthly hours fell 9.4 million hours (-0.48 per cent).
- Underemployment rose 27.6 thousand – 0.2 points to 6.6 per cent. Overall there are 959.6 thousand underemployed workers. The total labour underutilisation rate (unemployment plus underemployment) rose by 0.1 point to 10.2 per cent. There were a total of 1,500.1 thousand workers either unemployed or underemployed.
In its – Media Release – the ABS noted that:
The unemployment rate remained at 3.7 per cent in August (seasonally adjusted) …
The large increase in employment in August came after a small drop in July, around the school holiday period. Looking over the past two months, the average employment growth was around 32,000 people per month, which is similar to the average growth over the past year …
Monthly hours worked fell 0.5 per cent in August 2023 (following the increase of 0.2 per cent in July), while employment rose by 0.5 per cent.
Despite a small fall in August, hours worked were 3.7 per cent higher than August 2022, continuing to reflect faster growth than the 3.0 per cent annual increase in employment …
The strength in hours worked over the past year, relative to employment growth, shows the demand for labour is continuing to be met by people working more hours, to some extent …
Conclusion: The August result demonstrates that last month’s weakness in the data was not the harbinger of a worsening situation.
While the RBA has been trying to push the unemployment rate up to 4.5 per cent, the data shows how ineffective conventional monetary policy (interest rate changes) is as a counter-stabilisation tool.
Employment rose 64,900 (0.5 per cent) in August 2023
1. Full-time employment increased by 2,800 and part-time employment increased by 62,100.
2. The employment-population ratio rose 0.1 point to 64.5 per cent.
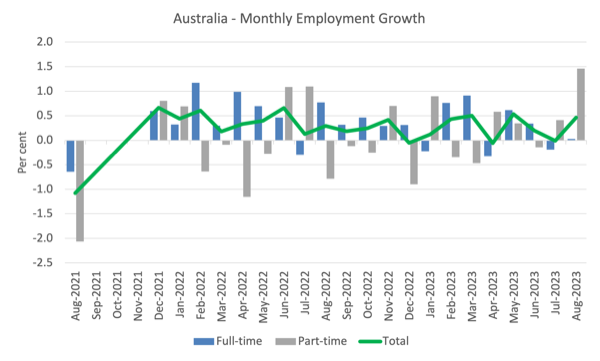
The following graph shows the month by month growth in full-time (blue columns), part-time (grey columns) and total employment (green line) for the 24 months to August 2023 using seasonally adjusted data.
I took out the observations from September to January 2021 – they were outliers due to the Covid wave at that time.
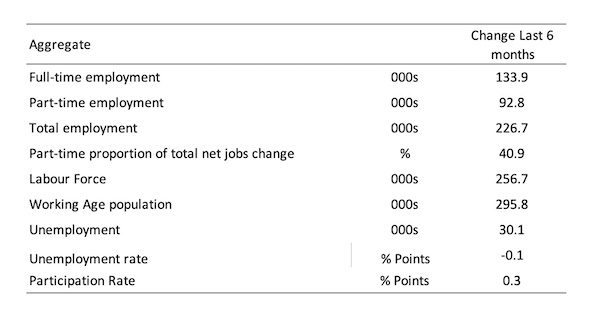
The following table provides an accounting summary of the labour market performance over the last six months to provide a longer perspective that cuts through the monthly variability and provides a better assessment of the trends.
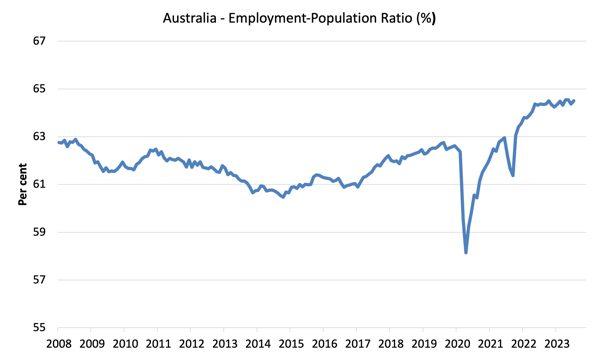
Given the variation in the labour force estimates, it is sometimes useful to examine the Employment-to-Population ratio (%) because the underlying population estimates (denominator) are less cyclical and subject to variation than the labour force estimates. This is an alternative measure of the robustness of activity to the unemployment rate, which is sensitive to those labour force swings.
The following graph shows the Employment-to-Population ratio, since January 2008 (that is, since the GFC).
The ratio rose 0.1 point to 64.5 per cent in August 2023, which means employment growth was stronger than underlying population growth.
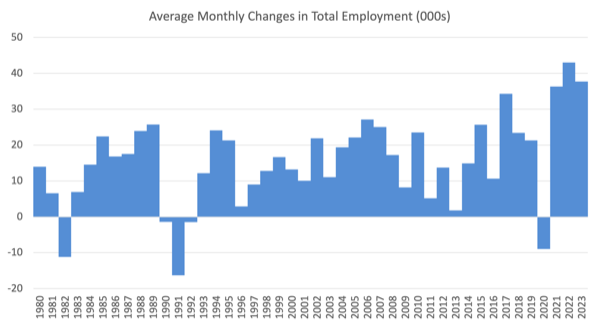
For perspective, the following graph shows the average monthly employment change for the calendar years from 1980 to 2022 (to date).
1. The average employment change over 2020 was -9 thousand which rose to 36.3 thousand in 2021 as the lockdowns eased.
2. For 2022, the average monthly change was 43 thousand.
3. So far, in 2023, the average change is 37.7 thousand.
The following graph shows the average monthly changes in Full-time and Part-time employment (lower panel) in thousands since 1980.
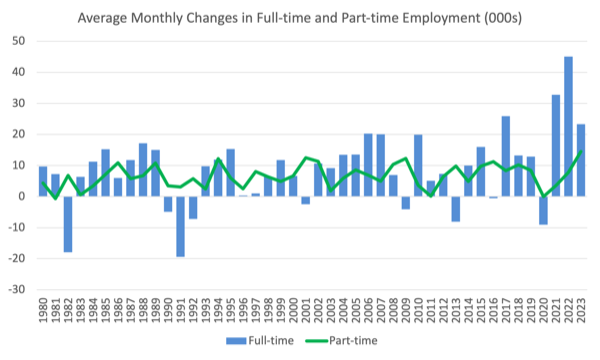
Hours worked fell 9.4 million hours (-0.48 per cent) in August 2023
As noted above this was the result of more people declining to take holidays in July (traditional school break) than usual even as total employment was declining.
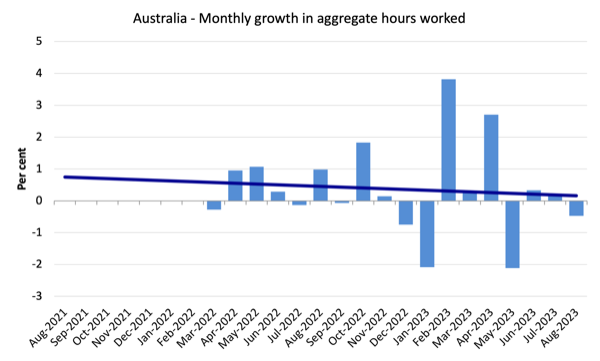
The following graph shows the monthly growth (in per cent) over the last 24 months (with the pandemic restriction period omitted).
The dark linear line is a simple regression trend of the monthly change.
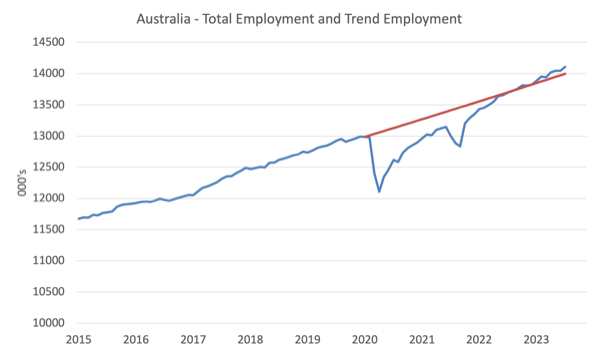
Actual and Trend Employment
The following graph shows total employment (blue line) and what employment would have been if it had continued to grow according to the average growth rate between 2015 and April 2020.
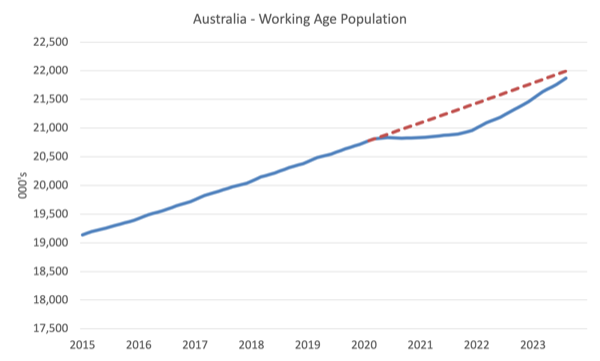
The Population Slowdown – the ‘What-if’ unemployment analysis
The following graph shows Australia’s working age population (Over 15 year olds) from January 2015 to August 2023. The dotted line is the projected growth had the pre-pandemic trend continued.
The difference between the lines is the decline in the working age population that followed the Covid restrictions on immigration.
The civilian population is 123.5 thousand less in August 2023 than it would have been had pre-Covid trends continued.
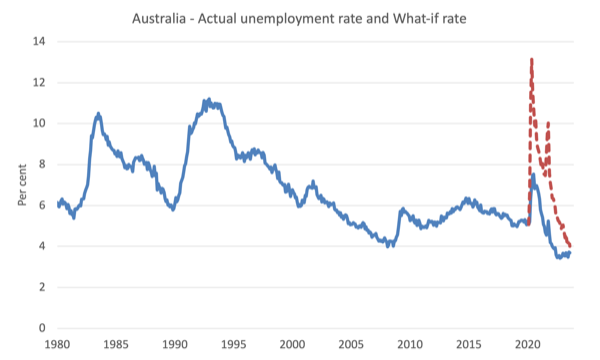
The following graph shows the evolution of the actual unemployment rate since January 1980 to August 2023 and the dotted line is the ‘What-if’ rate, which is calculated by assuming the most recent peak participation rate (recorded at August 2023 = 67 per cent), the extrapolated working age population (based on growth rate between 2015 and March 2020) and the actual employment since March 2020.
It shows what the unemployment rate would have been given the actual employment growth had the working age population trajectory followed the past trends.
In this blog post – External border closures in Australia reduced the unemployment rate by around 2.7 points (April 28, 2022), I provided detailed analysis of how I calculated the ‘What-if’ unemployment rate.
So instead of the current unemployment rate of 3.7 per cent, the rate would have been 4 per cent in August 2023, given the employment performance since the pandemic. The border restrictions imposed during the early stages of the pandemic are now losing significance.
Unemployment fell 2,600 to 540,500 persons in August 2023
Last month’s rise in unemployment was probably due to the noise in the rotation groups in the Survey (a higher unemployment group replaced a lower group) which I signalled in my report last month.
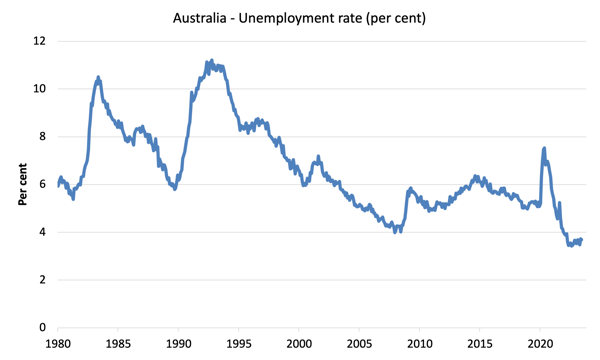
The following graph shows the national unemployment rate from January 1980 to August 2023. The longer time-series helps frame some perspective to what is happening at present.
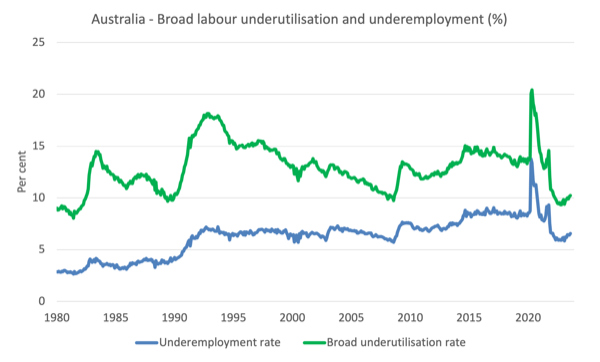
Broad labour underutilisation rose by 0.1 point to 10.2 per cent in August 2023
1. Underemployment rose 27.6 thousand – 0.2 points to 6.6 per cent.
2. Overall there are 959.6 thousand underemployed workers.
3. The total labour underutilisation rate (unemployment plus underemployment) rose by 0.1 point to 10.2 per cent.
4. There were a total of 1,500.1 thousand workers either unemployed or underemployed.
The following graph plots the seasonally-adjusted underemployment rate in Australia from April 1980 to the August 2023 (blue line) and the broad underutilisation rate over the same period (green line).
The difference between the two lines is the unemployment rate.
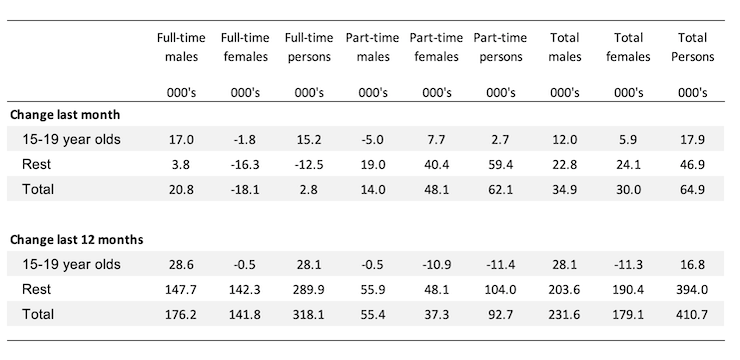
Teenage labour market improves in August 2023
After a few months of weakness, the teenage labour market improved in August 2023.
Teenagers gained 17.9 thousand net jobs in August with full-time jobs rising by 15.2 thousand and part-time rising by 2.7 thousand.
The following Table shows the distribution of net employment creation in the last month and the last 12 months by full-time/part-time status and age/gender category (15-19 year olds and the rest).
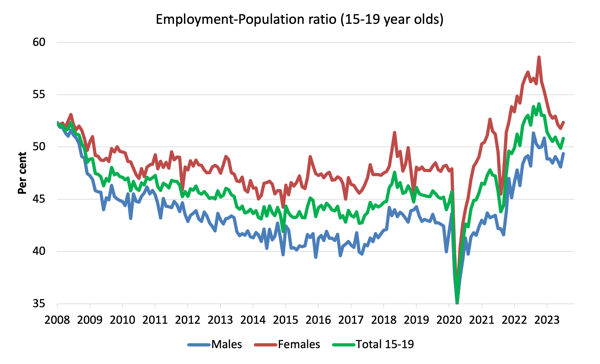
To put the teenage employment situation in a scale context (relative to their size in the population) the following graph shows the Employment-Population ratios for males, females and total 15-19 year olds since July 2008.
You can interpret this graph as depicting the change in employment relative to the underlying population of each cohort.
In terms of the recent dynamics:
1. The male ratio rose 1.3 points over the month.
2. The female ratio rose 0.6 points.
3. The overall teenage employment-population ratio rose 0.9 points over the month.
Conclusion
My standard monthly warning: we always have to be careful interpreting month to month movements given the way the Labour Force Survey is constructed and implemented.
My overall assessment is:
1. The weaker result in July was probably mostly reflecting the rotation in the sample.
2. Employment growth was strong in August and kept pace with the underlying population growth and the participation rise so that unemployment remained steady.
3. There are now 10.2 per cent of the available and willing working age population who are being wasted in one way or another – either unemployed or underemployed. That extent of idle labour means Australia is not at full employment despite the claims by the mainstream commentators.
That is enough for today!
(c) Copyright 2023 William Mitchell. All Rights Reserved.
Hiking interest rates is just an excuse for something else.
It’s ludricous to think that making credit more expensive is going to reduce inflation.
Making credit more expensive is an inflationary pressure and will make everything more expensive.
Speculators don’t want to invest their money in long-term investments like factories.
Anything longer than 6 months is not something to take in consideration.
They want freedom to transfer the money to wherever it can yield more interest and fast.
If the fed hikes interest rates, speculators will send their money to the US.
If money goes to the US, other central banks need to hike too to counter the fed.
It’s a stupid game, that doesn’t go anywhere, except keeping the 1% happy.
It’s no suprise that the French government is already saying that the EU is in a state similar to underdevelopment.
They got it right, but fail to see the way out of underdevelopment.
It’s not something to take 6 months.
Speculators are not the solution, but the problem.
Rotation is not working correctly if it affects the representativeness of the survey. As ABS says: “The design of the survey, including the weighting and estimation processes, ensures that these differences are generally relatively minor and do not affect the representativeness of the survey and its estimates. Monthly estimates are designed to be representative, regardless of the relative contribution of the three components of the sample.”
So either rotation works, and the monthly numbers are representative of the underlying labour market, or rotation does not work, in which case the monthly numbers cannot be used.