In the 1990s, a new industry was created in Australia. It produced nothing. But it…
Australian labour market – contracts for second consecutive month – where is the Treasurer?
The Australian Bureau of Statistics (ABS) released of the latest labour force data today (February 16, 2023) – Labour Force, Australia – for January 2023. My overall assessment is that the labour market is now in decline after two consecutive months of employment loss. In January 2023, total employment fell by 11,500 (-0.1 per cent) with full-time employment falling by 43.3 thousand, while part-time employment increased by 31.8 thousand. Participation also fell further to 66.5 per cent and we saw unemployment rise significantly (by 21,900 persons). Workers are being squeezed by two forces: the demand for labour is declining at the same time as the supply is increasing as a result of the relaxation of border restrictions and increased migration. The underlying (‘What-if’) unemployment rate is closer to 5.6 per cent rather than the official rate of 3.7 per cent, which indicates the labour market still has slack. There are still 1,398 thousand Australian workers without work in one way or another (officially unemployed or underemployed). Overall, the RBA deliberate strategy to force unemployment onto workers and deprive them of income is working. Shameful!
The summary ABS Labour Force (seasonally adjusted) estimates for January 2022 are:
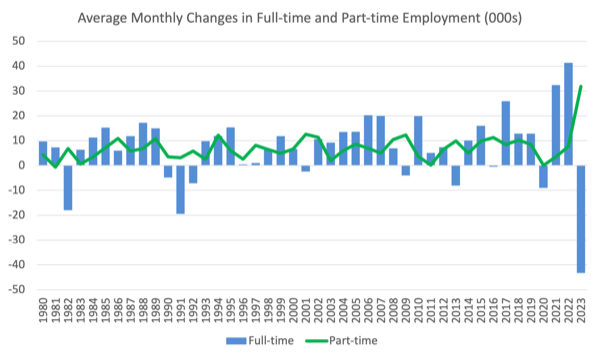
- Employment fell by 11,500 (-0.1 per cent) – full-time employment fell by 43.3 thousand and part-time employment increased by 31.8 thousand.
- Unemployment rose 21,900 to 523,500 persons.
- The official unemployment rate rose 0.2 points to 3.7 per cent.
- The participation rate declined by 0.1 point to 66.5 per cent.
- The employment-population ratio fell 0.2 points to 64.0 per cent.
- Aggregate monthly hours fell by 40 million hours (-2.1 per cent).
- Underemployment rose by 0.1 points to 6.1 per cent (a rise of 9.4 thousand). Overall there are 874.8 thousand underemployed workers. The total labour underutilisation rate (unemployment plus underemployment) rose 0.2 points 9.8 per cent. There were a total of 1,398 thousand workers either unemployed or underemployed.
In its – Media Release – the ABS noted that:
…. with employment decreasing by around 11,000 people, and the number of unemployed increasing by 22,000 people, the unemployment rate rose to 3.7 per cent.
This was the second consecutive monthly fall in seasonally adjusted employment but followed very strong growth during 2022 …
The underutilisation rate, which combines the unemployment and underemployment rates, rose 0.2 percentage points to 9.8 per cent in seasonally adjusted terms.
Conclusion: employment growth has now declined for the second consecutive month and indicates that the economy is slowing down and shedding work and forcing workers into unemployment.
The RBA plan to deliberately increase unemployment so people are deprived of income and spending capacity is starting to work, unfortunately.
Employment fell by 11,500 (-0.1 per cent) in January 2022
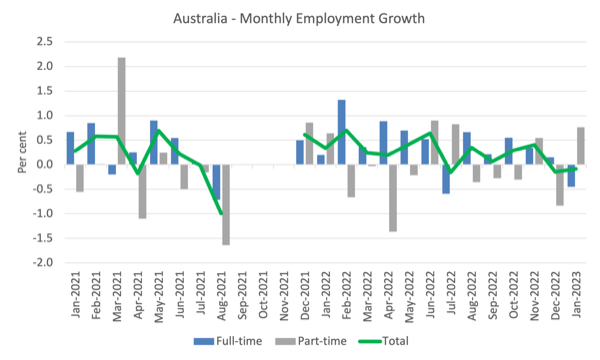
1. Full-time employment fell by 43.3 thousand and part-time employment increased by 31.8 thousand.
2. The employment-population ratio fell 0.3 points to 64.0 per cent.
The following graph shows the month by month growth in full-time (blue columns), part-time (grey columns) and total employment (green line) for the 24 months to January 2022 using seasonally adjusted data.
I took out the observations from September to January 2021 – they were outliers due to the Covid wave at that time.
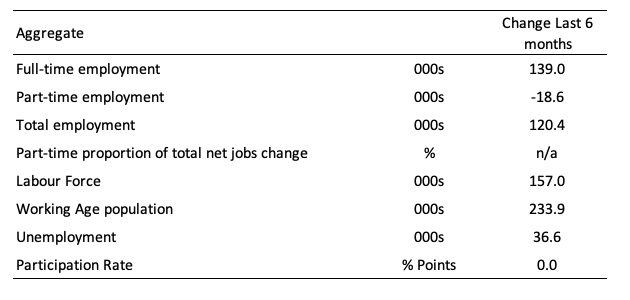
The following table provides an accounting summary of the labour market performance over the last six months to provide a longer perspective that cuts through the monthly variability and provides a better assessment of the trends.
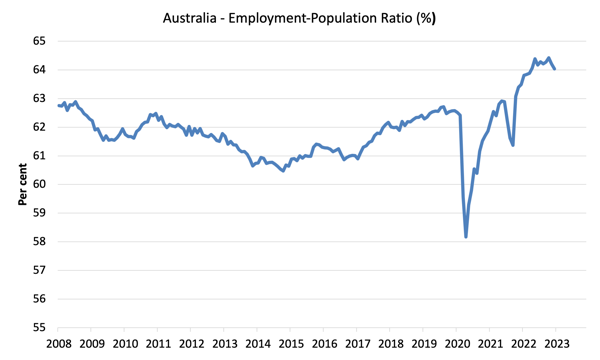
Given the variation in the labour force estimates, it is sometimes useful to examine the Employment-to-Population ratio (%) because the underlying population estimates (denominator) are less cyclical and subject to variation than the labour force estimates. This is an alternative measure of the robustness of activity to the unemployment rate, which is sensitive to those labour force swings.
The following graph shows the Employment-to-Population ratio, since January 2008 (that is, since the GFC).
The ratio ratio fell 0.2 points to 64 per cent in January 2022.
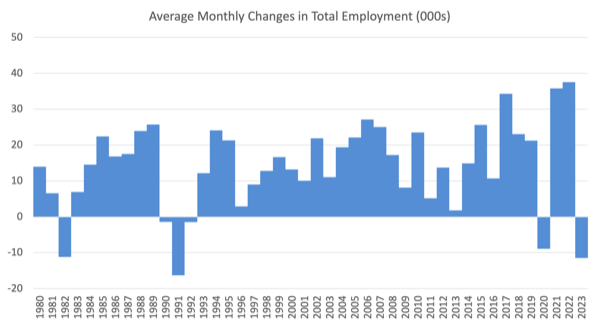
For perspective, the following graph shows the average monthly employment change for the calendar years from 1980 to 2022 (to date).
1. The average employment change over 2020 was -8.8 thousand which rose to 36 thousand in 2021 as the lockdowns eased.
3. For 2022, the average monthly change was 37.7 thousand.
The following graph shows the average monthly changes in Full-time and Part-time employment (lower panel) in thousands since 1980.
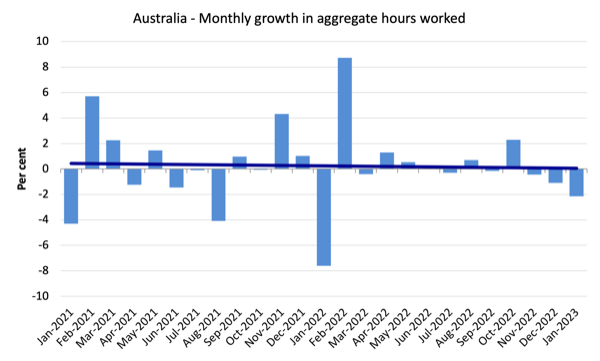
Hours worked fell by 40 million hours (-2.1 per cent) in January 2022
The following graph shows the monthly growth (in per cent) over the last 24 months.
The dark linear line is a simple regression trend of the monthly change (skewed upwards by the couple of outlier results).
The reality is that there hasn’t been much growth in hours worked over the last 9 months, with the last three months recording negative results.
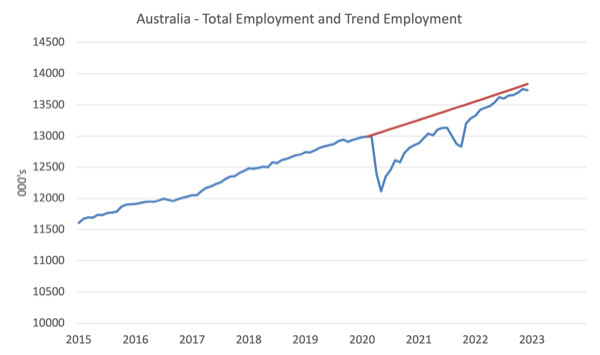
Actual and Trend Employment
The Australian labour market is now larger than it was in February 2020 and employment is now close to returning to the pre-pandemic trend.
But it is still below where it would have been had the trend been maintained.
The following graph shows total employment (blue line) and what employment would have been if it had continued to grow according to the average growth rate between 2015 and April 2020.
In January 2023, the gap increased by 45.5 thousand to 99.9 thousand jobs.
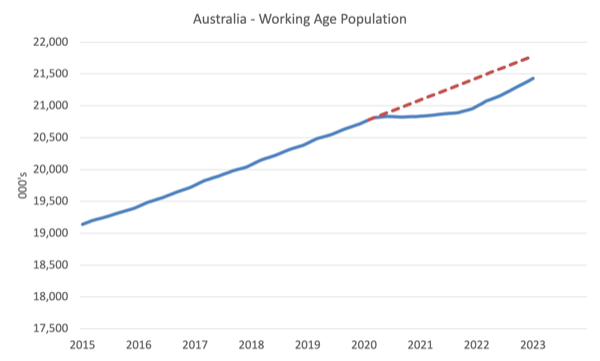
The Population Slowdown – the ‘What-if’ unemployment analysis
The following graph shows Australia’s working age population (Over 15 year olds) from January 2015 to January 2022. The dotted line is the projected growth had the pre-pandemic trend continued.
The difference between the lines is the decline in the working age population that followed the Covid restrictions on immigration.
The civilian population is 368.7 thousand less in January 2023 than it would have been had pre-Covid trends continued.
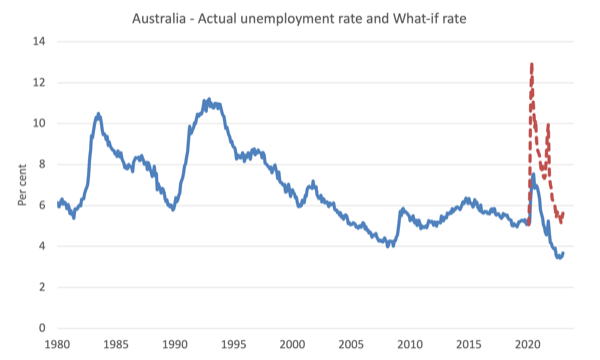
The following graph shows the evolution of the actual unemployment rate since January 1980 to January 2022 and the dotted line is the ‘What-if’ rate, which is calculated by assuming the most recent peak participation rate (recorded at November 2022 = 66.8 per cent), the extrapolated working age population (based on growth rate between 2015 and February 2020) and the actual employment since February 2020.
It shows what the unemployment rate would have been given the actual employment growth had the working age population trajectory followed the past trends.
In this blog post – External border closures in Australia reduced the unemployment rate by around 2.7 points (April 28, 2022), I provided detailed analysis of how I calculated the ‘What-if’ unemployment rate.
So instead of the current unemployment rate of 3.7 per cent, the rate would have been 5.6 per cent in January 2023, given the employment performance since the pandemic.
This finding puts a rather different slant to what has been happening since the onset of the pandemic.
Unemployment rose by rose 21,900 to 523,500 persons in January 2022
This is the second consecutive month that the unemployment rate has risen signalling a turning point in the labour market situation.
Unemployment rose because the net fall in employment (-11,500) was reinforced by a rise in the labour force (10,400 thousand), the latter arising from a the rise in the working age population outstripping the impact of the 0.1 decline in the participation rate.
So the worst scenario is emerging – the underlying working age population is growing more quickly again as a result of migration at the same time employment opportunities are falling, which means unemployment will be forced up by the decline in demand and rise in supply.
Also so bear in mind the ‘What-if’ analysis above and see the impact of the fall in participation below.
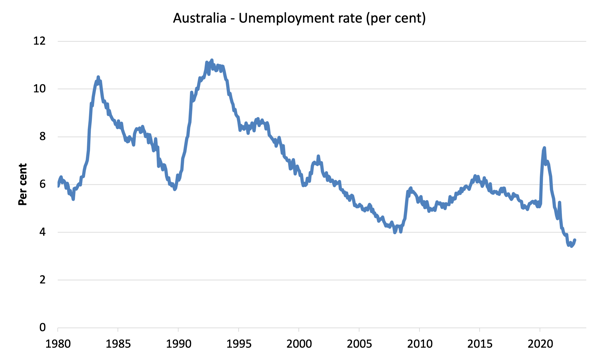
The following graph shows the national unemployment rate from January 1980 to January 2023. The longer time-series helps frame some perspective to what is happening at present.
Broad labour underutilisation rose 0.2 points to 9.8 per cent in January 2022
1. Underemployment rose by 0.1 points to 6.1 per cent (a rise of 9.4 thousand).
2. Overall there are 874.8 thousand underemployed workers.
3. The total labour underutilisation rate (unemployment plus underemployment) rose 0.2 points 9.8 per cent.
4. There were a total of 1,398 thousand workers either unemployed or underemployed.
With full-time employment falling sharply, both unemployment and underemployment rose – a bad sign.
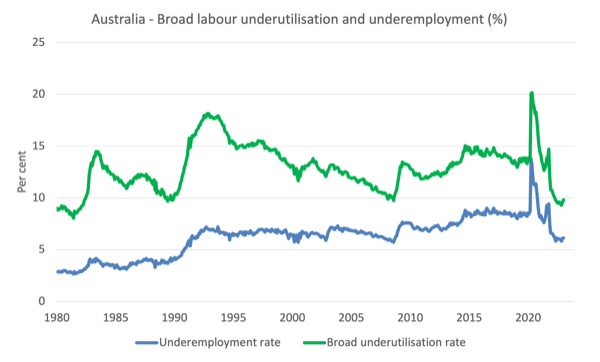
The following graph plots the seasonally-adjusted underemployment rate in Australia from April 1980 to the January 2022 (blue line) and the broad underutilisation rate over the same period (green line).
The difference between the two lines is the unemployment rate.
Teenage labour market deteriorated again in January 2022
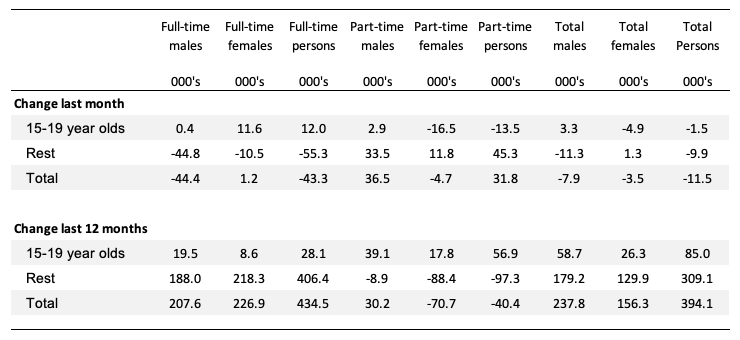
The following Table shows the distribution of net employment creation in the last month and the last 12 months by full-time/part-time status and age/gender category (15-19 year olds and the rest).
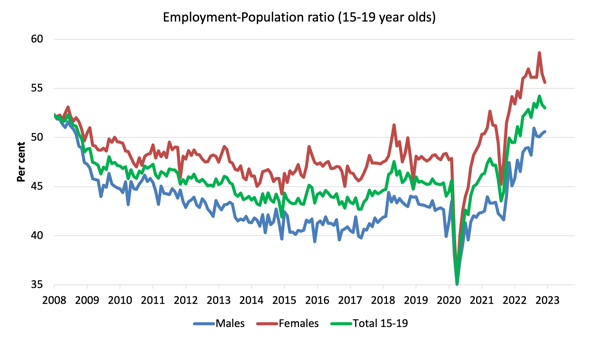
To put the teenage employment situation in a scale context (relative to their size in the population) the following graph shows the Employment-Population ratios for males, females and total 15-19 year olds since June 2008.
You can interpret this graph as depicting the change in employment relative to the underlying population of each cohort.
In terms of the recent dynamics:
1. The male ratio rose by 0.2 points over the month.
2. The female ratio fell by 0.9 points.
3. The overall teenage employment-population ratio fell by 0.3 points over the month.
4. This continues to reverse the recent trend that has seen female teenagers enjoying better outcomes relative to male teenagers.
Conclusion
My standard monthly warning: we always have to be careful interpreting month to month movements given the way the Labour Force Survey is constructed and implemented.
My overall assessment is:
1. My overall assessment is that the labour market is now in decline after two consecutive months of employment loss.
2. In January 2023, total employment fell by 11,500 (-0.1 per cent) with full-time employment falling by 43.3 thousand, while part-time employment increased by 31.8 thousand.
3. Participation also fell further to 66.5 per cent and we saw unemployment rise significantly (by 21,900 persons).
4. Workers are being squeezed by two forces: the demand for labour is declining at the same time as the supply is increasing as a result of the relaxation of border restrictions and increased migration.
5. The underlying (‘What-if’) unemployment rate is closer to 5.6 per cent rather than the official rate of 3.7 per cent, which indicates the labour market still has slack.
6. There are still 1,398 thousand Australian workers without work in one way or another (officially unemployed or underemployed).
7. Overall, the RBA deliberate strategy to force unemployment onto workers and deprive them of income is working. Shameful!
That is enough for today!
(c) Copyright 2023 William Mitchell. All Rights Reserved.
The RBA board needs to represent citizens not corporations. Shame on the treasurer for not bringing those sorry excuses for humans into line.