Earlier this week (July 28, 2026), the Governor of the Reserve Bank of Australia presented…
Australian inflation data – not as scary as most think
Yesterday (October 26, 2022), the Australian Bureau of Statistics released the September-quarter – Consumer Price Index, Australia – which revealed that the quarterly CPI rose by 1.8 per cent (relatively large increase) and rose over the 12 months by 7.3 per cent, the highest annual inflation rate since 1990. The most significant contributors over the year were owner-occupied housing (bushfires wiping out materials), food (floods destroying crops), and gas supplies (cartel profit gouging). So some of the factors driving the inflation are short-term and the others will be resolved by factors outside our control. But with wage pressures absent and the most reliable indicator of medium- to long-term inflation now falling, it is hard to make a case that the rising inflation is now entrenched. The correct policy response should be to provide fiscal support for lower-income households to help them cope with the cost of living rises at present.
The summary, seasonally-adjusted Consumer Price Index results for the September-quarter 2022 are as follows:
- The All Groups CPI rose by 1.8 per cent for the quarter – which is steady from the last quarter.
- The All Groups CPI rose by 7.3 per cent over the 12 months.
- The major determinants were New dwelling purchases by owner-occupiers (up 3.7 per cent), Gas and other household fuels (up 10.7 per cent) and Furniture (up 6.6 per cent).
- The Trimmed mean series rose by 1.8 per cent for the quarter and 6.1 per cent over the previous year.
- The Weighted median series rose by 1.4 per cent (static) for the quarter and 5 per cent over the previous year.
The ABS Media Release notes that:
This quarter’s increase matches that of last quarter and is lower than the 2.1 per cent result in March quarter this year …
Labour shortages in the house construction industry, leading to rises in labour costs, contributed to the rise in new dwellings this quarter. The continuation of material shortages added further price pressure …
Annual gas price reviews across the states and territories saw higher wholesale gas prices passed on to consumers in the September quarter …
Short assessment: The inflation continues to be driven by a relatively narrow set of circumstances related to the supply disruptions from the global pandemic and shortages of building materials largely the result of natural disasters (bushfires) and the Ukraine conflict.
The gas situation in Australia
The other factor is the profit gouging from the big, foreign-owned gas companies.
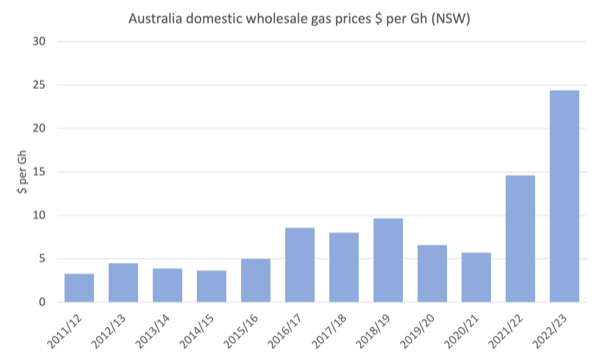
The following graph shows the wholesale price of gas in NSW (which is representative of the nation as a whole).
The circumstances may not be well-known to non-Australian readers.
Australia produces more gas that we can use and exports significant amounts.
Foreign energy companies control the Australian industry and systematically connive to restrict local supply so as to push up local prices.
Santos, for example, diverted “large volumes of gas out of the domestic market in the first half of 2022, forcing domestic prices above export prices in the last six months” (Source).
It recorded a “massive increase of 300%” in its profits in the first half of 2022 as a result of taking advantage of the war in Ukraine and diverting our gas into higher yielding export markets.
The diversion has created a shortage in the domestic market and prices have risen dramatically as the graph shows.
The diversion is also against the undertakings the company gave “when they built their export plants”.
The other big foreign energy companies are also making massive profits on Australian gas.
The evidence is that these companies essentially get the gas for free because the government refuses to force them to pay taxes and royalties despite the massive profits.
Meanwhile, Australian consumers are being hit hard by the ridiculous price rises in the domestic market.
The Australian Competition and Consumer Commission (ACCC) produced its latest report on the industry – Gas inquiry July 2022 – (published August 1, 2022), which examines the gas supply outlook.
The Report finds that “Much of this gas will be exported to overseas markets in Asia under long term contracts” but the “LNG exporters have exported at least half – and more frequently, around 70% – of their excess gas to overseas spot markets.”
Excess gas is that produced which is not under long-term contracts.
Further, “the domestic east coast gas market uses a relatively small proportion of the total east coast gas production each year”, and could easily be supplied from the gas produced that is not under long-term contract.
Total production in 2023 is forecast to be 1981 PJ.
Total under long-term contract is 1299 PJ.
Domestic market forecast to be 571 PJ.
Obviously, if the excess gas is increasingly sold into export markets (taking advantage of the Ukraine situation, for example) then:
… the domestic east coast gas market is likely to be 56 PJ short of gas needed to meet forecast demand for 2023.
And the shortage will drive prices up further.
The LPG companies are claiming they will sell into the domestic market on “competitive terms” which essentially means export price parity.
The Australian government seem scared to take the big energy corporations on.
Australian Tax Office data published in its – Corporate tax transparency report 2019-20 income year – shows that Shell and Exxon, big members of the LPG cartel, earned more than $A20 billion in reevnue in 2019-20 and paid zero tax.
Further, when the fiscal statement released on Tuesday is predicting a 56 per cent rise in energy prices next year in Australia, it is clear that the link between gas and electricity prices is a major factor in this scandal.
Gas-fired power stations just pass on the wholesale prices set by the gas producers.
The privatised electricity sector is also uncompetitive given it controls an essential service and can get away with gouging in its own right.
The recent decision of the Victorian state government to recreate the public generator (State Electricity Commission), which will partially nationalise the sector again is welcome in this context.
Australians are slowly working out that the neoliberal era has dudded them and made billions for the companies and shareholders that get virtually free access to our natural resources.
Quite apart from the climate implications (gas has to go!), the Australian government must step in and set domestic gas price controls and prohibit the gas companies from exporting its excess gas production.
They should then move to nationalise the industry.
The other point is that the rising gas prices which are driving the overall CPI has nothing to do with excess demand driven by RBA low interest rate policies during the pandemic nor government fiscal expansion during the pandemic.
Higher interest rates will not solve this problem.
The problem is a local cartel which has to be broken up and before that can happen controlled through regulation and legislative dictate.
Trends in inflation
The headline inflation rate increased by 1.8 per cent in the September-quarter 2022 and 7.3 per cent over the 12 months.
There was little change from the last quarter’s results overall.
The rise is transitory – mostly an adjustment in once-off factors – energy, building materials etc.
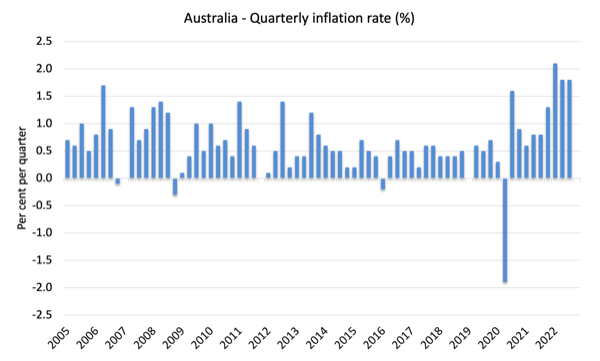
The following graph shows the quarterly inflation rate since the September-quarter 2005.
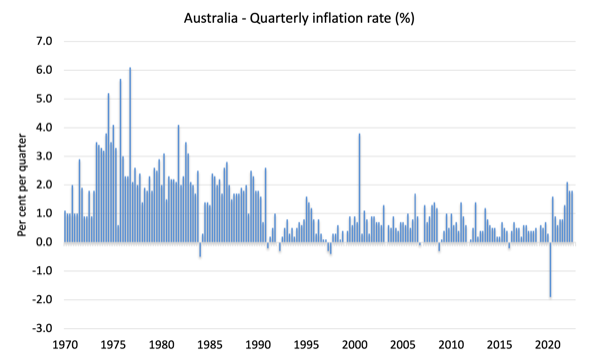
To put that into historical perspective, here is the series since the September-quarter 1970. We are nowhere near the inflationary pressures that followed the OPEC price rises in 1973.
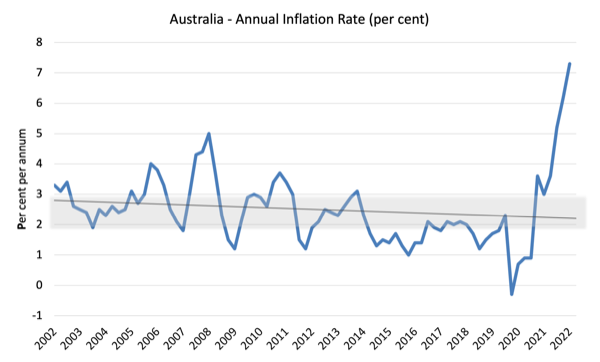
The next graph shows the annual headline inflation rate since the first-quarter 2002. The black line is a simple regression trend line depicting the general tendency. The shaded area is the RBA’s so-called targetting range (but read below for an interpretation).
The trend inflation rate over this long period is downwards.
What is driving inflation in Australia?
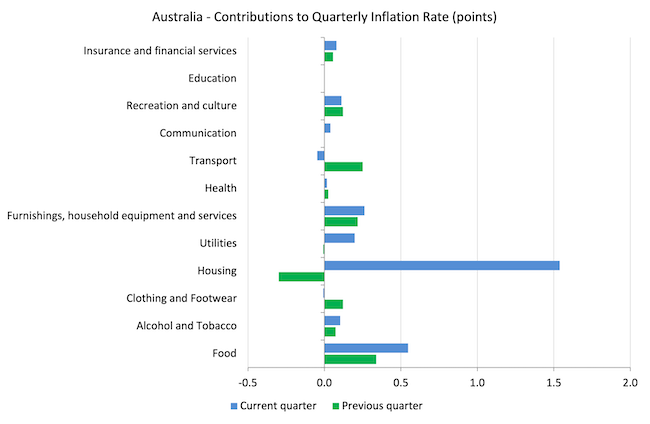
The following bar chart compares the contributions to the quarterly change in the CPI for the September-quarter 2022 (blue bars) compared to the June-quarter 2022 (green bars).
Note that Utilities is a sub-group of Housing.
As you will see in the graph that follows, housing is a major driver of the annual inflation figure (September-quarter 2021 to September-quarter 2022) and that is driven by shortages of materials, which are in no small part due to the bushfires that wiped out plantations.
Also the Ukraine situation has reduced the supply of certain timbers.
Food inflation is another major contributor – and that is also in no small way the result of constant east coast flooding.
None of these influences have much to do with the state of the spending in the economy – they are supply-side driven and/or reflecting non-competitive and unregulated cartel-type behaviour.
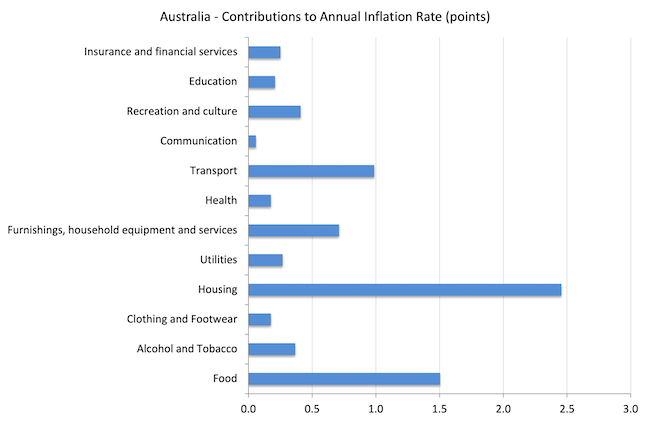
The next graph provides shows the contributions in points to the annual inflation rate by the various components.
Inflation and Expected Inflation
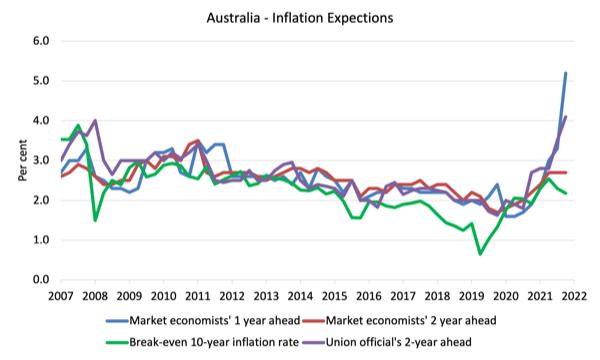
The following graph shows four measures of expected inflation expectations produced by the RBA – Inflation Expectations – G3 – from the September-quarter 2005 to the September-quarter 2021.
The four measures are:
1. Market economists’ inflation expectations – 1-year ahead.
2. Market economists’ inflation expectations – 2-year ahead – so what they think inflation will be in 2 years time.
3. Break-even 10-year inflation rate – The average annual inflation rate implied by the difference between 10-year nominal bond yield and 10-year inflation indexed bond yield. This is a measure of the market sentiment to inflation risk.
4. Union officials’ inflation expectations – 2-year ahead.
Notwithstanding the systematic errors in the forecasts, the price expectations (as measured by these series) have risen over the last year, which is hardly surprising.
The most reliable measure – the Break-even 10-year inflation rate – is now in decline, falling 0.1 point to 2.2 per cent and within the RBA targetting range.
This measure is a good indicator of long-term inflation expectations.
The 2-year market economists’ expectation has been static since the March-quarter 2022. Another sign of transitory nature of this inflation.
That all supports the notion that this is not looking like an endemic inflationary episode.
Implications for monetary policy
What does this all mean for monetary policy?
Most commentators – looking at the headline figure of 7.3 per cent – claim the RBA has no option but to hike rates even further when it meets in November.
However, from my perspective the RBA would be grossly negligent if it did that.
The RBA uses a range of measures to ascertain whether they believe there are persistent inflation threats.
Please read my blog post – Australian inflation trending down – lower oil prices and subdued economy – for a detailed discussion about the use of the headline rate of inflation and other analytical inflation measures.
The Consumer Price Index (CPI) is designed to reflect a broad basket of goods and services (the ‘regimen’) which are representative of the cost of living. You can learn more about the CPI regimen HERE.
The RBA’s formal inflation targeting rule aims to keep annual inflation rate (measured by the consumer price index) between 2 and 3 per cent over the medium term.
The RBA also does not rely on the ‘headline’ inflation rate. Instead, they use two measures of underlying inflation which attempt to net out the most volatile price movements.
To understand the difference between the headline rate and other non-volatile measures of inflation, you might like to read the September 2010 RBA Bulletin which contains an interesting article – Measures of Underlying Inflation. That article explains the different inflation measures the RBA considers and the logic behind them.
The concept of underlying inflation is an attempt to separate the trend (“the persistent component of inflation) from the short-term fluctuations in prices. The main source of short-term ‘noise’ comes from “fluctuations in commodity markets and agricultural conditions, policy changes, or seasonal or infrequent price resetting”.
The RBA uses several different measures of underlying inflation which are generally categorised as ‘exclusion-based measures’ and ‘trimmed-mean measures’.
So, you can exclude “a particular set of volatile items – namely fruit, vegetables and automotive fuel” to get a better picture of the “persistent inflation pressures in the economy”. The main weaknesses with this method is that there can be “large temporary movements in components of the CPI that are not excluded” and volatile components can still be trending up (as in energy prices) or down.
The alternative trimmed-mean measures are popular among central bankers.
The authors say:
The trimmed-mean rate of inflation is defined as the average rate of inflation after “trimming” away a certain percentage of the distribution of price changes at both ends of that distribution. These measures are calculated by ordering the seasonally adjusted price changes for all CPI components in any period from lowest to highest, trimming away those that lie at the two outer edges of the distribution of price changes for that period, and then calculating an average inflation rate from the remaining set of price changes.
So you get some measure of central tendency not by exclusion but by giving lower weighting to volatile elements. Two trimmed measures are used by the RBA: (a) “the 15 per cent trimmed mean (which trims away the 15 per cent of items with both the smallest and largest price changes)”; and (b) “the weighted median (which is the price change at the 50th percentile by weight of the distribution of price changes)”.
So what has been happening with these different measures?
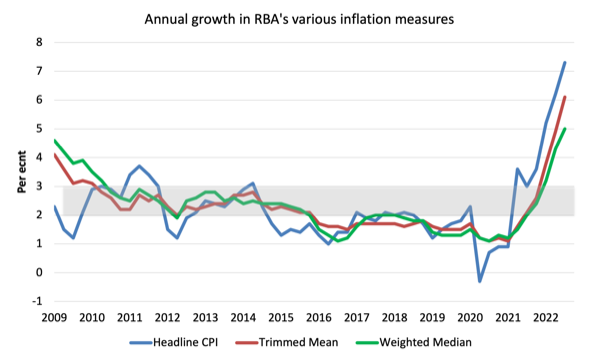
The following graph shows the three main inflation series published by the ABS since the September-quarter 2009 – the annual percentage change in the All items CPI (blue line); the annual changes in the weighted median (green line) and the trimmed mean (red line).
The RBAs inflation targetting band is 2 to 3 per cent (shaded area). The data is seasonally-adjusted.
The three measures are in annual terms:
1. CPI measure of inflation rose by 7.3 per cent (up from 6.2 per cent last quarter).
2. The Trimmed Mean rose 6.1 per cent (up from 4.9 per cent last quarter).
3. The Weighted Median rose 5 per cent (up from 4.3 per cent last quarter).
How to we assess these results?
1. The RBA’s preferred measures are now outside the targetting range and would normally trigger an interest rate rise.
2. However, the more reliable measures of inflationary expectations are showing a slowing inflation rate into the near future.
3. One of the major drivers of the inflation – housing – is mostly driven by factors that the RBA cannot address through interest rate rises – floods, bushfires, fuel costs.
4. There is no wages pressure.
5. The other major contributors to the current situation are also not sensitive to interest rate rises.
6. There is no major structural bias towards persistently higher inflation rates.
Conclusion
The inflation rate in Australia is following world trends upwards, although it is still below the US levels.
The major sources of price increases are temporary – adjustments back to pre-pandemic levels, anti-competitive cartel behaviour and the War in Ukraine.
In Australia’s case, these influences are supplemented by shortages of building materials due to bushfires and food price inflation due to the major floods.
The correct policy response should be to provide fiscal support for lower-income households to help them cope with the cost of living rises at present.
That is enough for today!
(c) Copyright 2022 William Mitchell. All Rights Reserved.
Lets see how the RBA reacts on Tuesday.
Despite it having been obvious all along that no wage-price spiral exists and that the inflation is being driven by factors that cannot be attenuated by interest rate hikes, the RBA has been determined to try nonetheless.
As long as Labor remains absolutely terrified of confronting the gas cartel (remembering what happened to ex Prime Minister Kevin Rudd – I remember Bill writing about it when it happened) then energy prices will keep feeding into inflation as long as the war in Ukraine continues. And I see little prospect of that being resolved quickly. The US has already expended a significant portion of it’s strategic petroleum reserve in order to keep the price paid by American motorists at the pump down and the White House has apparently just signed off on a further release ahead of the mid-term elections to try and soothe the voters. If the war and the sanctions are still going in the new year then global energy-driven inflation could get ugly.
I guess if anything good comes out of this it will probably be that the transition to renewables will likely be accelerated.
The greedflation we are living is one of the morbid symptoms Gramsci wrote about.
The problems with faltering supply chains have created a gap between supply and demand, driving up inflation.
But instead of tackling those problems in the supply side, the regime assumes that the gap has to be solved in the demand side, crashing the economy with interest rate hikes.
The FED and the ECB keep hiking, certain that Putin will be blamed for it.
Let us wait for the midterms outcome in the US, to see if it worked.
Housing has all sorts of things inflating it. Of course landlords are passing on rate rises as rent increases – inflation caused by the reserve bank. There’s a cosy group of large landholders releasing lots slowly to maximise profit – land price is still the biggest component of house costs.. We know about the shortage of timber, but every other aspect of the building is controlled by a cosy duopoly. Sheet materials, hardware, steel, glass, electrics, every material producer has been consolidated. And we can’t just import stuff either – key components like glass, hardware and switchboards are global duopolies.
Competition law is an absolute failure. It prevents small builders getting together for a group buy, but it does not prevent anyone from buying out their competitors.
Seems that competition is only for the workers. Capital does not compete – it buys governments and regulators.
@Bradley Schott. Capitalism for the many, socialism for the few. Back in my youth the Country Party under “Black Jack” McEwen (later renamed the National Party) were colloquially pejoratively referred to as agrarian socialists – all for privatising profits and socialising losses. The owners of capital in the modern era have become the new Robber Barons which only China looks to have taken steps to control while so many first world governments remain in thrall.
Then we have the chorus that sings that the RBA has no choice but to keep hiking interest rates as long as the US Fed is doing so, otherwise the value of the $AUSD will collapse and we will begin to import runaway inflation.
Still refusing to believe inflation is a problem, said last year inflation won’t be an issue, all BS projections/forecasts whilst. Amazing to me how MMT makes perfect sense but MMT people/economists can’t get inflation right or admit it’s a problem. Makes many people move away from MMT.
Non discretionary CPI at 8.4% y/y and growing…wages growth about to ramp up (but moderated by big increase in immigration) = big problems for the RBA. But, even bigger problems for Aussies in lower paid jobs. Housing market is imploding in many parts and fixed rate cliff commences in April 2023…if RBA keeps hiking there will likely be a recession in 2H23. Tough year ahead for the average Joe. Only time can heal the D-S imbalances. Lowe should walk before he does any more damage.
Dear Michael (at 2022/10/29 at 5:43 am)
I don’t really know what you are on about.
1. I have never said that the current inflation is not a problem. I said it was not being driven by additional propagation mechanisms, such as a wage-price spiral, which means it is transitory and driven by known supply-side factors.
I also stressed transitory doesn’t mean short-term and those supply constraints could last for a long time.
I also emphasised the damage it does to real incomes and workers real wages.
2. I made no projections or forecasts.
3. My main point is that treating it as a demand-side problem that has to be dealt with via hard spending cuts (via fiscal policy) or attempting spending cuts (via interest rate hikes) would be destructive and unlikely to actually target the inflationary sources. That has been my main message.
I have emphasised that the better policy approach would be to compensate low income families using fiscal policy (as they are doing in Japan) because inflation is a big problem for that cohort, and, then wait the supply factors out.
And since we started this supply-driven episode, we have had additional factors War, OPEC+, floods and bushfires.
The reason people “move away from MMT” is because characters like you misrepresent those who actually understand it.
best wishes
bill
@Michael
Though not formally trained in economics or finance, I have followed this blog almost since it’s inception in around 2009 as I recall – at no time do I remember Bill ever claiming that inflation could never become a problem or do harm. I recall his argument being that central banks response to inflationary pressures has often been wrong and misdirected – what I’m seeing at present in Australia at least appears to bear that out.
The RBA are treating what is clearly a supply-side problem as a demand-side one. They have raised the cash rate sharply but don’t appear to be having much success at taming inflation – not surprisingly since it is stemming from a global energy squeeze and is mostly concentrated in non-discretionary consumption – the last things Australian interest rates are likely to have much effect on and the things that the poorest spend most of their income on.
What they appear to be succeeding at is generally making the situation worse, with firms likely passing on higher business debt servicing costs as higher prices and landlords definitely doing so – my son has luckily signed a 12 month lease recently which will keep his rent affordable until the middle of next year (who knows what happens after that?) but my sister-in-law has copped it in the neck, with the landlord hiking the rent in response to higher rates and also reducing the tenure down to the legal minimum so that he can hike again in short order.
So we have had rising inflation in essentials (while only moderate at worst in discretionary things), falling real wages and living standards being squeezed – and it is into this environment that the RBA are hiking to try and quell “excessive consumer demand”.
Pointlessly cruel and destructive and probably fairly useless as well.
@ Michael,
“Still refusing to believe inflation is a problem …..”
It certainly feels like we have an inflation problem, in the UK, with prices rising sharply. However it is reasonable to ask if rising prices are a sufficient indicator especially as the major factors which cause those increases are outside of UK government control.
If we have a poor apple crop the price of apples will rise. Would this mean we had an inflation problem?
We need to rethink our definition. increasing interest rates and/or putting up taxes isn’t going to create any more apples! Or gas!
Interesting you are happy to use market data as the most reliable forecast for inflation, but implicitly dismiss the fact that the same market data is predicated on interest rates rising to 4%+ next year. The two are linked – if the market thought rates were going to stay artificially low, the implied inflation forecast would be much higher than 2.2%
@Jacob, 1st who were you replying to?
2nd, why don’t you reply with your opinion of Bill’s proposed response to the problem that he agrees that inflation is? Bill would not have proposed to have to Gov. send checks to low-income people if he thought inflation was not a problem.
.