In the 1990s, a new industry was created in Australia. It produced nothing. But it…
Australian labour market – slowing to a halt
The Australian Bureau of Statistics (ABS) released of the latest labour force data today (October 20, 2022) – Labour Force, Australia – for September 2022. The labour market slowed markedly in September 2022 with employment hardly increasing (0.01 per cent) and unemployment pushing up a little due to the labour force growing more than employment. With the participation rate constant, this signals a deteriorating situation. The underlying (‘What-if’) unemployment rate is closer to 6.1 per cent rather than the official rate of 3.5 per cent. There are still 1346.8 thousand Australian workers without work in one way or another (officially unemployed or underemployed). The only reason the unemployment rate is so low is because the underlying population growth remains low after the border closures over the last two years. But that is changing as immigration increases. Overall, the situation deteriorated a bit over September.
The summary ABS Labour Force (seasonally adjusted) estimates for September 2022 are:
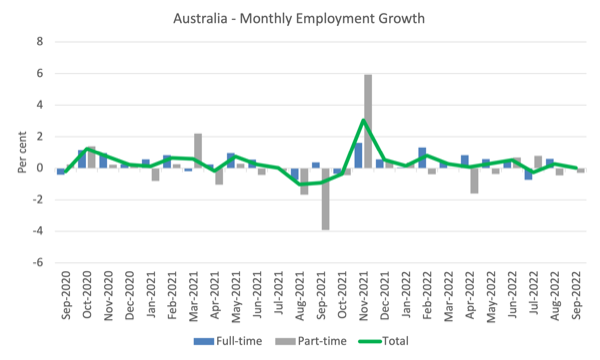
- Employment increased by 900 (0.01 per cent) – full-time employment increased by 13,300 and part-time employment decreased by 12,400.
- Unemployment rose by 8,800 to 499,400 persons.
- The official unemployment rate was unchanged at 3.5 per cent.
- The participation rate was unchanged at 66.6 per cent.
- The employment-population ratio decreased by 0.1 point to 64.2 per cent.
- Aggregate monthly hours decreased by 1,853 million hours (-0.6 per cent).
- Underemployment was unchanged at 6 per cent (a modest rise of 9.4 thousand). Overall there are 847.4 thousand underemployed workers. The total labour underutilisation rate (unemployment plus underemployment) rose 0.2 points 9.6 per cent. There were a total of 1346.8 thousand workers either unemployed or underemployed.
In its – Media Release – the ABS noted that:
The seasonally adjusted unemployment rate remained at 3.5 per cent in September 2022 …
Seasonally adjusted employment increased by 1,000 people (0.01 per cent) in September 2022, which was less than the percentage increase in the population aged 15 and over (0.08 per cent) …
The participation rate remained steady at 66.6 per cent, in seasonally adjusted terms, consistent with the relatively small changes in employment and unemployment …
While employment growth has slowed in recent months, there are still close to half a million people entering employment each month, and around the same number leaving employment each month.
So net employment growth has fallen considerably, which may be the harbinger of worse to come as the impact of the rising interest rates and government cutbacks start to interact.
Employment increased by 900 (0.01 per cent) in September 2022
1. Full-time employment increased by 58,800 and part-time employment decreased by 25,300.
2. The employment-population ratio decreased by 0.1 point to 64.2 per cent.
3. Employment in Australia is 596.8 thousand (net) jobs (4.6 per cent) above the pre-pandemic level in February 2020.
The following graph shows the month by month growth in full-time (blue columns), part-time (grey columns) and total employment (green line) for the 24 months to September 2022 using seasonally adjusted data.
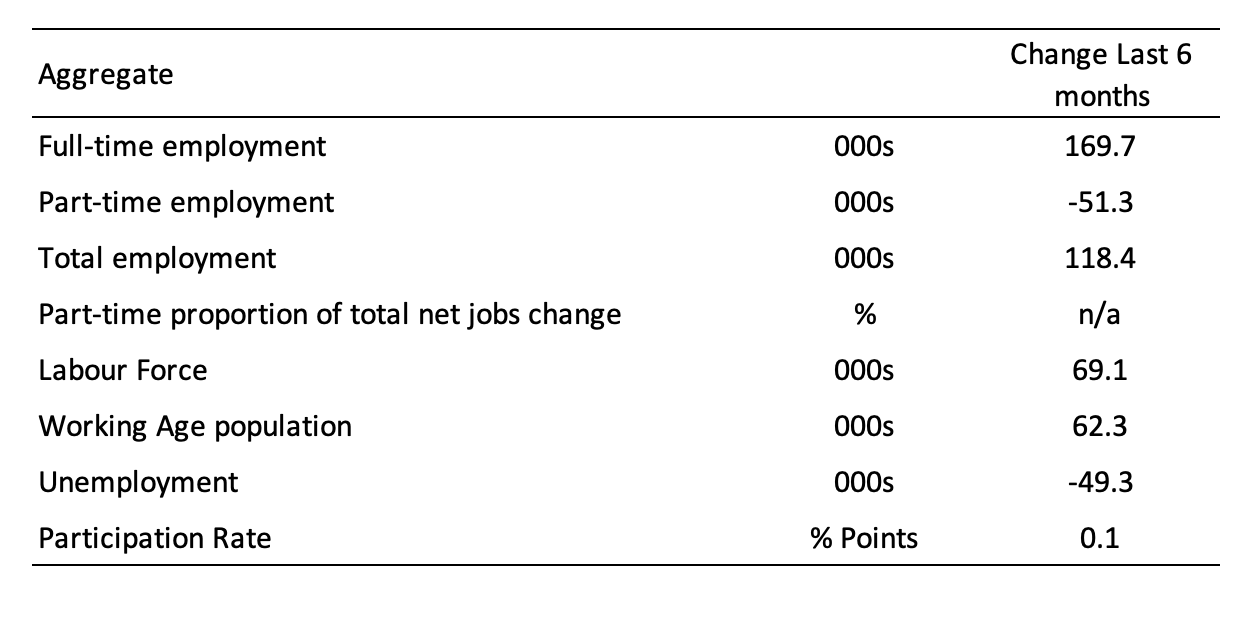
The following table provides an accounting summary of the labour market performance over the last six months to provide a longer perspective that cuts through the monthly variability and provides a better assessment of the trends.
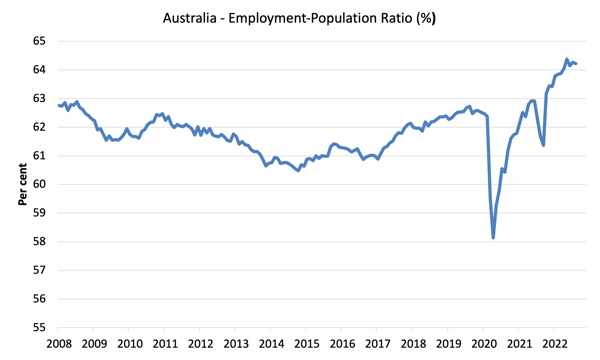
Given the variation in the labour force estimates, it is sometimes useful to examine the Employment-to-Population ratio (%) because the underlying population estimates (denominator) are less cyclical and subject to variation than the labour force estimates. This is an alternative measure of the robustness of activity to the unemployment rate, which is sensitive to those labour force swings.
The following graph shows the Employment-to-Population ratio, since April 2008 (that is, since the GFC).
The ratio decreased by 0.1 point to 64.2 per cent in September 2022 – showing a deteriorating situation.
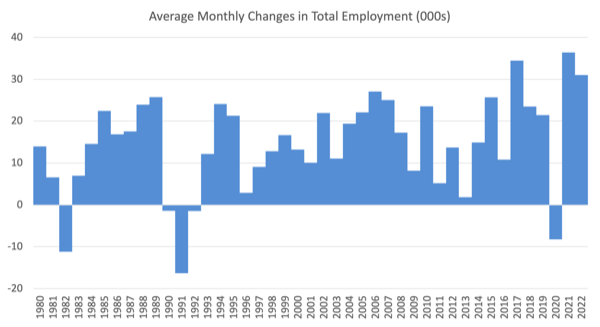
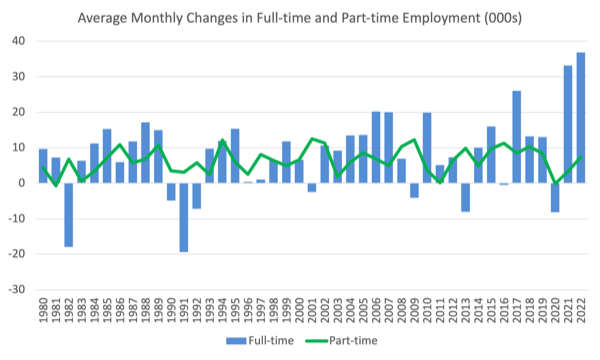
For perspective, the following graph shows the average monthly employment change for the calendar years from 1980 to 2022 (to date).
1. The average employment change over 2020 was -8.4 thousand which rose to 36.3 thousand in 2021 as the lockdowns eased.
3. So far in 2022, the average monthly change is 31 thousand and falling as the months pass.
The following graph shows the average monthly changes in Full-time and Part-time employment (lower panel) in thousands since 1980.
The interesting result is that during recessions or slow-downs, it is full-time employment that takes the bulk of the adjustment. Even when full-time employment growth is negative, part-time employment usually continues to grow.
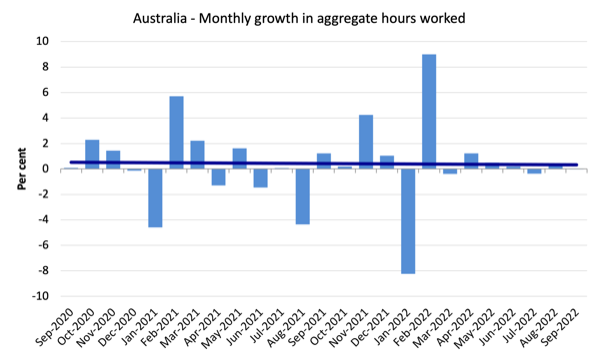
Hours worked decreased by 1,853 million hours (-0.6 per cent) in September 2022
A substantial decrease as activity slows
The following graph shows the monthly growth (in per cent) over the last 24 months.
The dark linear line is a simple regression trend of the monthly change (skewed by the couple of outlier results).
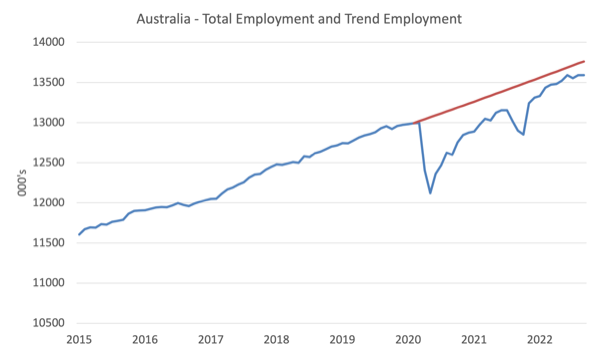
Actual and Trend Employment
The Australian labour market is now larger than it was in February 2020. But it is still some way from where it would have been if it had have continued to expand at the previous trend.
The following graph shows total employment (blue line) and what employment would have been if it had continued to grow according to the average growth rate between 2015 and April 2020.
In September 2022, the gap increased by 24.69 thousand to 171.6 thousand jobs as a result of the employment slowdown.
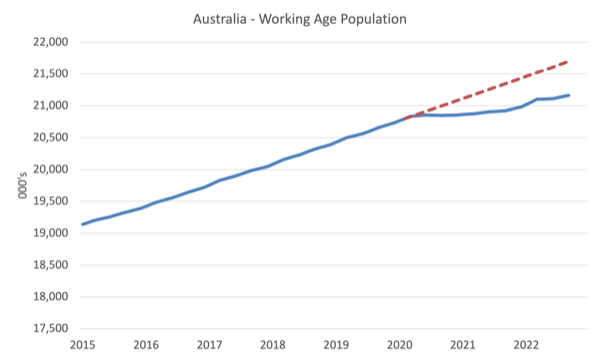
The Population Slowdown – the ‘What-if’ unemployment analysis
The following graph shows Australia’s working age population (Over 15 year olds) from January 2015 to September 2022. The dotted line is the projected growth had the pre-pandemic trend continued.
The difference between the lines is the decline in the working age population that followed the Covid restrictions on immigration.
The civilian population is 534.1 thousand less in September 2022 than it would have been had pre-Covid trends continued.
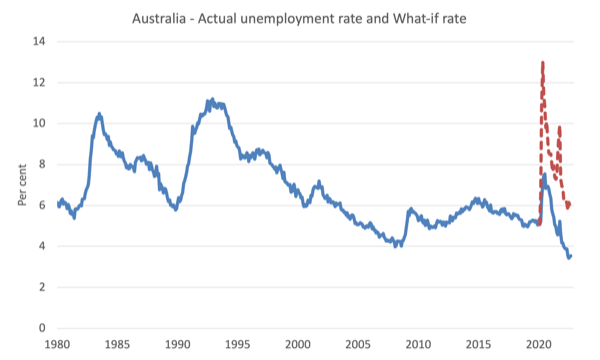
The following graph shows the evolution of the actual unemployment rate since January 1980 to September 2022 and the dotted line is the ‘What-if’ rate, which is calculated by assuming the most recent peak participation rate (recorded at June 2022 = 66.7 per cent), the extrapolated working age population (based on growth rate between 2015 and February 2020) and the actual employment since February 2020.
It shows what the unemployment rate would have been given the actual employment growth had the working age population trajectory followed the past trends.
In this blog post – External border closures in Australia reduced the unemployment rate by around 2.7 points (April 28, 2022), I provided detailed analysis of how I calculated the ‘What-if’ unemployment rate.
So instead of an unemployment rate of 3.5 per cent, the rate would have been 6.1 per cent in September 2022, given the employment performance since the pandemic.
This finding puts a rather different slant to what has been happening since the onset of the pandemic.
Unemployment rose by 8,800 to 499,400 persons in September 2022
Unemployment rose because the net rise in employment (900 thousand) was less than the rise in the labour force (9.8 thousand).
With the participation rate constant, this signals an improving situation.
Also so bear in mind the ‘What-if’ analysis above and see the impact of the fall in participation below.
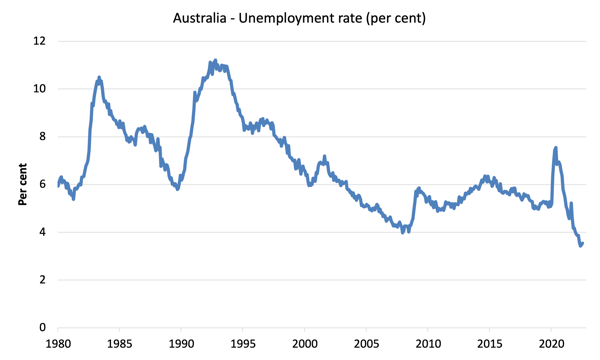
The following graph shows the national unemployment rate from April 1980 to September 2022. The longer time-series helps frame some perspective to what is happening at present.
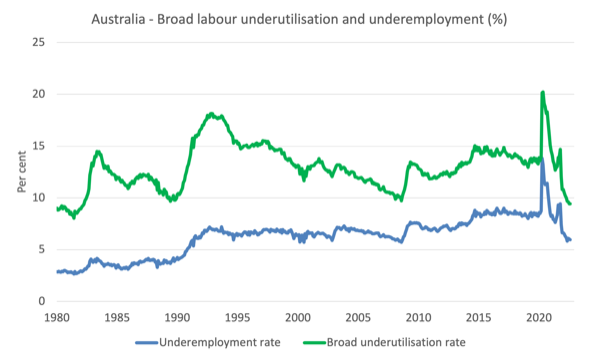
Broad labour underutilisation rose 0.2 points 9.6 per cent in September 2022
1. Underemployment was unchanged at 6 per cent (a modest rise of 9.4 thousand).
2. Overall there are 847.4 thousand underemployed workers.
3. The total labour underutilisation rate (unemployment plus underemployment) rose 0.2 points 9.6 per cent. Rounded up both unemployment and underemployment rose, hence the 0.2 points rise.
4. There were a total of 1346.8 thousand workers either unemployed or underemployed.
The following graph plots the seasonally-adjusted underemployment rate in Australia from April 1980 to the September 2022 (blue line) and the broad underutilisation rate over the same period (green line).
The difference between the two lines is the unemployment rate.
The three cyclical peaks correspond to the 1982, 1991 recessions and the more recent downturn.
The other difference between now and the two earlier cycles is that the recovery triggered by the fiscal stimulus in 2008-09 did not persist and as soon as the ‘fiscal surplus’ fetish kicked in in 2012, things went backwards very quickly.
The two earlier peaks were sharp but steadily declined. The last peak fell away on the back of the stimulus but turned again when the stimulus was withdrawn.
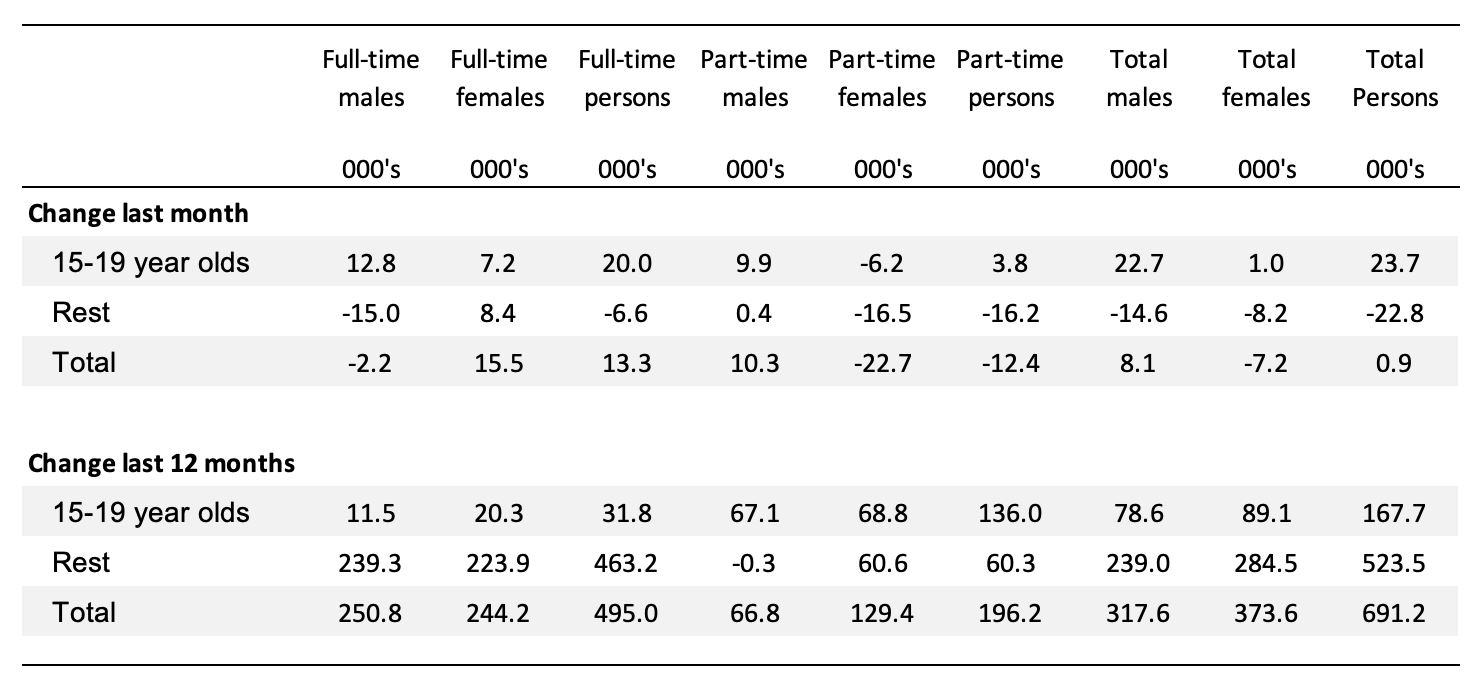
Teenage labour market improved in September 2022
Both full- and part-time employment for teenagers rose in September defying the overall slowdown.
The following Table shows the distribution of net employment creation in the last month and the last 12 months by full-time/part-time status and age/gender category (15-19 year olds and the rest).
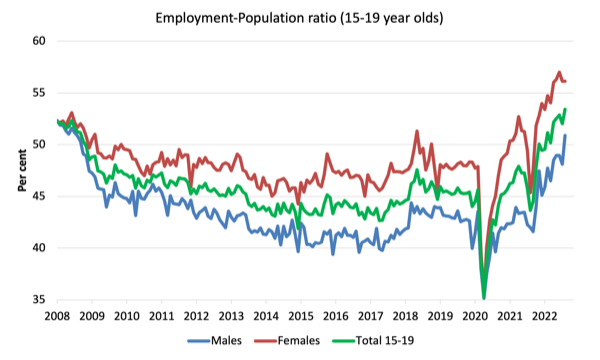
To put the teenage employment situation in a scale context (relative to their size in the population) the following graph shows the Employment-Population ratios for males, females and total 15-19 year olds since June 2008.
You can interpret this graph as depicting the loss of employment relative to the underlying population of each cohort.
1. The male ratio has fallen by 4.2 percentage points since April 2008. It fell by 0.8 points over the month. It is now 4.6 points above its level in March 2020.
2. The female ratio is 4 percentage points above the April 2008 level. It fell by 0.9 points over the month. It is now 8.3 points above its level in March 2020.
3. The overall teenage employment-population ratio has fallen by 0.2 percentage points since April 2008. It fell by 0.8 points over the month. It is now 6.4 points above its level in March 2020.
4. So female teenagers have been doing better in relative terms than male teenagers.
Conclusion
My standard monthly warning: we always have to be careful interpreting month to month movements given the way the Labour Force Survey is constructed and implemented.
My overall assessment is:
1. The labour market slowed markedly in September 2022 with employment hardly increasing (0.01 per cent) and unemployment pushing up a little due to the labour force growing more than employment.
2. With the participation rate constant, this signals a deteriorating situation.
3. The underlying (‘What-if’) unemployment rate is closer to 6.1 per cent rather than the official rate of 3.5 per cent.
4. There are still 1346.8 thousand Australian workers without work in one way or another (officially unemployed or underemployed). The only reason the unemployment rate is so low is because the underlying population growth remains low after the border closures over the last two years. But that is changing as immigration increases.
That is enough for today!
(c) Copyright 2022 William Mitchell. All Rights Reserved.
Unemployment is the main plank of macro-economic policy in the west.
Unemployment drives wage levels. Wage levels condition inflation.
To heighten unemployment rates, governments are keen on wrecking the economy.
CBs are hiking interest rates to ruin small and medium size businesses (big business is safe, with bail-outs to be given as needed), but the FIRE sector has been flooded with money, and so there’s a lag between the cause and the consequence. A big lag.
The FIRE sector is learning to set monetary policy.
It’s happening in the US and in the UK.
Central banks are becoming dummies.
Hello to the new order, the fascist order.
@Paulo Rodrigues hi, from a British perspective, I wouldn’t say that ‘Unemployment is the main plank of macro-economic policy’. It certainly was in the 1980s when UK official unemployment was over 3 million for over 6 years. But that and further years of indebting the workforce and weakening terms and conditions and bargaining power, have made it less so. Of course, they have no problem with a threat of unemployment should the workforce show signs of uppityness, which it is at last doing. I’m aware that elsewhere in Europe, unemployment has been a greater factor more recently. And not limited to the west – China also has a significant unemployment/underemployed problem, but this is more to do with scale and an economy still in huge transition rather than government policy.
I’d also say that although the UK government’s actions might look like intentional destruction, they don’t see it like that. It’s just that their priorities for what is important in the economy are rather twisted. To be encouraged and given most support is the FIRE sector, supported by monetary policy, former nationalised industries with private masters sucking on the government’s teat are next, small business much less important, and workers of the non-profession variety are to be treated like the peasants their forebears were.