In addition to the basis academic research that occupies my working time and is funded…
US labour market – weaker but employment growth remains positive
Last Friday (October 7, 2022), the US Bureau of Labor Statistics (BLS) released their latest labour market data – Employment Situation Summary – September 2022 – which reported a total payroll employment rise of only 263,000 jobs (further slowdown) and a drop (0.2 points) in the official unemployment rate to 3.5 per cent. Total labour force survey employment rose by just 204 thousand net (0.13 per cent), while the labour force declined by 57 thousand net (0.03 per cent) as a result of the decline in the participation rate of 0.1 points to 62.3 per cent. 4. As a result (in accounting terms), total measured unemployment fell by 261 thousand to 5,753 thousand which is why the unemployment rate fell by 0.2 points. However, while the unemployment rate fell, the combination of weakening employment growth and falling participation is a sign of a faltering labour market. There are also no fundamental wage pressures emerging at present to drive any further inflation spikes. Wages growth appears to be reactive to inflation rather than propelling it. The claim that wage pressures are now pushing inflation is untenable given the data.
Overview for September 2022 (seasonally adjusted):
- Payroll employment increased by 263,000.
- Total labour force survey employment rose by just 204 by thousand net (-0.13 per cent).
- The labour force fell by 57 thousand net (0.03 per cent).
- The employment-population ratio was unchanged on 60.1 per cent (still lower than the May 2020 peak of 61.2).
- Total measured unemployment fell by 261 thousand to 5,753 thousand.
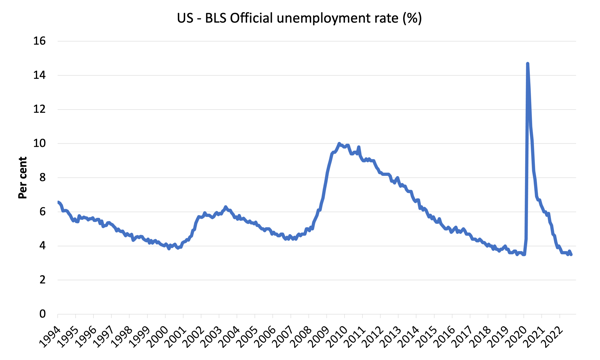
- The official unemployment rate fell 0.2 points to 3.5 per cent.
- The participation rate fell by 1 points to 62.34 per cent.
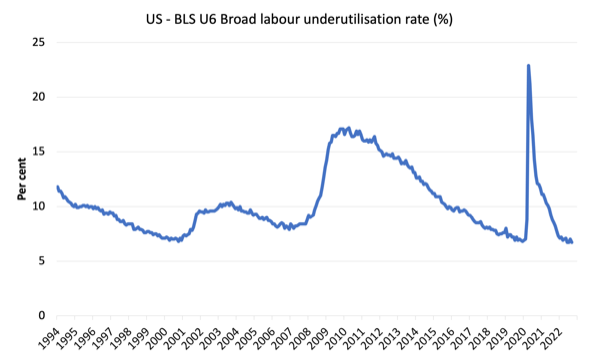
- The broad labour underutilisation measure (U6) fell 0.3 points to 6.7 per cent.
For those who are confused about the difference between the payroll (establishment) data and the household survey data you should read this blog post – US labour market is in a deplorable state – where I explain the differences in detail.
Some months the difference is small, while other months, the difference is larger.
The differences were quite large this month.
Payroll employment trends
The BLS noted that:
Total nonfarm payroll employment increased by 263,000 in September. Monthly job growth has averaged 420,000 thus far in 2022, compared with 562,000 per month in 2021. In September, notable job gains occurred in leisure and hospitality and in health care …
Leisure and hospitality added 83,000 jobs in September, in line with the average monthly job gain over the first 8 months of the year … is below its pre-pandemic February 2020 level by 1.1 million, or 6.7 percent.
In September, employment in health care rose by 60,000 and has returned to its February 2020 level …
Employment in professional and business services continued its upward trend in September (+46,000). Thus far in 2022, job growth in the industry has averaged 72,000 per month …
Manufacturing employment continued to trend up in September (+22,000) … has added an average of 36,000 jobs per month thus far in 2022.
In September, employment in construction continued to trend up (+19,000), in line with average monthly job growth in the first 8 months of this year.
Employment in wholesale trade continued its upward trend in September (+11,000). Wholesale trade has added an average of 18,000 jobs per month thus far in 2022 …
Employment showed little change over the month in other major industries
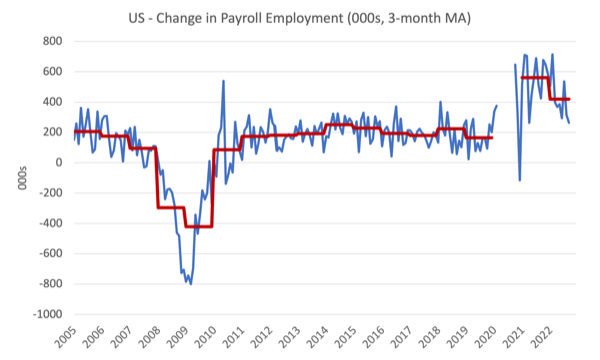
The first graph shows the monthly change in payroll employment (in thousands, expressed as a 3-month moving average to take out the monthly noise). The red lines are the annual averages. I left out the observations between January 2020 and September 2020, which were so extreme that they make it harder to compare the current period with the pre-pandemic history.
The US labour market has now exceeded the pre-pandemic level by 514 thousand jobs although the gains are not even across the sectors as detailed above.
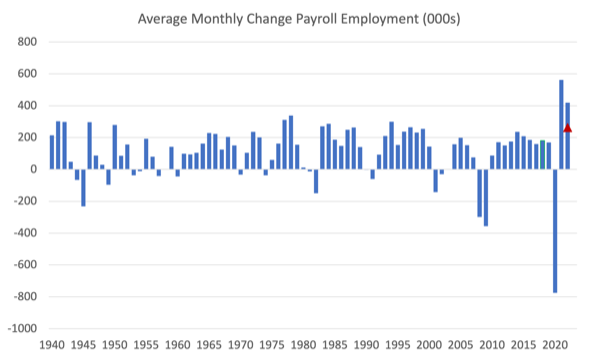
The next graph shows the same data in a different way – in this case the graph shows the average net monthly change in payroll employment (actual) for the calendar years from 2005 to 2021.
The red marker on the column is the current month’s result.
The final average for 2019 was 164 thousand.
The final average for 2020 was -774 thousand.
The final average for 2021 was 562 thousand.
The average so far in 2022 is 420 thousand and falling fast.
Labour Force Survey data – employment growth positive but subdued
The seasonally-adjusted data for September 2022 reveals:
1. Total labour force survey employment rose by just 2042 thousand net (-0.13 per cent).
2. The labour force declined by 57 thousand net (0.03 per cent).
3. The participation rate fell by 0.1 points to 62.3 per cent.
4. As a result (in accounting terms), total measured unemployment fell by 261 thousand to 5,753 thousand and the official unemployment rate fell by 0.2 points to 3.5 per cent.
While the unemployment rate fell, the combination of weakening employment growth and falling participation is a sign of a faltering labour market.
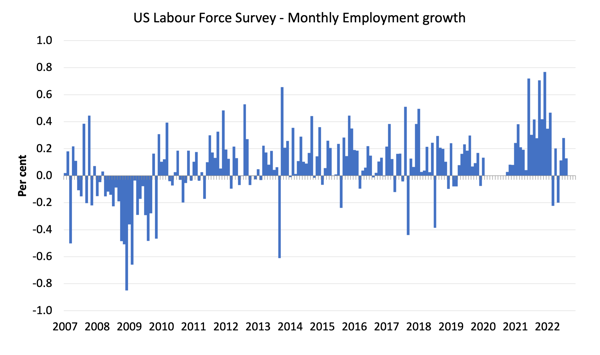
The following graph shows the monthly employment growth since January 2008 and excludes the extreme observations (outliers) between May 2020 and October 2020, which distort the current period relative to the pre-pandemic period.
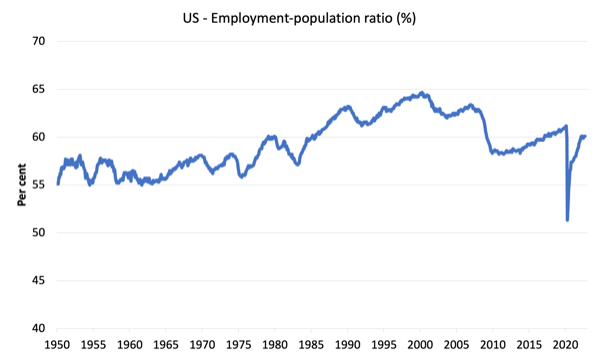
The Employment-Population ratio is a good measure of the strength of the labour market because the movements are relatively unambiguous because the denominator population is not particularly sensitive to the cycle (unlike the labour force).
The following graph shows the US Employment-Population from January 1950 to September 2022.
While the ratio fluctuates a little, the May 2020 ratio fell by 8.6 points to 51.3 per cent, which is the largest monthly fall since the sample began in January 1948.
In September 2022, the ratio was unchanged at 60.1 per cent.
The peak level in May 2020 before the pandemic was 61.1 per cent.
Unemployment and underutilisation trends
The BLS note that:
The unemployment rate edged down to 3.5 percent in September, returning to its July level. The number of unemployed persons edged down to 5.8 million in September ….
The number of long-term unemployed (those jobless for 27 weeks or more) was little changed at 1.1 million in September. The long-term unemployed accounted for 18.5 percent of all unemployed persons …
The number of persons employed part time for economic reasons decreased by 306,000 to 3.8 million in September. These individuals, who would have preferred full-time employment, were working part time because their hours had been reduced or they were unable to find full-time jobs …
The reasons the unemployment rate fell in September were:
1. Employment growth was positive (but modest).
2. The labour force contracted marginally as the participation rate edged down.
The first graph shows the official unemployment rate since January 1994.
The official unemployment rate is a narrow measure of labour wastage, which means that a strict comparison with the 1960s, for example, in terms of how tight the labour market, has to take into account broader measures of labour underutilisation.
The next graph shows the BLS measure U6, which is defined as:
Total unemployed, plus all marginally attached workers plus total employed part time for economic reasons, as a percent of all civilian labor force plus all marginally attached workers.
It is thus the broadest quantitative measure of labour underutilisation that the BLS publish.
Pre-COVID, U6 was at 6.8 per cent (December 2019).
In September 2022 the U6 measure was 6.7 per cent, an decrease of 0.3 points – basically reversing the rise in August.
The decline was because unemployment fell and workers forced to work part-time for economic reasons – which is the US indicator of underemployment – also fell.
What are wages doing in the US?
With inflation rising sharply at present and the Federal Reserve pretending there is a major wage problem that needs to be disciplined with rising mass unemployment, one would expect to see strong nominal wages growth pushing the price level along.
The BLS reported that:
In September, average hourly earnings for all employees on private nonfarm payrolls rose by 10 cents, or 0.3 percent, to $32.46. Over the past 12 months, average hourly earnings have increased by 5.0 percent. In September, average hourly earnings of private-sector production and nonsupervisory employees rose by 10 cents, or 0.4 percent, to $27.77.
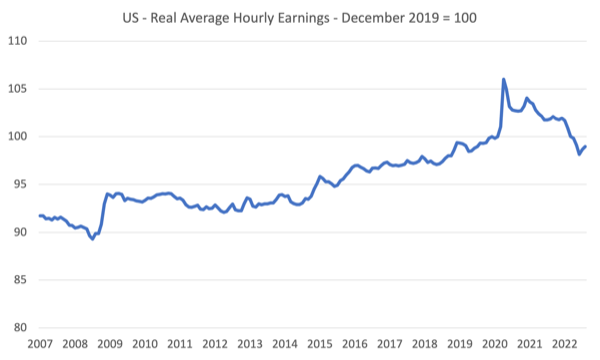
However, the latest – BLS Real Earnings Summary (published September 13, 2022) – tells us that:
Real average hourly earnings decreased 2.8 percent, seasonally adjusted, from August 2021 to August 2022.
The following graph shows movements in real average hourly earnings (indexed at 100 at December 2019) up to September 2022.
The August CPI started to decline and we assume that decline will continue. Average hourly earnings rose by 0.31 per cent in September which was slower than growth recorded in June and July, when inflation was much higher.
Overall, it is hard to say the inflation episode is a ‘wages story’.
The other indicator that tells us whether the labour market is turning in favour of workers is the quit rate.
The most recent BLS data shows that the the quit rate has been relatively stable over the last year falling slightly from 2.8 to 2.7 per cent of total employment between August 2021 and August 2022.
Conclusion
In September 2022, the US labour market showed signs of slowing further, with payroll employment growing by just 263,000 net jobs and labour force growth turning negative as the participation edged down.
The official unemployment and the unemployment rate thus fell.
There are also no fundamental wage pressures emerging at present to drive any further inflation spikes. Wages growth appears to be reactive to inflation rather than propelling it.
That is enough for today!
(c) Copyright 2022 William Mitchell. All Rights Reserved.
With the hawkish interest rates hikes taken by the NY Fed, the US Labour Market will degenerate, just as expected by J. Powell, who is assumedely targeting high unemployment.
Probably, the US is benefitting now from massive capital transfers, as other currencies are beeing sold massively, to buy USD, to buy US debt (treasury bonds) – suddenly yielding a good return, in a world with narrowing options to invest in safe assets.
But that comes with a price.
Everyone is waiting for the midterm election to take place and then, probably, we’ll have Lehmman Brothers 2.0 (we have already several good candidates for the contest), and the “party” will be over.
For now, nobody wants to bring MAGA again to the fore – even though if it’s highly probable that it will happen.
And that leaves us with a question: what’s the difference between MMT and the colossal “money printing” (MAGA included) taken by the Fed since the end of Bretton Woods?
MMT is the mechanics (the lens) of any fiat currency.
The difference lies in politics.
Politics can ruin an economy and bring high inflation (and, if not tackled effectively, turn into hyperinflation).
We already have high inflation.
Nothing to do with MMT.
It’s all about choices – political choices.