On May 19, 2026, Oxfam Australia's media release - Australian billionaires’ wealth grows by $50,000…
Australian labour market deteriorating as employment and participation contract
The Australian Bureau of Statistics (ABS) released of the latest labour force data today (August 18, 2022) – Labour Force, Australia – for July 2022. With Covid infection rates rising quickly, and already around 780,000 workers working few hours than usual because of sickness, I predicted last month that there would be a deterioration in the labour market in the coming months. That trend emerged in July 2022. The labour market deteriorated in July 2022 with employment and participation both contracting. While the official unemployment rate fell to 3.4 per cent this was all down to the decline in participation. Had the participation rate not declined the unemployment rate would have risen from 3.6 per cent to 3.9 per cent. Further, the underlying (‘What-if’) unemployment rate is closer to 6.1 per cent rather than the official rate of 3.4 per cent. There are still 1313.7 thousand Australian workers without work in one way or another (officially unemployed or underemployed). The only reason the unemployment rate is so low is because the underlying population growth remains low after the border closures over the last two years. Overall, the situation worsened over July.
The summary ABS Labour Force (seasonally adjusted) estimates for July 2022 are:
- Employment decreased by 40,900 (-0.3 per cent) – full-time employment decreased by 86,900 and part-time employment increased by 46,000.
- Unemployment fell by 20,200 to 473,600 persons.
- The official unemployment rate fell 0.1 points to 3.4 per cent.
- The participation rate decreased 0.4 points to 66.4 per cent.
- The employment-population ratio decreased by 0.2 points to 64.2 per cent.
- Aggregate monthly hours decreased by 16 million hours (-0.8 per cent).
- Underemployment decreased by 0.1 point to 6 per cent (a fall of 17 thousand). Overall there are 840 thousand underemployed workers. The total labour underutilisation rate (unemployment plus underemployment) fell by 0.2 points to 9.4 per cent. There were a total of 1313.7 thousand workers either unemployed or underemployed.
In its – Media Release – the ABS noted that:
With employment falling by 41,000 people and the number of unemployed people also decreasing by 20,000, the unemployment rate fell by 0.1 percentage points, to 3.4 per cent …
The fall in unemployment in July reflects an increasingly tight labour market, including high job vacancies and ongoing labour shortages, resulting in the lowest unemployment rate since August 1974 …
If you analyse these two statements from the ABS you will soon realise they are contradictory.
The reason unemployment fell in July is not because of an increasingly tight labour market but because workers gave up looking for jobs in a weakening labour market.
Further, the so-called “on-going labour shortages”, while true in some specific sectors is inconsistent with the failure of wages to grow.
Employers are telling the media there are shortages but what is really going on is that they are banking profits and refuse to pay higher wages and allow their workers to share in the productivity growth.
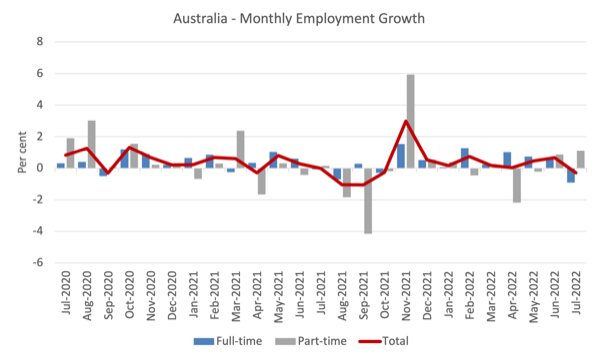
Employment decreased by 40,900 (-0.3 per cent) in July 2022
1. Full-time employment decreased by 86,900 and part-time employment increased by 46,000.
2. The Employment-population ratio fell by 0.2 points to 64.2 per cent.
3. Employment in Australia is 598.4 thousand (net) jobs (4.6 per cent) above the pre-pandemic level in February 2020.
The following graph shows the month by month growth in full-time (blue columns), part-time (grey columns) and total employment (green line) for the 24 months to July 2022 using seasonally adjusted data.
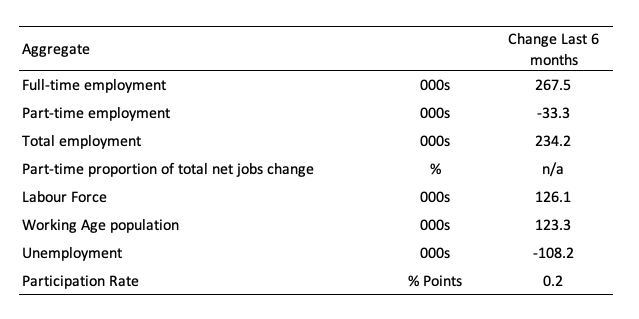
The following table provides an accounting summary of the labour market performance over the last six months to provide a longer perspective that cuts through the monthly variability and provides a better assessment of the trends.
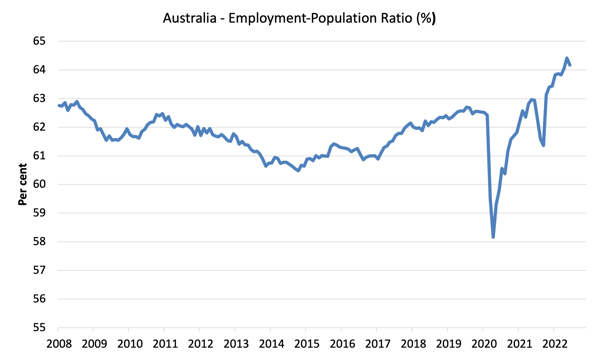
Given the variation in the labour force estimates, it is sometimes useful to examine the Employment-to-Population ratio (%) because the underlying population estimates (denominator) are less cyclical and subject to variation than the labour force estimates. This is an alternative measure of the robustness of activity to the unemployment rate, which is sensitive to those labour force swings.
The following graph shows the Employment-to-Population ratio, since April 2008 (that is, since the GFC).
There are two forces working here – the denominator (population) is clearly pushing the ratio down due to the slower population growth as the external border openings take a while to impact on inflow.
This is forcing employers to search harder for workers already in Australia rather than discriminate against the unemployed.
The numerator (employment) is clearly positive.
The ratio decreased by 0.2 points to 64.2 per cent in July 2022 – showing a declining situation.
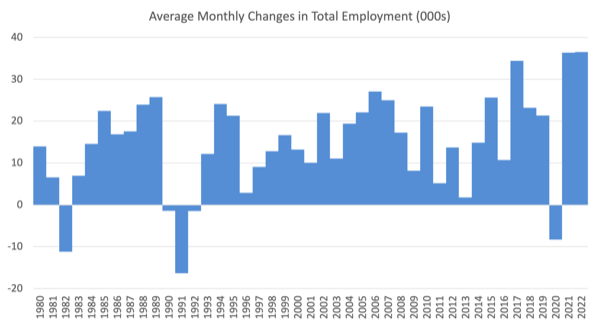
For perspective, the following graph shows the average monthly employment change for the calendar years from 1980 to 2022 (to date).
1. The average employment change over 2020 was -8.4 thousand which rose to 36.3 thousand in 2021 as the lockdowns eased.
3. So far in 2022, the average monthly change is 36.5 thousand.
The following graph shows the average monthly changes in Full-time and Part-time employment (lower panel) in thousands since 1980.
The interesting result is that during recessions or slow-downs, it is full-time employment that takes the bulk of the adjustment. Even when full-time employment growth is negative, part-time employment usually continues to grow.

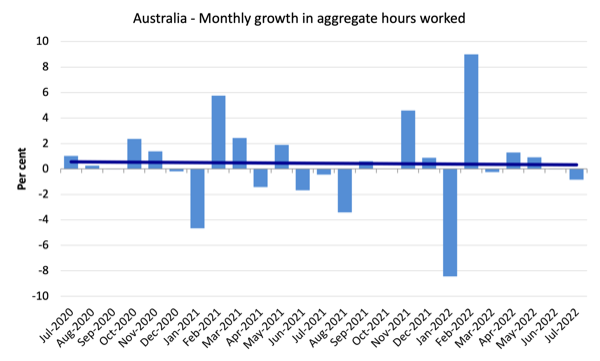
Hours worked fell by 15.6 millions hours (-0.84 per cent) in July 2022
More evidence that the labour market is not overheating is the recent trend in hours worked – very modest growth interspersed with contractions.
The following graph shows the monthly growth (in per cent) over the last 24 months.
The dark linear line is a simple regression trend of the monthly change (skewed by the couple of outlier result).
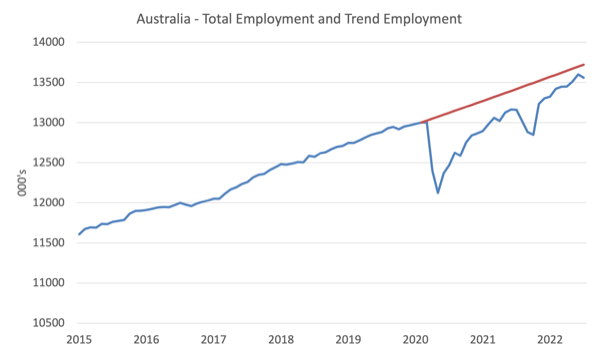
Actual and Trend Employment
The Australian labour market is now larger than it was in April 2020. But it is still some way from where it would have been if it had have continued to expand at the previous trend.
The following graph shows total employment (blue line) and what employment would have been if it had continued to grow according to the average growth rate between 2015 and April 2020.
In July 2022, the gap rose by 66.5 thousand to 163.7 thousand jobs as a result of the employment contraction.
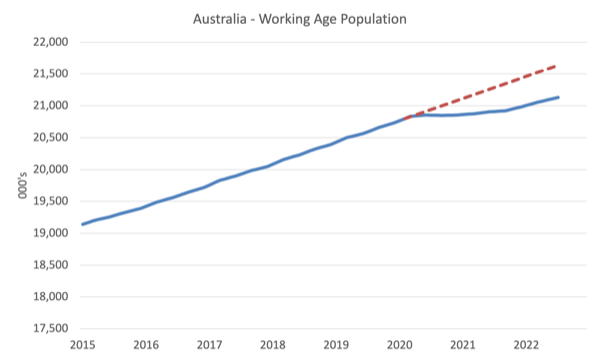
The Population Slowdown – the ‘What-if’ unemployment analysis
The following graph shows Australia’s working age population (Over 15 year olds) from January 2015 to July 2022. The dotted line is the projected growth had the pre-pandemic trend continued.
The difference between the lines is the decline in the working age population due to the Covid restrictions.
The civilian population is 509.9 thousand less in July 2022 than it would have been had pre-Covid trends continued.
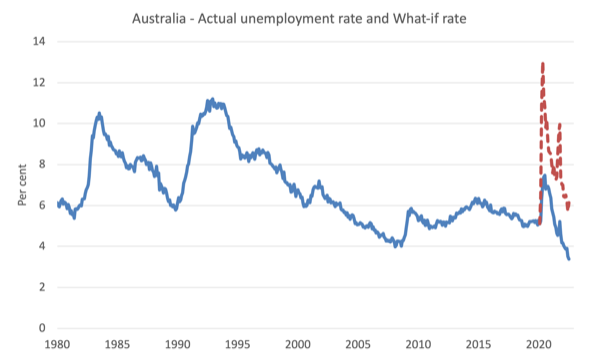
The following graph shows the evolution of the actual unemployment rate since January 1980 to July 2022 and the dotted line is the ‘What-if’ rate, which is calculated by assuming the most recent peak participation rate (recorded at July 2022 = 66.8 per cent), the extrapolated working age population (based on growth rate between 2015 and April 2020) and the actual employment since April 2020.
It shows what the unemployment rate would have been given the actual employment growth had the working age population trajectory followed the past trends.
In this blog post – External border closures in Australia reduced the unemployment rate by around 2.7 points (April 28, 2022), I provided detailed analysis of how I calculated the ‘What-if’ unemployment rate.
So instead of an unemployment rate of 3.4 per cent, the rate would have been 6.1 per cent in July 2022, given the employment performance since the pandemic.
This finding puts a rather different slant to what has been happening since the onset of the pandemic.
Unemployment fell by 20,200 to 473,600 persons in July 2022
Unemployment fell his month despite the fall in employment because the decline in the participation rate (and subsequent decline in the labour force) was larger.
That signals are worsening situation even though the unemploymen rate fell 0.2 points to 3.4 per cent.
Also so bear in mind the ‘What-if’ analysis above and see the impact of the fall in participation below.
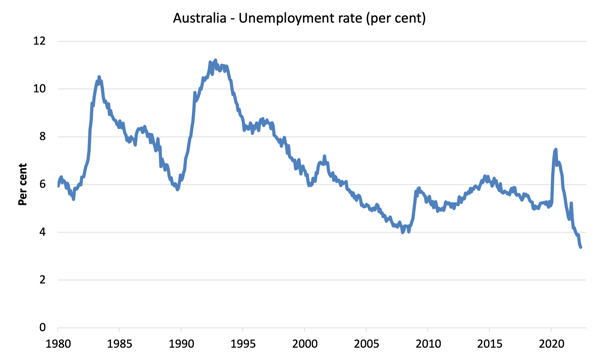
The following graph shows the national unemployment rate from April 1980 to July 2022. The longer time-series helps frame some perspective to what is happening at present.
Broad labour underutilisation fell by 0.2 points to 9.4 per cent in July 2022
The results for July 2022 are (seasonally adjusted):
1. Underemployment decreased by 0.1 point to 6 per cent (a fall of 17 thousand).
2. Overall there are 840 thousand underemployed workers.
3. The total labour underutilisation rate (unemployment plus underemployment) fell by 0.2 points to 9.4 per cent.
4. There were a total of 1313.7 thousand workers either unemployed or underemployed.
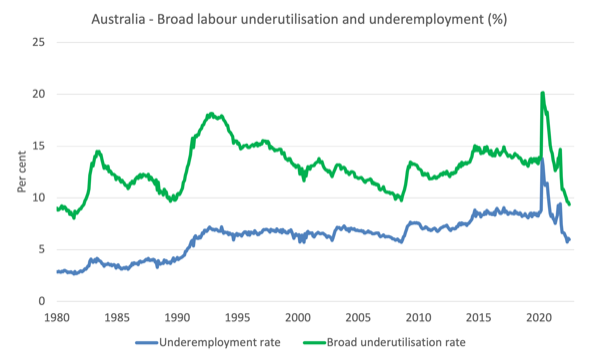
The following graph plots the seasonally-adjusted underemployment rate in Australia from April 1980 to the July 2022 (blue line) and the broad underutilisation rate over the same period (green line).
The difference between the two lines is the unemployment rate.
The three cyclical peaks correspond to the 1982, 1991 recessions and the more recent downturn.
The other difference between now and the two earlier cycles is that the recovery triggered by the fiscal stimulus in 2008-09 did not persist and as soon as the ‘fiscal surplus’ fetish kicked in in 2012, things went backwards very quickly.
The two earlier peaks were sharp but steadily declined. The last peak fell away on the back of the stimulus but turned again when the stimulus was withdrawn.
Aggregate participation rate decreased by 0.4 points to 66.4 per cent
As noted above, given the contraction in employment the official unemployment rate would have risen had the participation rate not fallen.
The labour force is a subset of the working-age population (those above 15 years old). The proportion of the working-age population that constitutes the labour force is called the labour force participation rate. Thus changes in the labour force can impact on the official unemployment rate, and, as a result, movements in the latter need to be interpreted carefully. A rising unemployment rate may not indicate a recessing economy.
The labour force can expand as a result of general population growth and/or increases in the labour force participation rates (and vice versa).
The following Table shows the breakdown in the changes to the main aggregates (Labour Force, Employment and Unemployment) and the impact of the fall in the participation rate.

The change in the labour force in Julyl 2022 was the outcome of two separate factors:
- The underlying population growth added 11.6 thousand persons to the labour force. The population growth impact on the labour force aggregate is relatively steady from month to month but has slowed over the last year due to the external border restrictions which have drastically reduced migration rates; and
- The fall in the participation rate meant that there were 72.8 thousand workers exiting the labour force (relative to what would have occurred had the participation rate remained unchanged).
- The net result was that the labour force fell by 72.8 thousand.
Assessment:
1. If the participation rate had not have fallen in Julu 2022, total unemployment, given the current employment level, would have been 564.4 thousand rather than the official count of 473.6 thousand as recorded by the ABS – a difference of 72.8 thousand workers (the ‘participation effect’).
2. Without the fall in the participation rate, the official unemployment rate would have been 3.9 per cent (rounded) rather than its current value of 3.4 per cent).
3. In other words, the rise in labour underutilisation is being hidden outside the official labour force count.
Teenage labour market improved in July 2022
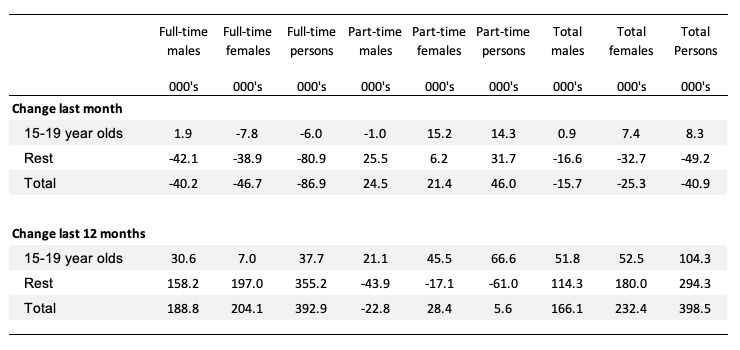
The following Table shows the distribution of net employment creation in the last month and the last 12 months by full-time/part-time status and age/gender category (15-19 year olds and the rest).
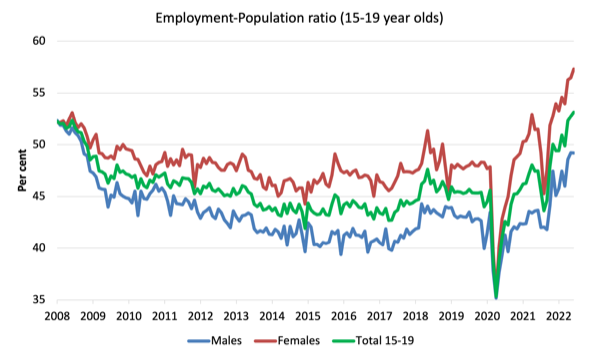
To put the teenage employment situation in a scale context (relative to their size in the population) the following graph shows the Employment-Population ratios for males, females and total 15-19 year olds since June 2008.
You can interpret this graph as depicting the loss of employment relative to the underlying population of each cohort.
1. The male ratio has fallen by 3.1 percentage points since April 2008. It was unchanged over the month. It is now 5.7 points above its level in March 2020.
2. The female ratio is 5.2 percentage points above the April 2008 level. It rose 0.9 points over the month. It is now 9.5 points above its level in March 2020.
3. The overall teenage employment-population ratio has risen by 0.9 percentage points since April 2008. It rose by 0.4 points over the month. It is now 7.5 points above its level in March 2020.
4. So female teenagers are doing better in relative terms than male teenagers.
Conclusion
My standard monthly warning: we always have to be careful interpreting month to month movements given the way the Labour Force Survey is constructed and implemented.
My overall assessment is:
1. The labour market deteriorated in July 2022 with employment and participation both contracting.
2. While the official unemployment rate fell to 3.4 per cent this was all down to the decline in participation. Had the participation rate not declined the unemployment rate would have risen from 3.6 per cent to 3.9 per cent.
3. Further, the underlying (‘What-if’) unemployment rate is closer to 6.1 per cent rather than the official rate of 3.4 per cent.
4. There are still 1313.7 thousand Australian workers without work in one way or another (officially unemployed or underemployed). The only reason the unemployment rate is so low is because the underlying population growth remains low after the border closures over the last two years.
That is enough for today!
(c) Copyright 2022 William Mitchell. All Rights Reserved.
Bill, I am no economist – just an interested layman, but todays post raised the following question in my mind; the reduction in population growth and participation rate are results of the ongoing effects of the pandemic, as are, to some extent, the general economic conditions. In which case, if population growth/participation rate had not reduced, it would imply other economic conditions were also different. Doesn’t this make it questionable to assume the same ratio between population and unemployment would exist ?
When China was admitted in the “country-club” of the rich, known as WTO, the western world assumed that China would turn into a capitalist state, ultimatelly becoming another member of the US dollar system (the greatest ponzi scheme of all times) – and genuflect to the US interest (as Yeltsin did, in the good old days of post-soviet Russia).
The belief of the west on the “good will” of China was so strong, that the west sitted and watched the killing of almost all of its industries, unable to cope with the prices of “Made in China” goods.
We could argue why this belief was so strong, but I suspect it was just pure greed of the 1% top swath of the population.
Globalization brought another perk to the 1%: the destruction of labor negotiating power.
Without labor intensive industries, no worker would be able to negotiate wage anymore, working conditions or whatever.
And so we got unemployment and underemployment, because jobs available are increasingly in the gig economy, a by-product of a App-addicted society,
If a gig business fails, no problem: no employees to compensate; you can start another gig tomorrow.
But China made a turn in its way towards the “free-world”. China doesn’t want the dollar system.
China wants the remnibi system, its own ponzi, instead of the gigantic pyramid of the dollar, and its trilions of debt.
You could say, now its time for the west to re-industrialize.
Instead of trying to bring China and Russia to their knees, with a military strength – that Russia and China are defying – that could be a way to counter balance trade with the mighty China.
Except that it would depend on the same greedy 1% and they will just keep importing cheap stuff from China.
We need a meaningful economy, one that doesn’t depends on greed to evolve.