Today (June 3, 2026), the Australian Bureau of Statistics (ABS) released the latest - Australian…
Australia – business capital expenditure declines in March-quarter but outlook remains positive
The Australian Bureau of Statistics released the latest version of – Private New Capital Expenditure and Expected Expenditure, Australia – today (May 26, 2022), which is part of several releases leading up to the publication of the March-quarter National Accounts next Wednesday. Today’s business investment data shouws that private new capital expenditure in Australia fell by 0.3 per cent in the March quarter but was up by 4.5 per cent on the year. With the uncertainty continuing about the extent and duration of the current supply-side disruptions, the decline in business investment was, in fact, modest. And the expected investment plans signal that there is still no sense of crisis among those responsible for capital expenditure. One of the challenges facing the new Federal government is to maintain optimism in the economy in order to avoid the current-quarter decline in business investment becoming consolidated. If the new Treasurer keeps harping on about the $A1 trillion debt and the need to cut the fiscal deficit, they will fail that challenge and business will get spooked and we will head towards recession with on-going inflationary pressures.
The ABS data shows that for the March-quarter 2022 (real and seasonally-adjusted):
- Total new capital expenditure fell by 0.3 per cent over the quarter but increased by 4.5 per cent over the year.
- Buildings and structures investment fell by 1.7 per cent over the quarter but grew by 7.1 per cent over the year.
- Equipment, plant and machinery rose by 1.2 per cent over the quarter and by 1.8 per cen over the year.
- Mining investment fell 0.3 per cent for the quarter but was 2.48 per cent higher on the year.
- Manufacturing investment fell by 1.5 per cent for the quarter and 6.9 per cent on the year.
- Non-Mining investment fell by 0.3 per cent for the quarter and 9.7 per cent on the year.
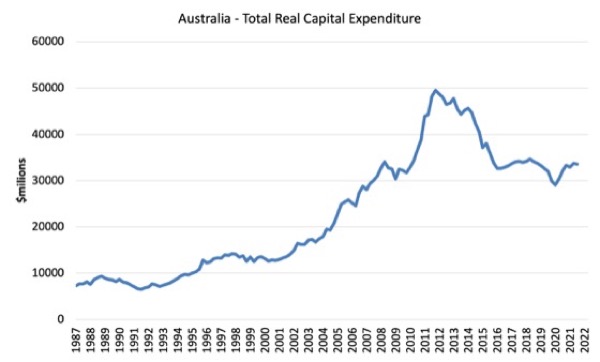
The first graph shows the scale of Australia’s problem with respect to investment in productive capacity. It shows total real capital formation from the September-quarter 1987 (start of sample) to the March-quarter 2022.
The huge hump relates to the once-in-a-century mining boom (see below).
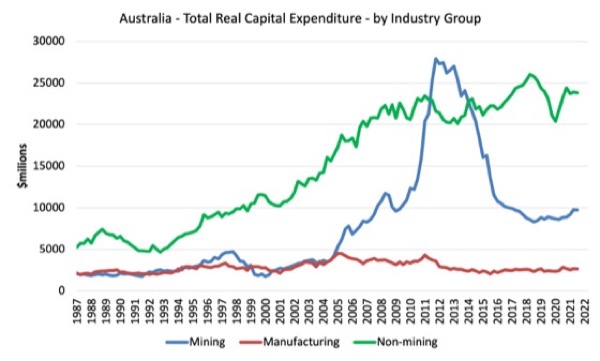
The next graph shows real private capital expenditure by broad sector.
The boom and bust in the Mining sector is quite extraordinary in historical terms.
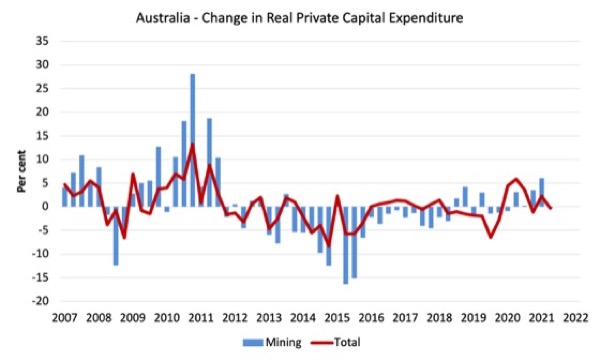
The next graph shows the quarterly percentage change in Total and Mining private capital expenditure in real terms from the December-quarter 2007 to the March-quarter 2022.
The damage to capital formation from the GFC is clear.
It was also the case that there was some sporadic recovery in investment expenditure leading into the pandemic but the fortunes turned in 2020 as the pandemic impacts dampened sentiment.
Expected business investment
The ABS – Explanatory Notes – help us understand their expected investment expenditure series.
We read that:
Surveys are conducted in respect of each quarter and returns are completed in the 8 or 9 week period after the end of the quarter to which the survey data relate (e.g. March quarter survey returns are completed during April and May).
– Businesses are requested to provide 3 basic figures each survey:
– Actual expenditure incurred during the reference period (Act)
– A short term expectation (E1) and a longer term expectation (E2).
In relation to this pattern, the ABS say that for 2022-23:
- the first estimate was available from the December 2021 survey as a longer term expectation (E2)
- the second estimate was available from the March 2022 survey (again as a longer term expectation)
- the third estimate was available from the June 2022 survey as the sum of two expectations (E1 + E2)
- in the September 2022, December 2022 and March 2022 surveys the fourth, fifth and sixth estimates, respectively, are derived from the sum of actual expenditure (for that part of the year completed) and expected expenditure (for the remainder of the year) as recorded in the current quarter’s survey
- the final (or seventh) estimate from the June quarter 2023 survey is derived from the sum of the actual expenditure for each of the four quarters in the 2022-23 financial year.
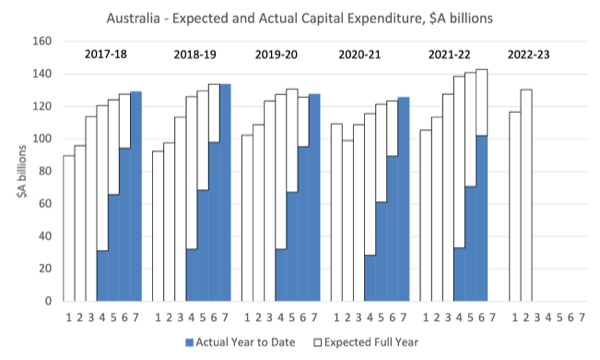
As a result we get the following graph of Total Capital Expenditure in the year to date (solid columns) and Expected full year capex (clear columns), which allows you to trace the shifting expectations of expenditure (the plans) and what actually transpires.
It is clear that expected (planned) private investment expenditure for 2022-23 is higher than it was in the current year, which has one-quarter to go.
The ABS note that:
Estimate 6 for 2021-22 is $142.8b
This is 1.4% higher than Estimate 5 for 2021-22
Estimate 2 for 2022-23 is $130.5b
This is 11.8% higher than Estimate 1 for 2022-23
In other words, investment plans by corporations are pointing to an expansion in spending over the next 12 months, which is suggests that businesses are not thinking that the inflationary period will turn into an extended period of stagflation and that there will sufficient demand in a year’s time to absorb the extra capacity.
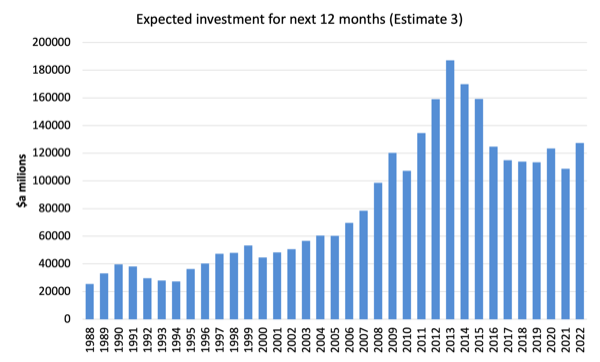
The next graph shows the expected investment for the next 12 months (Estimate 3), which is the most recent we have for 2021-22.
After contracting by 11.9 per cent in 2021, it has risen by 17.3 per cent in the most recent up to the current period.
Why does this matter?
A basic insight to come out of the economic growth literature (Harrod-Domar approach) is that any notion of a steady-state (where the economy is at rest) will be transitory because of the dual characteristic of investment spending.
1. Investment adds to aggregate spending in the current period (demand-side effect) and stimulates income growth.
2. It also adds to the productive capacity of the economy (supply-side effect) and increases potential income and output in the future.
To fully utilise the growing productive capacity the economy must also experience appropriate aggregate demand growth to absorb the increased output levels made possible by the increased productive capacity.
This means that the income level that might be consistent with full employment of capital and labour in the current period will be deficient over time as the productive capacity grows via investment expenditure.
Thus, aggregate demand has to grow in the next period to ensure the extra capital is fully utilised. The expenditure side of the economy can be seen as always chasing the growth in capacity that it creates.
The dual nature of investment raises the possibility of crises occurring where capital and labour resources lie idle as a result of aggregate demand failing to keep pace of the growth in productive capacity.
The problem is different when investment spending falters.
Then the growth of productive capacity slows and the inflation ceiling falls.
What does that mean?
It means that potential GDP (the capacity of the economy to produce output) falls at the same time as actual output is falling due to a lack of current expenditure driving firm cutbacks but also cutting their forward-looking investment expenditure plans.
Which means that the economy can support only lower rates of overall GDP growth (and employment creation) without coming up against capacity constraints.
That becomes a major issue for nations after prolonged recessions.
Another aspect of investment behaviour that we observe in the real world is asymmetry. Investment in new capital stock usually requires firms to make large irreversible capital outlays.
Capital is not a piece of putty that can be remoulded in whatever configuration that might be appropriate (that is, different types of machines and equipment). Once the firm has made a large-scale investment in a new technology they will be stuck with it for some period.
In an environment of endemic uncertainty, firms become cautious in times of pessimism and employ broad safety margins when deciding how much investment they will spend.
Accordingly, they form expectations of future profitability by considering the current capacity utilisation rate against their normal usage.
They will only invest when capacity utilisation, exceeds its normal level. So investment varies with capacity utilisation within bounds and therefore productive capacity grows at rate which is bounded from below and above.
The asymmetric investment behaviour thus generates asymmetries in capacity growth because productive capacity only grows when there is a shortage of capacity.
This insight has major implications for the way in which economies recover and the necessity for strong fiscal support when a deep recession is encountered.
Two conclusions arise from these observations.
1. Currency-issuing governments should do everything they can within their capacity to avoid recessions because they not only have damaging short-term impacts, but, also lead to investment shortfalls, which cause problems into the future as a result of capacity shortages.
2. Knowing investment is asymmetric means that policy should endeavour to instil confidence in the sales environment for several period out to encourage firms to invest in new capacity based on the confidence that the output that capacity can support will sell.
Assessment
With those points in mind, it is clear that one of the challenges facing the new Federal government is to maintain optimism in the economy in order to avoid the current-quarter decline in business investment becoming consolidated.
If the new Treasurer keeps harping on about the $A1 trillion debt and the need to cut the fiscal deficit, they will fail that challenge and business will get spooked and we will head towards recession with on-going inflationary pressures.
Business Conditions and Sentiment data release – mixed evidence on inflation
The ABS also released their – Business Conditions and Sentiments, May 2022 – data, which is interesting because it tells us something about the way in which Australian businesses are viewing the current inflationary episode.
The data shows that:
1. 38 per cent of businesses “expect to increase their prices by more than usual” – not much change on the March outcome, which suggests there is no acceleration in inflationary expectation.
2. 48 per cent “have no plans to increase their price of goods and services over the next three months” – which is an important indication that cost pressures are not generalised (mostly because wages growth remains low).
3. Of those in the 38 per cent, the main reason was rising input costs (92 per cent) and rising energy/fuel costs (78 per cent). The two factors are not independent because input costs are being passed on by other companies who are enduring rising fuel costs.
What we will observe at some point, is that when OPEC increase supply and prices drop because it becomes counterproductive for them to try to squeeze profits on margin once volumes start to fall of with decreased demand as economies slow, that these pressures will evaporate.
4. Of the 48 per cent, 46 per cent cited the need to “retain customers” as the reason while 46 per cent cited “fixed price contracts”.
We have known for years that firms will defend market share (retention of existing customer base) rather than go for short-run margin push and find that they lose custom to other firms in the same segment.
Further, catalogue pricing is an important aspect of any market and firms know that if they become capricious with respect to previously advertised prices they stand to lose more in volume than they gain on margin.
39 per cent of the 48 per cent group reported this as a reason.
In other words, prices are sticky over some defined period.
It remains to be seen whether the reasons that are promoting the ‘stickiness’ transcend the transitory pressures pushing up energy and other costs at present.
Given the pressures are coming mostly from the supply disruptions associated with the pandemic, I doubt it.
5. In terms of sectors, “expected price increases” eased on retail trade, financial and insurance, transport, postal and warehousing, and the utilities.
This appears to be a global softening and is consistent with the evidence I presented yesterday that cost pressures in Europe have fallen for the second consecutive month.
Conclusion
Next Wednesday, the Australian National Accounts come out and we will see by how much this negative investment performance drags down growth.
How the RBA behaves as we progress through all this remains to be seen.
The RBA have begun taking policy action based on their opinion that wages are beginning to build up a head of steam, or at least are about to take off. The ABS wage price index clearly demonstrated that at least in the first quarter, this was in fact not happening at all. Rather the opposite. What gives?
It was interesting to note that there appear to be very significant differences between the methods utilized by the RBA and the ABS in determining wage movements. The differences seem both quantitative and qualitative. This information could be somewhat out of date but it was what I was able to find.
The RBA appears to rely fairly heavily on it’s Business Liaison Programme to inform it. Exactly what these liaisons entail doesn’t seem perfectly clear to me. However, they do state that they liaise with less than 100 businesses per month, mostly medium-size and large. https://www.rba.gov.au/publications/bulletin/2014/sep/1.html
The ABS Wage Price Index survey by contrast is very much bigger – they collect wage data from around 3000 businesses per quarter and from that they select 18 000 individual jobs to examine the wage characteristics of. So a VASTLY larger sample size. https://www.abs.gov.au/statistics/detailed-methodology-information/concepts-sources-methods/wage-price-index-concepts-sources-and-methods/2012/chapter-6-sampling
There may also be significant differences between an RBA liaison and an ABS survey. The ABS Wage Price Index survey appears to be a straightforward, strictly fact-finding exercise – nothing more, nothing less. Exactly what transpires during one of the RBA’s “liaisons” though seems less clear to me – it almost sounds like a chat over coffee and cake between like-minded individuals. Unlike a strict fact-finding survey, such discussions may allow for the airing of opinions and biases.
On the face of it, the ABS approach would appear to provide superior information. However, the job of the ABS is merely to gather and provide such information – they do not act upon it. The RBA by contrast is using their own information to make policy decisions that affect the nation as a whole.
The only advantage I can see that the RBA approach might have over the ABS is that it is more timely and may quickly pick up turning points while a more comprehensive but quarterly survey may miss turning points until later.
I tend to suspect that what we are likely to see going forward is decent wage rises beginning to occur in the upper part of the labour market and where special skills are in demand – this is pretty much the usual situation.
But for the majority – and especially those in the lower half – I tend to suspect the story will be different. Union membership has been decimated over the past several decades, falling from over half the workforce to less than 15%. Unions ability to take action has also been crimped by anti-union legislation. Your average worker simply does not posses the bargaining power necessary to win solid pay rises as an individual. Perhaps if unemployment fell closer to 3% without a rise in underemployment or a decline in participation – otherwise, employers tend to hold most of the cards and pretty much have a monopsony.
The next ABS Wage Price Index is due out in August – between now and that time, the RBA are due to make 3 more monetary policy decisions. I hope they have been busily re-evaluating their methods for determining what is happening with wages, otherwise they’re going to cause a lot of widespread pain and hardship for no reason.
“The ABS also released their – Business Conditions and Sentiments, May 2022 – data, which is interesting because it tells us something about the way in which Australian businesses are viewing the current inflationary episode.”
“48 per cent “have no plans to increase their price of goods and services over the next three months” – which is an important indication that cost pressures are not generalised (mostly because wages growth remains low).”
This is a much more timely survey than the WPI – at least as timely as the RBA’s Business Liaison Programme. Did I read it correctly? Less than a fifth of businesses are reporting that wage rises are incentivising them to raise prices in the coming quarter?
The RBA’s interpretation of the situation appears completely wrong.
@Leftwinghillbillyprospector,
‘The RBA’s interpretation of the situation appears completely wrong’.
The way you have triangulated all the different set of data seems to support your conclusion, which is the strength of your argument.
Coupled with the validity issue of the different methodologies and hence instruments people used to collect the data you have pointed out, it further suggested that the RBA may have got it wrong completely.
I hope that the RBA will reassess their data driven decision-making model, which is weak and shallow, before Australians suffer more as a consequence.
@vorapot
Thanks vorapot.
After the past several years where they appeared to come much more to terms with reality, it appears that this month the RBA returned to their old modus operandi of jumping at shadows.
I’m not a trained economist but my understanding of neoliberal thinking is that it contains a variety of core beliefs that do not reflect actual reality. The last few of the RBA’s statements on monetary policy indicate that the board have believed that wages are taking off broadly across the labour market – this appears to be almost certainly false. If they place any weighting at all upon the fact that workers bargaining power has been very significantly reduced by the loss of union membership and collective bargaining, and the legal constraints that have been placed on the activities of what remains of the union movement, then I haven’t seen it.
They appear to assume that simply because the labour market is tighter than it has been for years, that the worker and the capitalist are somehow on relatively equal footing when it comes to agreeing on how the pie will be divided up. I see no evidence that this is the case. Industrial Relations professor David Peetz penned an article recently in which he argues that the labour market will need to be very tight indeed for anything remotely like this to occur and that in reality, the loss of union power and collective bargaining has generally left employers with an effective monopsony – they are in a position to set the price they pay for labour (subject to the bounds of the law and any the passage of any relevant legislation).
I put it forward that this month the RBA made a policy decision based on flawed information and probably also a faulty understanding of the dynamics of labour and capital. I suspect that wages and salaries are probably beginning to move in the upper reaches of the labour market where employee bargaining power is inherently greater and that this has been wrongly interpreted as representing the bigger picture, rather than the relatively small minority it actually is.
Now I’m beginning to hear ominous rumblings from the newly elected government that spending “needs to be reduced”. Lets hope this is mostly just politicking (the usual “finding of all this wastage the government we just defeated has left”) – the electorate of the new treasurer contains a high proportion of some of the more disadvantaged people, the last thing they (and the rest of us) need is the new government crimping growth and driving up unemployment with a similar flawed understanding of the monetary dynamics of the economy they are now in charge of.