The Australian Bureau of Statistics (ABS) released the latest labour force data today (June 25,…
US labour market showing signs of faltering as real wages continue to decline
Last Friday (May 6, 2022), the US Bureau of Labor Statistics (BLS) released their latest labour market data – Employment Situation Summary – April 2022 – which reported a total payroll employment rise of only 428,000 jobs and an official unemployment rate of 3.6 per cent. However, the Labour Force survey provided the opposite impression with employment and the participation rate falling. It is difficult at this stage to reconcile the two messages except to say that the US labour market has probably reached an inflection point and a deterioration is emerging as the Federal Reserve continues to hike interest rates. The US labour market is still 1,190 thousand payroll jobs short from where it was at the end of April 2020, which helps to explain why there are no wage pressures emerging. Real wages continued to decline as the supply disruptions and the greed of increased corporate profit margin push sustain the inflationary pressures. Any analyst who is claiming the US economy is close to full employment hasn’t looked at the data.
Overview for April 2022:
- Payroll employment increased by 428,000.
- Total labour force survey employment fell by 353 thousand net (-0.22 per cent).
- The seasonally adjusted labour force fell by 363 thousand net (-0.22 per cent).
- The employment-population ratio fell 0.1 points to 60 per cent (it is still lower than the April 2020 peak of 61.2).
- Official unemployment fell by 11 thousand to 5,941 thousand.
- The official unemployment rate was unchanged at 3.6 per cent.
- The participation rate fell 0.2 points to 62.2 per cent.
- The broad labour underutilisation measure (U6) rose 0.1 points to 7 per cent as underemployment increased.
For those who are confused about the difference between the payroll (establishment) data and the household survey data you should read this blog post – US labour market is in a deplorable state – where I explain the differences in detail.
Some months the difference is small, while other months, the difference is larger.
The differences were quite large this month.
Payroll employment trends
The BLS noted that:
Total nonfarm payroll employment rose by 428,000 in April … nonfarm employment is down by 1.2 million, or 0.8 percent, from its pre-pandemic level in February 2020.
Employment in leisure and hospitality increased by 78,000 in April … is down by 1.4 million, or 8.5 percent, since February 2020.
Manufacturing added 55,000 jobs in April … is down by 56,000, or 0.4 percent.
Employment in transportation and warehousing rose by 52,000 in April … is 674,000 above its February 2020 level, led by strong growth in warehousing and storage (+467,000) and in couriers and messengers (+259,000).
In April, employment in professional and business services continued to trend up (+41,000). Since February 2020, employment in the industry is up by 738,000.
Financial activities added 35,000 jobs in April … is 71,000 higher than in February 2020.
Health care employment rose by 34,000 in April, reflecting a gain in ambulatory health
care services (+28,000). Employment in health care is down by 250,000, or 1.5 percent,
since February 2020.Employment in retail trade increased by 29,000 in April … is 284,000 above its level in February 2020.
In April, wholesale trade employment rose by 22,000 … is down by 57,000, or 1.0 percent, since February 2020.
Mining added 9,000 jobs in April, with a gain in oil and gas extraction (+5,000) … is 73,000 higher than a recent low in February 2021.
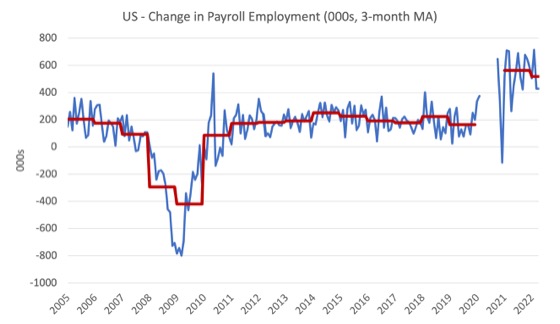
The first graph shows the monthly change in payroll employment (in thousands, expressed as a 3-month moving average to take out the monthly noise). The red lines are the annual averages. I left out the observations between January 2020 and September 2020, which were so extreme that they make it harder to compare the current period with the pre-pandemic history.
The US labour market is still 1,190 thousand jobs short from where it was at the end of April 2020 and the commentary from the BLS above tells us how this shortfall is distributed across the sectors.
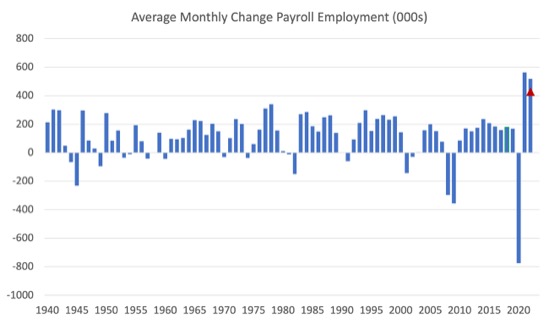
The next graph shows the same data in a different way – in this case the graph shows the average net monthly change in payroll employment (actual) for the calendar years from 2005 to 2021.
The red marker on the column is the current month’s result.
The final average for 2019 was 164 thousand.
The final average for 2020 was -774 thousand.
The final average for 2021 was 562 thousand.
The average so far in 2022 is 519 thousand.
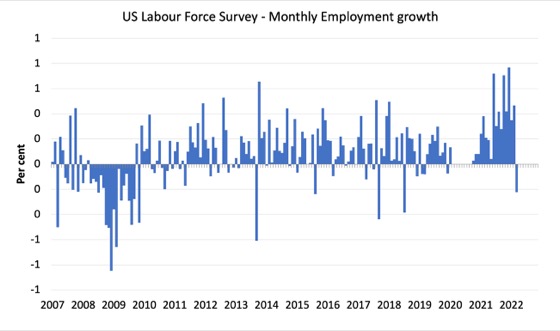
Labour Force Survey – employment growth declines
The data for April 2022 reveals:
1. Total labour force survey employment fell by 353 thousand net (-0.22 per cent).
2. The seasonally adjusted labour force fell by 363 thousand net (-0.22 per cent).
3. The participation rate fell 0.2 points to 62.2 per cent ensuring total unemployment hardly shifted despite the lost employment.
4. As a result (in accounting terms), total measured unemployment fell by 11 thousand to 5,941 thousand and the official unemployment rate was unchanged at 3.6 per cent.
The following graph shows the monthly employment growth since January 2008 and excludes the extreme observations (outliers) between April 2020 and October 2020, which distort the current period relative to the pre-pandemic period.
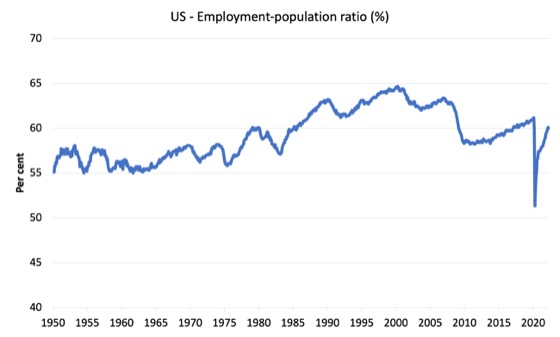
The Employment-Population ratio is a good measure of the strength of the labour market because the movements are relatively unambiguous because the denominator population is not particularly sensitive to the cycle (unlike the labour force).
The following graph shows the US Employment-Population from January 1950 to April 2022.
While the ratio fluctuates a little, the April 2020 ratio fell by 8.6 points to 51.3 per cent, which is the largest monthly fall since the sample began in January 1948.
In April 2022, the ratio fell by 0.1 points to 60 per cent.
It is thus moved further away from the peak level in April 2020 (61.1 per cent).
Unemployment and underutilisation trends
The BLS note that:
The unemployment rate remained at 3.6 percent in April, and the number of unemployed persons was essentially unchanged at 5.9 million. These measures are little different from their values in February 2020 (3.5 percent and 5.7 million, respectively), prior to the coronavirus (COVID-19) pandemic …
… the number of long-term unemployed (those jobless for 27 weeks or more) was little changed at 1.5 million. This measure is 362,000 higher than in February 2020. The long-term unemployed accounted for 25.2 percent of all unemployed persons in April …
The number of persons employed part time for economic reasons was little changed at 4.0 million in April and is down by 357,000 from its February 2020 level. These individuals, who would have preferred full-time employment, were working part time because their hours had been reduced or they were unable to find full-time jobs …
In April, the decline in employment was offset (and a little more) by the decline in the labour force as participation fell.
That is why unemployment fell as workers left the labour force rather than we absorbed into jobs.
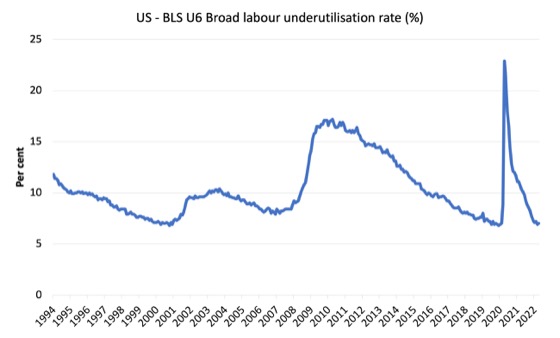
The first graph shows the official unemployment rate since January 1994.

The official unemployment rate is a narrow measure of labour wastage, which means that a strict comparison with the 1960s, for example, in terms of how tight the labour market, has to take into account broader measures of labour underutilisation.
The next graph shows the BLS measure U6, which is defined as:
Total unemployed, plus all marginally attached workers plus total employed part time for economic reasons, as a percent of all civilian labor force plus all marginally attached workers.
It is thus the broadest quantitative measure of labour underutilisation that the BLS publish.
Pre-COVID, U6 was at 6.8 per cent (December 2019).
In April 2022 the U6 measure was 7 per cent, a rise of 0.1 points on the previous month.
Aggregate participation rate – fell by 0.2 points to 62.2 per cent
What is the impact of that increase for the actual unemployment situation?
We can make two comparisons:
1. Compare the April 2022 with the March 2020 state.
2. Compare the changes in the last month.
The labour force is a subset of the working-age population (those above 15 years old). The proportion of the working-age population that constitutes the labour force is called the labour force participation rate. Thus changes in the labour force can impact on the official unemployment rate, and, as a result, movements in the latter need to be interpreted carefully. A rising unemployment rate may not indicate a recessing economy.
The labour force can expand as a result of general population growth and/or increases in the labour force participation rates.
The following Table decomposes these effects and summarises the relevant aggregates:
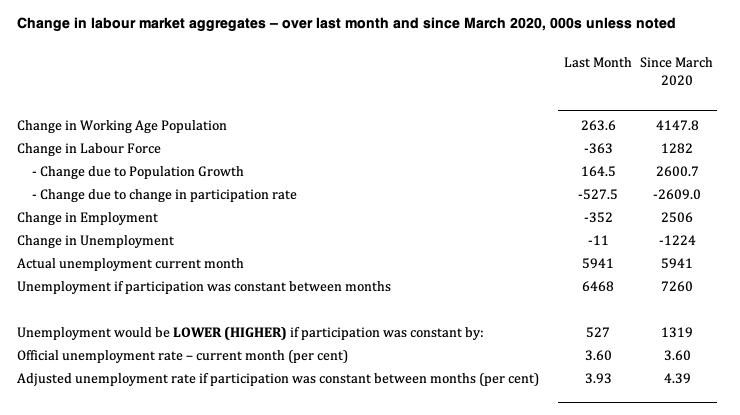
1. The labour force in April 2022 fell by 363 thousand as a result of the 0.2 points fall in the labour force participation since March.
3. If those workers had not left the labour force, then the unemployment rate would have been 3.93 per cent rather than the official estimate of 3.6 per cent.
4. Since March 2020, the labour force has risen by 1,282 thousand.
5. If we assume the workers who left the Labour Force in April are hidden unemployed – they want to work, are willing to work, but did not actively seek work – and add them back into the official unemployment, the adjusted unemployment rate in April 2022 would be 4.4 per cent rather than the official estimate of 3.6 per cent.
The point is that as the participation rate rises with more employment opportunities becoming available, the unemployment rate will remain somewhat resistant to declines.
It will take a sustained period of employment growth to push the participation rate back to pre-COVID levels and then a more accurate picture of the unemployment situation will be revealed.
Ethnicity and Education
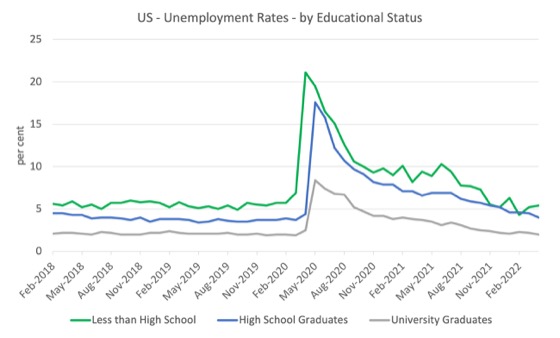
The next graph shows the evolution of unemployment rates for three cohorts based on educational attainment: (a) those with less than high school completion; (b) high school graduates; and (c) university graduates.
The unemployment rate for a person with a university degree is 2 per cent, while the other groups are much higher.
In the collapse in employment in the early months of the pandemic, the unemployment rates rose by:
- 14.2 points for those with less than high-school diploma.
- 13.2 points for high school, no college graduates.
- 5.9 points for those with university degrees.
The period since April 2020 has seen the unemployment rate fall by:
- 15.7 points for those with less than high-school diploma meaning the unemployment rate is now 1.7 points below the April 2020 level.
- 13.2 points for high school, no college graduates meaning the unemployment rate is now 0.4 points above the April 2020 level.
- 5.9 points for those with university degrees meaning the unemployment rate is now 0.5 points below the April 2020 level.
In the last month, the change in the unemployment rate has been:
- a rise of 0.2 points for those with less than high-school diploma.
- a fall of 0.2 points for high school, no college graduates.
- unchanged for those with university degrees.
In the US context, the trends in trends in unemployment by ethnicity are interesting.
Two questions arise:
1. How have the Black and African American and White unemployment rate fared in the post-GFC period?
2. How has the relationship between the Black and African American unemployment rate and the White unemployment rate changed since the GFC?
Summary:
1. All the series move together as economic activity cycles. The data also moves around a lot on a monthly basis.
2. The Black and African American unemployment rate was 6.8 per cent in April 2020, rose to 16.6 per cent in May 2020 and is at 5.9 per cent in April 2022. In the last month, it was fell by 0.3 points, the 4th consecutive month of decline.
3. The Hispanic or Latino unemployment rate was 6 per cent in April 2020, rose to 18.9 per cent in April and is at 4.1 per cent in April 2022. In the last month, it fell by 0.1 points.
4. The White unemployment rate was 3.9 per cent in April 2020, rose to 14.1 per cent in April and fell to 3.2 per cent in April 2022 – unchanged over the month.
The next graph shows the Black and African American unemployment rate to White unemployment rate (ratio) from January 2018, when the White unemployment rate was at 3.5 per cent and the Black or African American rate was at 7.5 per cent.
This graph allows us to see whether the relative position of the two cohorts has changed since the crisis.
If it is rising, then the unemployment rate of the Black and African American cohort is either rising faster than the white unemployment rate or falling more slowly (or a combination of that relativity).
While there is month-to-month variability, the data shows that, in fact, through to mid-2019, the position of Black and African Americans had improved in relative terms (to Whites), although that just reflected the fact that the White unemployment was so low that employers were forced to take on other ‘less preferred’ workers if they wanted to maintain growth.
In April 2019, the ratio was 2.1 (meaning the Black and African American unemployment rate was more than 2 times the White rate).
By April 2020, the ratio had fallen to its lowest level of 1.2, reflecting the improved relative Black and African American position.
As the pandemic hit, the ratio rose and peaked at 1.8 in October 2020.
In April 2022, the ratio was 1.84, a decline of 0.1 points, which indicates that the relative position of the Black and African American cohort has improved a little further.

Special analysis this month – What are wages doing in the US?
With inflation rising sharply at present and the Federal Reserve pretending there is a major wage problem that needs to be disciplined with rising mass unemployment, one would expect to see strong nominal wages growth pushing the price level along.
The BLS reported that:
Average hourly earnings for all employees on private nonfarm payrolls rose by 10 cents, or 0.3 percent, to $31.85 in April. Over the past 12 months, average hourly earnings have increased by 5.5 percent. In April, average hourly earnings of private sector production and nonsupervisory employees rose by 10 cents, or 0.4 percent, to $27.12.
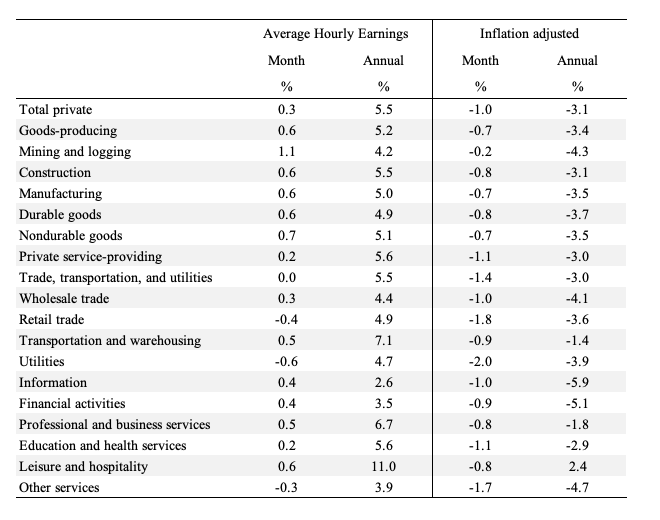
The following table shows the movements in nominal Average Hourly Earnings (AHE) by sector and the inflation-adjusted AHE by sector for April 2022 (latest data).
Over the last month, real wages fell in all sectors.
If wages were pushing the inflation rate we would not be seeing persistent real wages cuts.
The following graph shows the annual hourly earnings growth for all private employees since April 2007.
In the last month, the growth rate declined and is well below the inflation rate. Wages growth is not driving the supply-side inflation acceleration.
There is no accelerating trend.
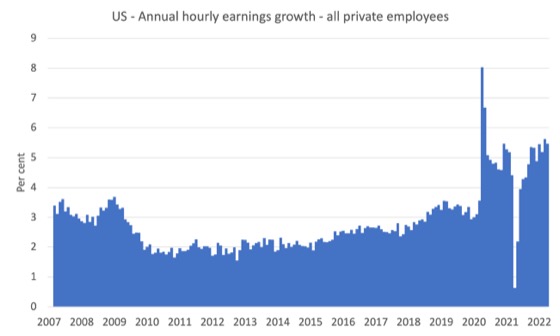
Note that the above graph is in nominal terms.
The latest – BLS Real Earnings Summary (published April 12, 2022) – tells us that:
Real average hourly earnings for all employees decreased 0.8 percent from February to March, seasonally adjusted … This result stems from an
increase of 0.4 percent in average hourly earnings combined with an increase of 1.2 percent in the Consumer Price Index for All Urban Consumers (CPI-U).Real average weekly earnings decreased 1.1 percent over the month due to the change in real average hourly earnings combined with a decrease of 0.3 percent in the average workweek.
Real average hourly earnings decreased 2.7 percent, seasonally adjusted, from March 2021 to March 2022. The change in real average hourly earnings combined with a decrease of 0.9 percent in the average workweek resulted in a 3.6-percent decrease in real average weekly earnings over this period.
Workers are not catching up with the price level rises and can hardly be said to be pressuring inflation.
The following graph shows movements in real average hourly earnings (indexed at 100 the pre-GFC peak – November 2006) up to January 2022 tells the story.
The spike in the early period of the pandemic was the result of hours adjustments rather than earnings growth.

And, from the latest – Productivity and Costs, First Quarter 2022, Preliminary (published May 5, 2022) – report, we find that:
Nonfarm business sector labor productivity decreased 7.5 percent in the first quarter of 2022 … as output decreased 2.4 percent and hours worked increased 5.5 percent. This is the largest decline in quarterly productivity since the third quarter of 1947, when the measure decreased 11.7 percent … From the same quarter a year ago, nonfarm business sector labor productivity decreased 0.6 percent, reflecting a 4.2-percent increase in output that was outpaced by a 4.8-percent increase in hours worked. This is the largest four-quarter decline since the fourth quarter of 1993, when the measure also declined 0.6 percent.
Even though productivity growth slumped in the first quarter of 2022, real hourly earnings growth continues to lag behind productivity growth over a longer period.
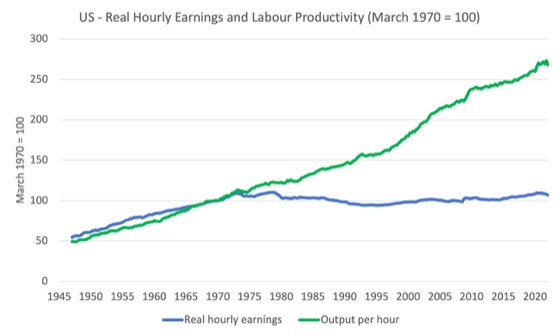
The following graph tells the story.
It shows real hourly earnings and labour productivity (output per hour) indexed at 100 in the April-quarter 1970 (around the time the two series started to diverge).
Workers have enjoyed hardly any real wages growth since 1970 (rising by just 7.1 per cent) whereas productivity growth has risen by 168 per cent.
There has been a massive redistribution of national income away from workers towards profits over this long period.
This depicts the failure of Capitalism to serve the best interests of the people.
Conclusion
The US labour market probably reached an inflection point in April 2022 as we received mixed messages from the payroll and survey data.
The US labour market is still 1,190 thousand jobs short from where it was at the end of April 2020.
The employment-population ratio is still down on the April 2020 peak.
There are no fundamental wage pressures emerging at present despite the spikes in inflation arising from supply chain constraints.
Real wages are falling.
The US labour market is still some way from being at full employment.
That is enough for today!
(c) Copyright 2022 William Mitchell. All Rights Reserved.
Bill or anyone,
Covid has killed 1 million Americans. How many of them had a job or could have been working?
This seems like an important question. To use an extreme example, if all 1 M had been in the labor market, then being 1.2 M jobs short doesn’t mean many Americans are sitting back not working.
There is also the unknown number of American “workers” who are not working because of long covid.
I don’t know what the details are. So, I’m asking.
Bill, shouldn’t your points 3 and 4, refer also to May 2020, as with point 2: ‘rose to 16.6 per cent in May 2020’?
@Steve_American we can rule out your extreme example because, from my reading, over 700,000 of those 1m covid deaths were in the over 65 age group, many with underlying health issues, so probably not in the Labour Market. Long covid, as you recognise, seems the bigger impact for the labour market.
Being Black in America, I have noticed within my family more and more of the younger generation who lost jobs going self employed. I myself am leaving investment banking this week after a 25 year career that went no where but horizontal and am becoming a pastor which is considered self employed in the US. A lot of Americans who have dropped out are working casually for themselves now and not working for a company as an employee. Many Black Americans have had enough and are pursuing a different path rather than following parents who had stagnated careers in corporate America.