I have been 'at it' for decades now but it never ceases to amaze me…
Australia – annual inflation rate falls to 3 per cent with the quarterly rate stable and the press go crazy
Apparently, inflation in Australia has come ‘roaring’ back, if you believe one financial commentator today. There has been a lot of talk about how inflation is spiralling upwards and it demonstrates the MMT ‘quackery’. If you examine today’s data release from the Australian Bureau of Statistics – Consumer Price Index, Australia (October 27, 2021) – which relates to to the September-quarter 2021, then it becomes clear that the slightly elevated CPI result is largely due to uncompetitive cartel behaviour and deliberate government petrol pricing policies that ensure that the cartel behaviour is ratified in the form of higher local petrol prices. Not much more to see than that really. Nothing much to do with Modern Monetary Theory (MMT) at all. Sorry about that. The CPI rose by 0.8 per cent in the September-quarter 2021 and 3 per cent over the 12 months. The two main drivers were the rise in prices for New dwelling purchases by owner-occupiers (3.3 per cent) and Automotive fuel (7.7 per cent). Last quarter, the annual rate of CPI increase was 3.8 per cent, which makes statements like ‘roaring back’ seem ridiculous and designed to attract headlines.
The summary Consumer Price Index results for the September-quarter 2021 are as follows:
- The All Groups CPI rose by 0.8 per cent.
- The All Groups CPI rose by 3 per cent over the 12 months down from 3.8 per cent last quarter.
- The major determinant was the 7.7 per cent rise in automotive fuel.
- The Trimmed mean series rose by 0.7 per cent (up from 0.5 per cent) and by 2.1 per cent over the previous year (up from 1.6 per cent).
- The Weighted median series rose by 0.7 per cent and by 2.1 per cent over the previous year (up from 1.6 per cent).
The ABS Media Release notes that:
Construction input costs such as timber increased due to supply disruptions and shortages. Combined with high levels of building activity, this saw price increases passed through to consumers …
Rising fuel prices also contributed to the September quarter CPI increase, with the CPI’s automotive fuel series reaching the highest level in its half-century history.
Annually the CPI rose 3.0 per cent … A key contributor to this increase was fuel prices, which have risen 36 per cent from the lows seen in mid-2020.
The other point to note is that inflation has not surged in Australia, despite the Reserve Bank of Australia purchasing $A224,210 million worth of federal government bonds in secondary markets and $A53,398 million worth of state/territory government debt since February 2020.
The central bank has been significantly funding government spending at both federal and state levels – around 93 per cent of all federal deficit spending since the onset of the pandemic.
The rise in petrol prices, which is the largest driver on the CPI rise this quarter has nothing to do with the RBA purchases nor the fiscal deficits being run by Treasury.
This accords with the historical record where central banks in Europe, the UK, Japan, the US have been engaged in large-scale bond purchases and inflation is benign, and, in Japan’s case, has been for 30 years.
Trends in inflation
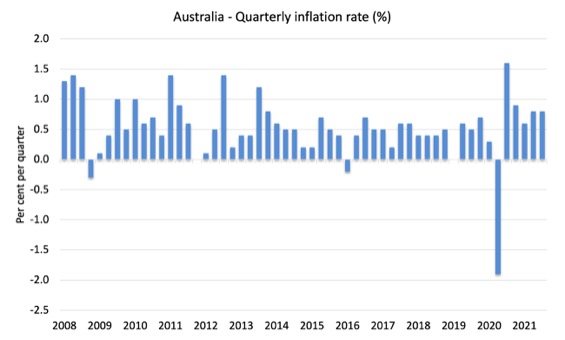
The headline inflation rate increased by 0.8 per cent in the September-quarter 2021 and 3 per cent over the 12 months, down from the annual rate of 3.8 per cent recorded last quarter. But the rise is transitory (mostly an adjustment in fuel prices as transport resumes).
There is no upward trend in the inflation rate evident.
How any economics journalist could describe this as inflation ‘roaring’ back is beside me. Hysteria.
The following graph shows the quarterly inflation rate since the September-quarter 2008.
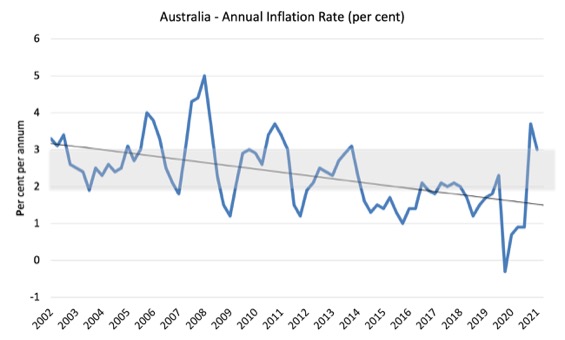
The next graph shows the annual headline inflation rate since the first-quarter 2002. The black line is a simple regression trend line depicting the general tendency. The shaded area is the RBA’s so-called targetting range (but read below for an interpretation).
The trend inflation rate is quite steeply downwards.
Once we take out the so-called ‘volatile’ items (such as, housing and fuel), the annual inflation rate is only 2.1 per cent, which is at the lower end of the RBA’s target range.
What is driving inflation in Australia?
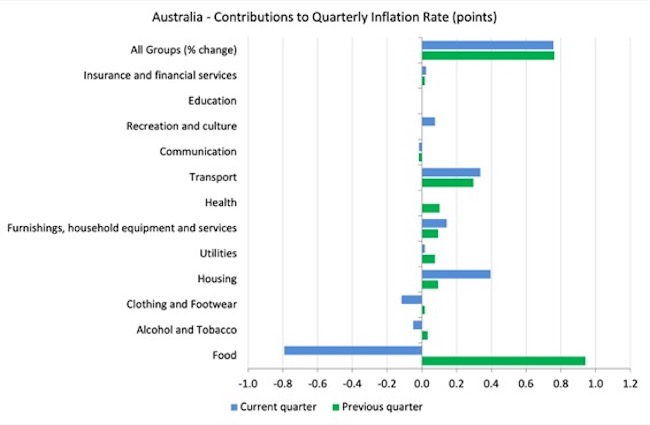
The following bar chart compares the contributions to the quarterly change in the CPI for the September-quarter 2021 (blue bars) compared to the June-quarter 2021 (green bars).
Note that Utilities is a sub-group of Housing.
Last quarter, food prices due to the extensive flooding in the food-growing areas earlier this year combined with a temporary shortage of farm workers due to international border closures and the fact that the farms are rebuilding cattle herds after a long drought, drove the rising inflation.
The scaremongers told everyone that the inflation genie was out of the bottle.
I said these were transitory impacts.
Time tells us that they were transitory impacts.
This quarter it is petrol and housing driving the inflation.
Neither have much to do with the state of the economy.
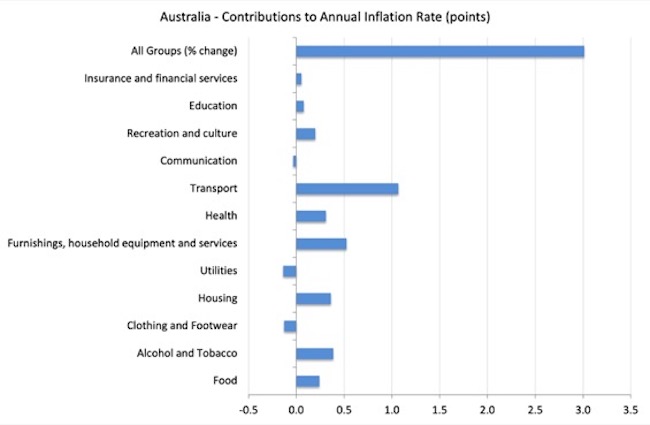
The next graph provides shows the contributions in points to the annual inflation rate by the various components.
Inflation and Expected Inflation
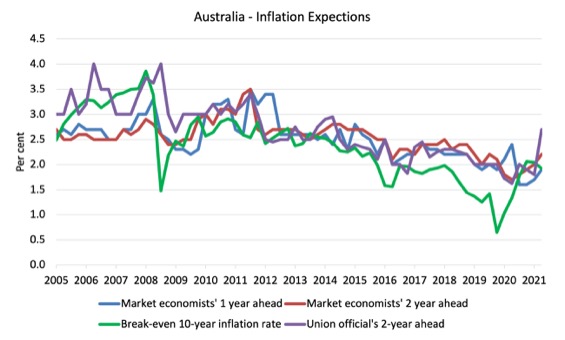
The following graph shows four measures of expected inflation expectations produced by the RBA – Inflation Expectations – G3 – from the September-quarter 2005 to the September-quarter 2021.
The four measures are:
1. Market economists’ inflation expectations – 1-year ahead.
2. Market economists’ inflation expectations – 2-year ahead – so what they think inflation will be in 2 years time.
3. Break-even 10-year inflation rate – The average annual inflation rate implied by the difference between 10-year nominal bond yield and 10-year inflation indexed bond yield. This is a measure of the market sentiment to inflation risk.
4. Union officials’ inflation expectations – 2-year ahead.
Notwithstanding the systematic errors in the forecasts, the price expectations (as measured by these series) are hardly going ‘through the roof’.
While the business inflation expectations for 3 months ahead is 2.1 per cent (down from 2.8 per cent last quarter), the one-year ahead is up marginally from 1.7 to 1.9 per cent (still below the RBA targetting range), and the two-year ahead expectation rose from 2 to 2.2 per cent – at the lower end of the RBA targetting range (2 per cent).
It is well known that the ‘market economists’ systematically get movements in the economy wrong and one wonders if their organisations actually bet money on their analysis!
The most reliable measure – the Break-even 10-year inflation rate – actually fell from 2 to 1.9 per cent (below the lower bound of the RBA targetting range).
This measure is a good indicator of long-term inflation expectations.
It has been at or below the lower bound of the RBA’s policy target range since the September-quarter 2018.
The other expectations are still lagging behind the actual inflation rate, which means that forecasters progressively catch up to their previous forecast errors rather than instantaneously adjust, a further piece of evidence that refutes the mainstream economics hypothesis that decision makers use ‘rational expectations’ (that is, on average get it right).
Implications for monetary policy
What does this all mean for monetary policy?
There is some modest rise in expected inflation.
Trade union officials obviously are trying to present an environment for pursuing wage increases.
The market economists have been punting on a rise in the interest rate for some time now but look as though they are accepting that the inflationary pressures are transitory.
The private banking economists that are continually wheeled out in the media to comment on prospective interest obviously talk up interest rate rises because their organisations benefit, which poses the question as to why they are used in this way and held out as independent authorities.
But, the inflation trends provide no basis for any expectation that the RBA will hike interest rates anytime soon.
I suspect the RBA will resist all the hype that is around at present in the financial markets, which they know as well as I is mostly self-serving.
There are modest increases in cost pressures due to the economy trying to deal with the pandemic, which is being exacerbated by anti-competitive behaviour in world oil markets.
None of that represents any major structural biases towards persistently higher inflation rates.
The RBA uses a range of measures to ascertain whether they believe there are persistent inflation threats.
Please read my blog post – Australian inflation trending down – lower oil prices and subdued economy – for a detailed discussion about the use of the headline rate of inflation and other analytical inflation measures.
The Consumer Price Index (CPI) is designed to reflect a broad basket of goods and services (the ‘regimen’) which are representative of the cost of living. You can learn more about the CPI regimen HERE.
The RBA’s formal inflation targeting rule aims to keep annual inflation rate (measured by the consumer price index) between 2 and 3 per cent over the medium term. Their so-called ‘forward-looking’ agenda is not clear – what time period etc – so it is difficult to be precise in relating the ABS data to the RBA thinking.
But there is evidence that the RBA is moving into line with other central banks and abandoning this ‘forward-looking’ approach (the managing expectations approach) in favour of a more realistic backward reaction function – where they prioritise supporting high levels of employment and stand ready to deal with inflation if it systematically and persistently exceeds the upper band of its targeting range.
In the – Minutes of the Monetary Policy Meeting of the Reserve Bank Board (meeting October 5, 2021) – we read that:
Most central banks in advanced economies had continued to characterise pandemic-related price increases as either temporary or one-off price level changes that would have only a transitory effect on inflation …
Wage and price pressures in Australia remain subdued. Members noted that while disruptions to global supply chains were affecting the prices of some goods, the effect of this on the overall rate of inflation in Australia was limited. Wages growth and underlying inflation were expected to pick up only gradually as the economy recovers …
The Board remained committed to maintaining highly supportive monetary conditions to achieve a return to full employment in Australia and inflation consistent with the target. It will not increase the cash rate until actual inflation is sustainably within the 2 to 3 per cent target range. The central scenario for the economy is that this condition will not be met before 2024. Meeting this condition will require the labour market to be tight enough to generate materially higher wages growth than at the time of the meeting.
So nothing to see!
The RBA also does not rely on the ‘headline’ inflation rate. Instead, they use two measures of underlying inflation which attempt to net out the most volatile price movements.
To understand the difference between the headline rate and other non-volatile measures of inflation, you might like to read the March 2010 RBA Bulletin which contains an interesting article – Measures of Underlying Inflation. That article explains the different inflation measures the RBA considers and the logic behind them.
The concept of underlying inflation is an attempt to separate the trend (“the persistent component of inflation) from the short-term fluctuations in prices. The main source of short-term ‘noise’ comes from “fluctuations in commodity markets and agricultural conditions, policy changes, or seasonal or infrequent price resetting”.
The RBA uses several different measures of underlying inflation which are generally categorised as ‘exclusion-based measures’ and ‘trimmed-mean measures’.
So, you can exclude “a particular set of volatile items – namely fruit, vegetables and automotive fuel” to get a better picture of the “persistent inflation pressures in the economy”. The main weaknesses with this method is that there can be “large temporary movements in components of the CPI that are not excluded” and volatile components can still be trending up (as in energy prices) or down.
The alternative trimmed-mean measures are popular among central bankers.
The authors say:
The trimmed-mean rate of inflation is defined as the average rate of inflation after “trimming” away a certain percentage of the distribution of price changes at both ends of that distribution. These measures are calculated by ordering the seasonally adjusted price changes for all CPI components in any period from lowest to highest, trimming away those that lie at the two outer edges of the distribution of price changes for that period, and then calculating an average inflation rate from the remaining set of price changes.
So you get some measure of central tendency not by exclusion but by giving lower weighting to volatile elements. Two trimmed measures are used by the RBA: (a) “the 15 per cent trimmed mean (which trims away the 15 per cent of items with both the smallest and largest price changes)”; and (b) “the weighted median (which is the price change at the 50th percentile by weight of the distribution of price changes)”.
Please read my blog post – Australian inflation trending down – lower oil prices and subdued economy – for a more detailed discussion.
So what has been happening with these different measures?
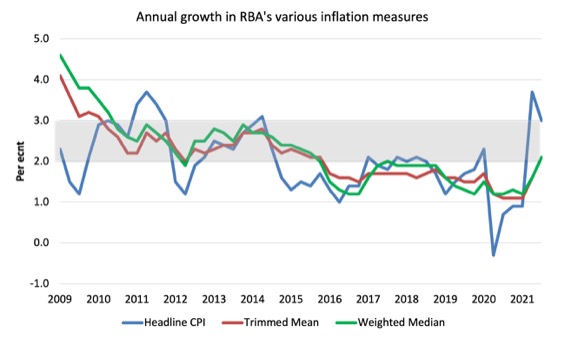
The following graph shows the three main inflation series published by the ABS since the September-quarter 2009 – the annual percentage change in the All items CPI (blue line); the annual changes in the weighted median (green line) and the trimmed mean (red line).
The RBAs inflation targetting band is 2 to 3 per cent (shaded area). The data is seasonally-adjusted.
The three measures are all currently below the RBA’s targetting range:
1. CPI measure of inflation rose by 3 per cent (down from 3.8 per cent last quarter).
2. The RBAs preferred measures – the Trimmed Mean was 2.1 per cent and the Weighted Median was 2.1 – around the lower bound of the RBAs targetting range and definition of price stability..
How to we assess these results?
First, the economy is starting to adjust to the hard supply constraints imposed by the pandemic.
Second, inflationary expectations are benign.
Conclusion
Even with the larger fiscal deficits, record low interest rates and a central bank engaging in QE, inflation does not appear to be accelerating in Australia.
The major sources of price increases are temporary – adjustments back to pre-pandemic levels and some anti-competitive cartel behaviour.
The housing demand is strong but that reflects, in part, the lack of other spending possibilities as a result of the extended lockdowns that are now over.
That is enough for today!
(c) Copyright 2021 William Mitchell. All Rights Reserved.
I don’t know much about Australian economic conditions. In the US there are a plethora of daily news stories about rising prices. Many of them make no sense at all. One big story recently has been about how our shipping ports are all clogged up with ships waiting days to unload all the imported goods that other countries seem willing to send us. It’s hard to make a case for continuing inflation out of that. Or at least I can’t see it. Over supply of imports doesn’t sound inflationary. And it isn’t like Americans have slipped so far that we don’t know how to unload ships anymore.
Then of course we are burdened with what passes as a center/left economist here- Larry Summers. Made a prediction we are doomed to suffer terrible inflictions from inflation because the government actually did something to help citizens out during the pandemic. And then lumber prices went up dramatically which was big news. And that they have fallen just as dramatically is apparently not big news. And the price of oil and gasoline is up and that is always news and very apparent to consumers almost immediately. And of course people always worried about toilet paper supplies- which I am sure we have not forgotten how to make.
Good blog post. I saw this all over the news last night… RBA pressured to raise rates because inflation is tracking above 3%!! There is such a rediculus leap of logic from the media that raising rates would somehow stop prices rising… how could it possibly do that in the current economic conditions???? It would clearly just make things more expensive! We are only just starting to recover from a massive downturn, so of course prices are going to start rising! Interest rate hikes are not going to have any impact on that.
The inflation mania reminds me of the drop in the £ mania after the brexit vote. It is the same faces in the media pushing it.
In the UK the fact that different parts of the global economy have been switched on/off at different points in time for the last 18 months and inflation is coming in at 3.1% is remarkable.
That last time UK inflation came in at around 3.1% was in was in 2013 and 2017 under normal circumstances. When the UK economy was fully open.
No mania – no hype nothing during those times. Nobody even noticed.
It is all to do with pushing the narrative that government spending is the devil. The banking lobby is making sure it happens on a daily basis.
The Consensus is inflation will peak in some countries by the first quarter of next year. Japan hasn’t even got any. Then just like the £ mania after Brexit vote it will completely vanish from our screens. But the propaganda seed has been planted and that’s all they are bothered about. The propaganda sticks to be pulled out of their box of tricks whenever they need it.
Rinse and Repeat.
When inflation does subside and it will when the private sector gets its act together instead of crying out for cheap Labour. MMT economists have to get on the media and make a very big deal about it using historical charts the works to show the current paradigm is dead.