Economics and business correspondents regularly serve as apologists for poor policy. Their motivation is to…
Policy failure – Australian unemployment rate probably already around 10.9 per cent
The Australian Bureau of Statistics has started publishing weekly employment data – Weekly Payroll Jobs and Wages in Australia, Week ending 4 April 2020 – which is drawn from a new series made available as a result of the Single Touch Payroll data provided by the Australian Tax Office. For the first time, researchers like me can have up to date information as the economy cycles. Usually we get the labour force data some 5-6 weeks behind time and although a lot doesn’t necessarily happen in a month, this crisis is the exception – the whole box-and-dice is collapsing so quickly that we need weekly data, like is provided in the US through the Department of Employment’s unemployment claimants data to stay in touch with how things are tracking. But for now I estimate that the unemployment rate rose to around 10.9 per cent in the 3 weeks to April 4, 2020 (up from 5.2 per cent for the March data – which was surveyed in the early part of the month). In that time, unemployment has more than doubled and is around 1.5 million and rising. The conclusion from my analysis of the latest available data (released April 21, 2020) – is that some sectors in the Australian labour market have experienced a sudden and catastrophic contraction – like nothing we have ever seen in the data. Both employment losses and major wage cuts are underway and the policy response is totally inadequate for the task. A much larger fiscal intervention is required and it has to be directed at workers rather than firms. I will say more about those issues next week. But I am guessing that the Government’s response so far is less than half of what it should have been – it needs at least another $A200 billion.
I also provide an update on the US situation which is getting worse by the week. While the Australian deterioration in employment is not dissimilar to what is happening in the US, the difference is that the welfare support in place is far superior than is being offered by the US government. And I would not want anyone to think that the Australian fiscal support is anywhere near large enough or properly targetted. So that puts the US situation in context (see below).
Jobs collapse in Australia
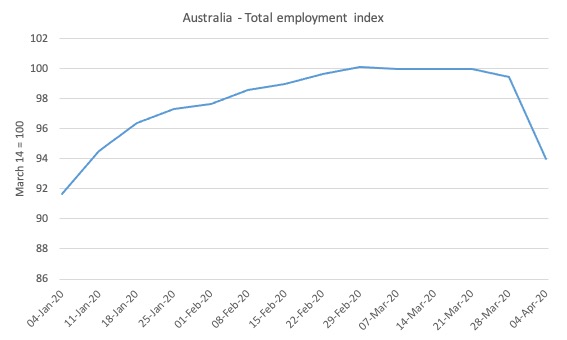
Here is what has happened to total employment in Australia since January 4, 2020 (the ATO data starts at the beginning of the year). The index is based at 100 on March 14, 2020 which appears to be around the peak employment, although it was slowing since February 29, 2020.
There has been a 6 per cent contraction since March 21, 2020 and almost all of that (4.5 per cent) happened in the week to April 4, 2020. I expect when we get the next release, the contraction will be even greater.
The pattern is almost identical for males and females, so no gender discrimination is evident in the way the jobs are being shed.
What does this imply?
We can do some ‘back-of-the-envelope’ calculations with some assumptions to see what this might imply.
- If you take the national data and assume that total employment has contracted by 6 per cent in the last week (the ATO payroll data is not a full sample), then a fall of 6 per cent, means that by April 4, 2020 (around a month after the last labour force survey was taken), total employment had fallen by 780 thousand jobs.
- If there had been no change in the participation rate (assumption), then unemployment would have more than doubled from 718.6 thousand in the March data to an estimated 1,499.7 thousand by April 4, 2020 – an increase of 781 thousand.
- Again, assuming the labour force is unchanged in that period, the unemployment rate would have risen to 10.9 per cent (up from the official March figure of 5.2 per cent)
That is a staggering shift in one month and a sign that the Australian government’s fiscal intervention is at most half as much as it needs to be.
If you recall, a few weeks ago I did some rough modelling of my own which I presented in these blog posts:
1. “We need the state to bail out the entire nation” (March 26, 2020).
2. The government should pay the workers 100 per cent, not rely on wage subsidies (March 30, 2020).
I provided this Table, which helps us understand the relationship between GDP growth and changes in the official unemployment rate.
| Period | GDP contraction (peak to trough) % | Increase in UR to peak (points) |
| September 1981 to June 1983 | -3.71 | 4.69 |
| June 1990 to June 1991 | -1.43 | 4.71 |
From that Table, we derive a rough rule of thumb that:
For every 1 per cent that GDP contracts, the unemployment rate rises by 2.5 percentage points, which given the current labour force would add 304 thousand workers to the unemployment queue.
There are cyclical effects on participation etc that are not included in these types of estimates but they help ground us in reality.
Accordingly, the following estimates can be derived.
| Fall in GDP (per cent) | Rise in UR (points) | Estimated UR (per cent) | Unemployment (000s) | Change in Unemployment (000s) |
| 1 | 2.3 | 7.5 | 1,024 | 304 |
| 2 | 4.5 | 9.7 | 1,335 | 615 |
| 3 | 6.8 | 12.0 | 1,647 | 927 |
| 4 | 9.1 | 14.3 | 1,958 | 1,238 |
| 5 | 11.4 | 16.6 | 2,269 | 1,549 |
| 6 | 13.6 | 18.8 | 2,580 | 1,860 |
| 7 | 15.9 | 21.1 | 2,892 | 2,172 |
| 8 | 18.2 | 23.4 | 3,203 | 2,483 |
| 9 | 20.5 | 25.7 | 3,514 | 2,794 |
| 10 | 22.7 | 29.9 | 3,826 | 3,106 |
So it is implying that GDP growth may have slumped between 2 and 3 per cent just in the month to April 4, 2020. An amazing collapse.
Historical comparisons:
1. In the 1982 recession, total employment fell by 3.4 per cent from its peak in April 1982 to its trough in April 1983 – which was considered a devastating contraction.
It returned to its pre-recession peak in April 1984. So peak-trough-back to previous peak took 2 full years.
2. In the 1991 recession, considered the worst since the Great Depression, total employment fell by 4.0 per cent from its peak in July 1990 to its trough in February 1993.
It wasn’t until July 1994, that it returned to its pre-crisis peak – a full 49 months or over 4 years.
3. Derived from data provided by – Source papers in economic history – allows us to see what happened during the Great Depression.
The data is annual and employment in Australia peaked in 1930. By 1932, it had contracted by 9.7 per cent before exceeding the previous peak sometime in 1935.
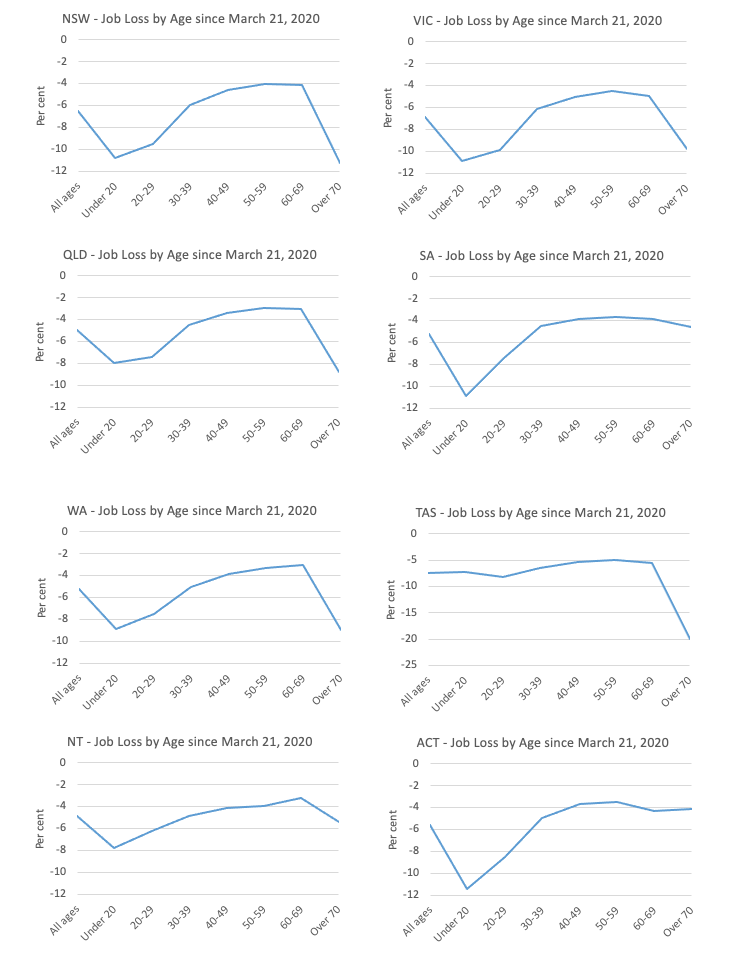
Age breakdown
At the national level, no age breakdowns are provided.
But these are provided at the state/territory level and the following sequence of graphs gives the age profiles of the job loss for each region.
It is clear that our youth are bearing the brunt of the crisis, largely due to the industrial composition of the job losses – services, accommodation etc.
Industry breakdown
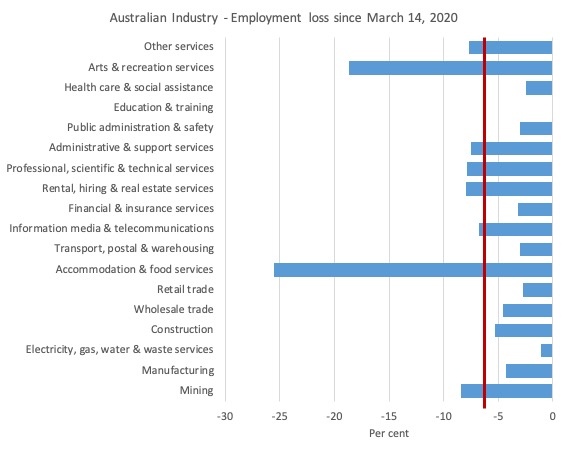
The following graph shows the percentage decline in employment between March 21, 2020 and April 4, 2020 for the Australian industry sectors.
The red line is the national average loss (6 per cent).
As expected the worst hit sectors are Accommodation & food services (decline of 25.6 per cent) and Arts & recreation services (decline of 18.7 per cent).
What is quite unusual is the 7.9 per cent decline in Professional, scientific & technical services and the 7.5 per cent decline in Administrative & support services. These sectors are usually not very sensitive across the economic cycle.
But this crisis is not your usual economic downturn.
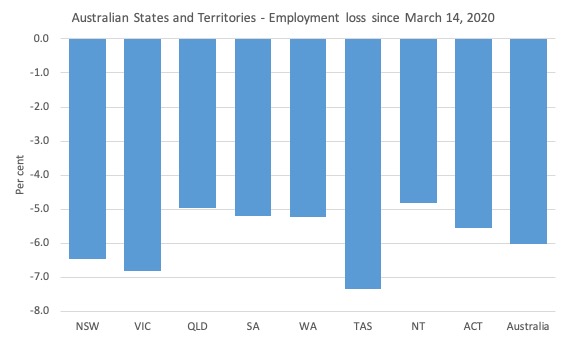
State breakdown
The spatial pattern overall is fairly even, although the large employment states of Victoria (-6.4 per cent since March 21, 2020) and NSW (-6.8 per cent) have recorded losses above the national average (-6.0 per cent) and the small island state of Tasmania, which has had a severe concentrated outbreak of the coronavirus has performed the worst (-7.3 per cent)
This graph shows the state/territory percentage job losses from March 21, 2020 to April 4, 2020.
The US contraction continues
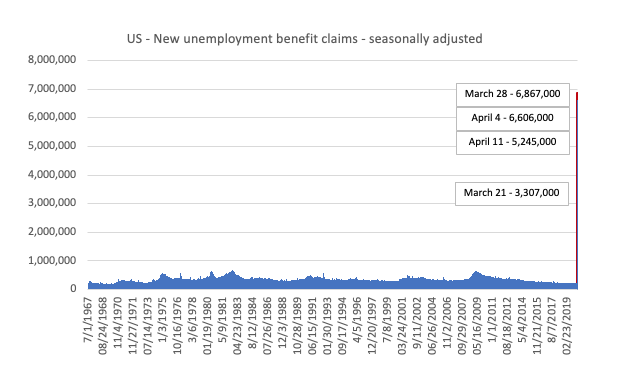
Here is the latest update (as for the week ending April 11, 2020) from the US Department of Labor’s weekly data releases for the unemployment insurance claimants.
I first started tracking this data for this downturn in my last commentary on the monthly US labour market data release – Tip of the iceberg – the US labour market catastrophe now playing out (April 6, 2020).
The Department of Labor provides an archive of the weekly unemployment insurance claims data back to July 1, 1967 – HERE.
The weekly data can be found in the – UI Weekly Claims Report.
Bringing together the archived data and the most recent release (April 11, 2020), the following table tells the shocking story.
| Week ending | Initial Claims (SA) | Weekly Change | Cumulative sum since March 7, 2020 |
| March 7, 2020 | 211,000 | -6,000 | n/a |
| March 14, 2020 | 282,000 | +71,000 | 282,000 |
| March 21, 2020 | 3,307,000 | +3,025,000 | 3,589,000 |
| March 28, 2020 | 6,686,700 | +3,560,000 | 10,456,000 |
| April 4, 2020 | 6,606,000 | -261,000 | 17,071,000 |
| April 11, 2020 | 5,245,000 | -1,370,000 | 22,316,000 |
If we assume all those new claimants were unemployed then the unemployment level by mid-April would have been around 28,103 thousand which would mean that the unemployment rate would have been 17.3 per cent compared to the BLS March figure (taken up to March 10) of 4.4 per cent.
So within a month, the unemployment rate has probably jumped from 4.4 per cent to 17.3 per cent (give or take).
That is a shocking deterioration.
The peak unemployment rate during the Great Depression was 24.9 per cent in 1933, before the New Deal brought it down somewhat.
The next graph adds the last four weeks of available data (week-ending March 21 to April 11, 2020) to the entire sample.
The spike at the end of the graph shows how drastic the situation is in the US.
This is a quite extraordinary graph.
Last week, I also provided some spatial analysis – US downturn very harmful to low wage workers and their communities (April 14, 2020).
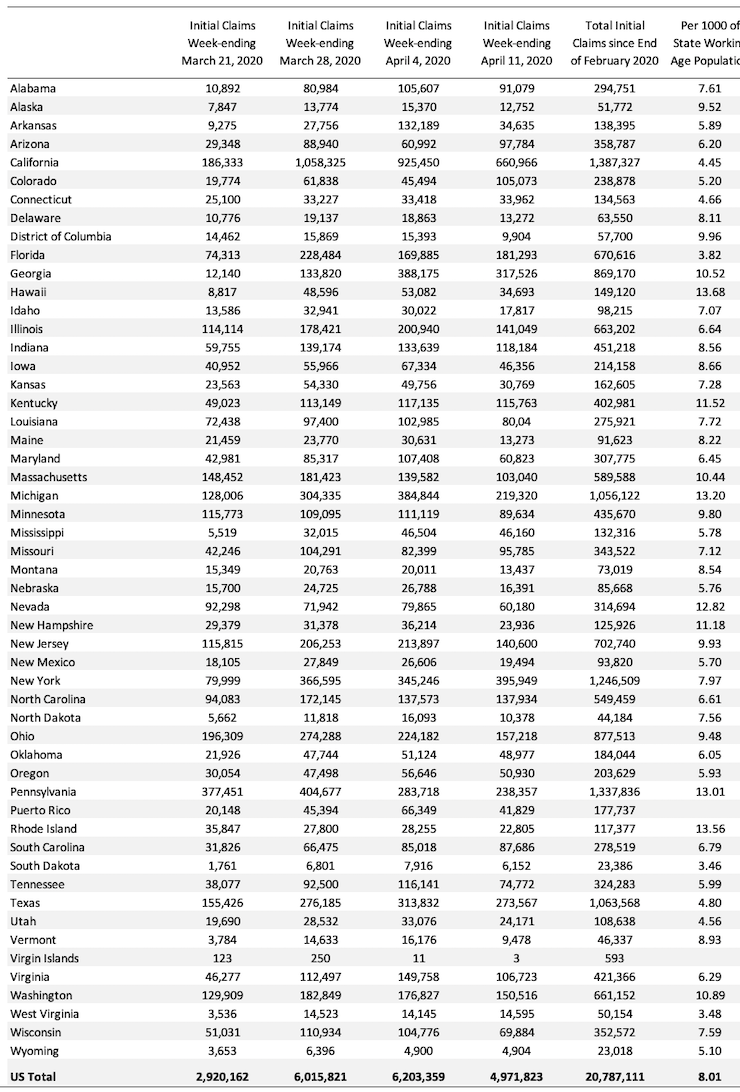
In the Department of Labor report cited above, we saw there were sharp differences in initial claimants across the US states.
The next map shows the cumulative sum of unemployment insurance claimants since the end of February 2020, expressed as a percentage of the Working Age Population in each state (Alaska was 9.52 per cent and Hawaii was 13.68 per cent).
This graph more starkly demonstrates where the loss of jobs is impacting most significantly. You can compare this map with the map I produced last week to see where the virus job losses are having shifting impacts.

The following Table presents the same data for those who prefer numbers.
Conclusion
I have spent a little time today acquainting myself with the ABS’s new data set that allows for weekly employment estimates.
I have not reported the wage analysis today (space and time) which is equally as bleak.
The conclusion is:
1. The Australian unemployment rate rose to around 10.9 per cent in the 3 weeks to April 4, 2020 (up from 5.2 per cent for the March data – which was surveyed in the early part of the month).
2. In that time, unemployment has more than doubled and is around 1.5 million and rising.
3. This is a catastrophic rise.
4. A much larger fiscal intervention is required and it has to be directed at workers rather than firms. I will say more about those issues next week.
But I am guessing that the Government’s response so far is less than half of what it should have been – it needs at least another $A200 billion.
That is enough for today!
(c) Copyright 2020 William Mitchell. All Rights Reserved.
Thanks Professor. I liked the picture since it easily pointed out some disparities between states that I don’t really understand but are interesting. In the US quite a bit of leeway is granted to state governments- for better or worse. So there are variations in the levels of what we call ‘lockdown’ (like it is anything at all like prison). So that accounts for some of the disparities.
Then there are states like Nevada, where most of the people live in Las Vegas whose main industry is casinos and is highly dependent on ‘tourist gamblers’- I can understand that. The casinos are closed right now and even if they were able to open there are far fewer people would risk travelling there.
Not sure about Pennsylvania or Michigan and why they seem hit so hard. Lot of manufacturing left in those areas- maybe that is it? My state Connecticut seems to be doing less worse than average. Figure that is because the governor didn’t close down the two largest manufacturing companies (they build jet engines and nuclear submarines- got to keep the military supplied at all times). Also we have lots of people who work for insurance and financial companies who can work from home.
Well this is interesting to ponder. I’m guessing with the sudden declines in oil prices states like Texas and N. Dakota and others that have sizable extraction industries will turn deeper colors on the chart.
To end on a positive note- there are people working all over the US and the world on treatments and vaccines for this virus. And the US has plenty of very talented people in that area as do other countries so I am keeping my hopes up.
Dear Jerry Brown (at 2020/04/23 at 3:00 pm)
Thanks for the surmise.
Note that I was rushing to a meeting this afternoon and accidentally published the post before it was even half finished.
You can now read the full version and compare Australia with the US.
Both are looking ugly.
best wishes
bill
Dear Bill et al.
I’m fairly new to this blog and discussion forum, but have very much enjoyed the blog posts and comments I’ve read thus far. If I may venture an observation, not a criticism – and a suggestion.
I’m not an economist, what little knowledge and interest I have came from a high school education forty years ago, which only has a historical relevance now – thanks in no small part to your own contributions through the MMT perspective.
My profession was podiatry – or chiropody – if you’re old enough. We also have our own discussion forums and any number of blogs exploring all matters pertaining to feet and their function. They can be equally fascinating, detailed and historically, professionally important – much like this website. We have our own progressives and snake-oil salesmen too – and naturally, much debate explores claims and counter-claims.
All very interesting, but for an ordinary individual seeking information about their foot problem, it’s not a great deal of help. They are not interested in what treatments were used half a century ago, why caustics and duck tape don’t work or what might be the best way to record outcomes or who should be treating them.
They are only interested in information that explains clearly what their condition is and how it can be resolved – an explanation and good advice so they can make an informed choice and act accordingly. But that’s only possible if we use language they can understand easily and clearly.
I cite verruca for good reason. It’s another virus (HPV) that, historically, has been difficult to treat. For clinicians, that’s good news – it means more office visits and more money – indeed, many colleagues have their entire business model based on a “cut & come again” regime.
However, in the last decade, medicine has developed an effective vaccine for HPV to address another, more serious manifestation of the virus – cervical intraepithelial neoplasia (CIN) or early stage cervical cancer, which has also drastically reduced the incidence of verrucae infections in feet.
This development has destroyed the podiatry business paradigm. You won’t find discussion on the outcome of the vaccination program or how it led to an entire new topical drug regime for treating other HPV infections – like verrucae – using immune modifiers such as Imiquimod – an inexpensive, effective non-caustic cream, which can be easily and safely applied at home by the patient.
Why promote something that will lose you money?
The real loser though is the patient. They may seek advice from the established professionals, but what they find is an introspective clique arguing over who said what and when, whilst ignoring critical evidence outside their clinical scope – even though it has direct bearing on their own practice and the welfare of their clients.
What would prove beneficial is clear, unequivocal guidance based on robust evidence that Mrs AN Other can understand even without medical knowledge. To achieve that have to translate our academic professional shibboleth into plain English.
Everyone is desperately trying to gain an understanding of economics and how our governments and financial systems operate. From what I have read so far, MMT is not a new economic model, but simply a more accurate analysis of how the governments actually operate their money supply.
With the knowledge you all have gained through this, I am very much looking forward to proposals on how we start to fill that blank page and how we can apply that knowledge to create a better world. I’m sure I am not alone.
One day, it may be an enjoyable enlightenment to look back and read about the history – it is important – but right now, at this moment, we need to be looking forward with a well-thought out simple plan we can all follow. Our eyes are at the front of our head for good reason.
I sincerely hope you can help.
Best wishes.
@Mark Russel asks for “… proposals on how we start to fill that blank page and how we can apply that knowledge to create a better world…” :-
“Modern monetary theory proponent, Professor Bill Mitchell, advocates for governments to use the policy space provided for them by monetary sovereignty to introduce a job guarantee and pursue a return to unemployment rates of 2% or less. These rates were achieved in Australian across the 1960s and early 1970s. He proposes a return to full employment through a federally funded and locally managed program of public employment. He does not believe that this need be inflationary – indeed the job guarantee is an essential part of the modern monetary theory framework for stabilising the economy and avoiding inflation.”
theconversation.com/explainer-what-is-modern-monetary-theory-72095?fbclid=IwAR0RAl1f-EJZ09tXSsB1lP4sWWz7wzMzW6xuXnmgzjPESKlPd8KilGgYg08
Thank you Natasha – yes, I’ve read these. What I am more interest is how we apply this knowledge and construct the framework to implement fiscal policy – not just nationally, but globally – so we’re all reading from the same score. In my (limited) experience, if you establish progressive policies in one region or country – then unless you restrict movement of people and migration – it fast becomes unsustainable. There are lot of arguments against overarching global governance – the NWO conspiracies – but it seems to me that might be worthwhile consideration, providing transparency, democracy and honesty are the core principles. Extrapolate the knowledge and potential you have discovered in the parochial national arenas and apply it to a unitary global model.
The notion that we are all Jock Tamson’s Bairns is not unattractive in the slightest.
So today the Governor of New York announced that they had done a random test for antibodies to the virus of 3000 throughout NY state and that the results had found that 13.9% of the population has already gotten the covid19 virus. So I have been depressing myself by very amateur analysis of what that means and want to share that so that hopefully someone can un-depress me and show where I am wrong.
There are a lot of assumptions made here.
Population NY State- 19,900,000
13.9% of that is 2,766,100 infections that have resolved.
21,000 resolved in Death leaving us a case fatality rate of about 0.76%
Currently there are 17,133,900 New Yorkers who have not yet been exposed to the virus
If all of them get infected at 0.76% fatality rate then we expect 130,046 additional deaths in NY state
I will estimate USA population at 300 million for this exercise
If all 300 million got the virus we would expect 2,280,000 to die.
But herd immunity might kick in at say 80% infected and resolved
So if that is accurate then we can expect 20% less deaths
Leaving us with 1,824,000 expected deaths in the USA from this virus.
Somebody Please tell me I screwed this up and very badly and you will make me very, very happy.
Dear Mark Russell,
The 1% (the oligarchy) will never allow for the establishment of the framework to implement fiscal policy to create a better world. Because they want to be the only group controlling the flow of capital, the indispensable elite leading the Western societies, at both national and global levels. They mould property rights so that their interests are always on the top. Please read Marx, not much has changed since. The loanable funds doctrine is not descriptive, it is prescriptive. The system is artificially designed in such a way that we have to “borrow” the preexisting capital, so that the owners have more control and power. Objectively money is endogenous but the system has to pretend to operate as if it wasn’t. This is all what liberalism is about, it is about defining and enforcing by the state’s “apparatus of violence” absolute property rights of the 1%, all the talk about “democracy” or “equality” is a cruel joke. (So-called intellectual property rights are the best example of a relatively fresh invention used to brainwash people about what can be “privately owned” – the knowledge, ideas and even combinations of words can supposedly be “legally owned” by someone and a lot of very intelligent people have became victims of this hoax). Why was Kerry Stokes exempted from the quarantine? A “preexisting medical condition”? “All animals are equal, but some animals are more equal than others.” This is the name of the condition. The 1% will not tolerate any competition but they create a delusion that anyone can have a go and that the majority of the society are in fact little capitalists (petit bourgeois) because they have super accounts and 60% of us have properties. So the 1% are on “our” side, “we are all in this together”. The oligarchy gladly accepts fiscal help when their own wealth is collapsing. But when the direct threat is over, they are back to their old tricks and the return of fiscal discipline in Australia is a matter of time. We can say whatever we want. Nobody will listen.
Even in semi-fascist countries like Hungary of Poland, populism does not threaten their respective groups of economic oligarchs, they are just welded to certain socio-political groups such as the representation of Catholic clergy in Poland. The only difference between the liberals and the Catho-fascistic (or extreme nationalists in Hungary) is slightly different rhetoric and throwing more breadcrumbs to the poor. NB I think that the return of the conservative, pro-European liberals would be yet another disaster in Central Europe as they would represent not the interests of local oligarchy but rather the Germans. It is always better to be exploited by a local leach than a foreign one, especially if she is German. But this does not mean that I support the current regime in any way, I am staying 16000km away from it.
In regards to another curious experiment, currently implemented in China, we need to wait a few more years. I am cautiously optimistic about the outcome there, as long as there is more socialism than state capitalism in their ideology. But the so-called liberal West is going to linger in stagnation like in 7th-10th centuries and the era of global domination is over. The dark ages have arrived and they are here to stay. The stagnation and decay, not a revolution, is the final state of mature capitalism. If we calculate the rate of profit by looking at the ratio of corporate profits to the total wealth hoarded by the rich, (including the fictitious capital), the fall in the rate of profit is clearly visible. The 1% have hoarded too much and this has undermined the viability of the system. But Marx was an optimist, he believed in a revolution and building a rational communist society. There will be no revolution. Zombies do not revolve.
My Dear Adam
That sounds terribly defeatist and hopeless. However, as you observe, the odds are very much in our favour – assuming you are also one of the 99%. The only advantage the ‘oligarchy’ has is the ability to progress, quite ruthlessly, a crystal clear agenda: to preserve the status quo. It does so by maintaining secrecy and promoting ignorance in politics and the financial sector. Perhaps in time we will come to regard MMT as a form of forensic financial accountancy as much as an enlightenment.
I’m sure Marx was correct with his observations and of course human nature has some enduring qualities – good and bad – but many of his principles, consistent with other great philosophers and leaders, have a solid grounding and much potential. But they had one great difficulty – with communication and mobilising the 99% when the opportunity arose.
I do agree – stagnation, decay and complete collapse back to the Dark Ages is a distinct possibility. Whether you regard it as a revolution or not, we must do what it takes to avoid that outcome. N’est-ce Pas?
Regards
So my brother Ed, who has always been far better than me at math, responded to my plea via email. And I will post what I can of it.
“Jerry, There is nothing wrong with your math, it is just your data and your assumptions that are screwed up.
NY State has approx 15,740 fatalities, according to NY State: (link to NY State Health Department stats- I was using stats from worldometers.info that had NY deaths at 20,861
The data is preliminary and more will come in. Right now there are some of the same issues with the serology stuff as with the other tests: both numerator and denominator issues.
• Numerator issues:
o some folks who are ill now will die but have not died yet
o there may be some people who have died of this disease but it was not captured
• Denominator issues:
o some folks who got infected may not have developed antibodies yet (it can take 3 weeks or so)
o some folks who get infected, particularly young folks, may not ever express antibodies – not sure why but that seems to be the case
o the testing is not entirely random and may overstate the frequency
o the testing may have false positives overstating the denominator
While there are theoretical reasons to believe one could approach an 80% infection rate, I don’t think it is accurate. Those are very simplified models that don’t comport with actual experience. I doubt it will get that high – at least not in 1 year. It may get there over the next 5 years though. But in the normal course of business we lose 2.8M Americans/year or 14M in 5 years, so it might be good to keep it in perspective.
Anyway if you want to posit a 0.5% IFR and an 80% infection rate in one year, you end up with a 0.4% population fatality rate in one year. You’d think we’d see that already somewhere but we don’t. Maybe we will get there, I don’t know.
Locally, in the hardest hit regions, in parts of Italy and NYC, etc., I think we are around 0.15% population fatality rate. Those areas are past the peak also, but of course it is not over. Perhaps they will hit 0.4% in NYC – it is possible. But averaged over a country like Spain, Italy, UK, France, or the US? It is not reasonable to take the absolute worst outcomes we’ve seen locally so far, basically double them, and then assume that will be the average result for the whole country.
Finally, and it does not get enough attention: what matters really isn’t deaths per se. If some guy was about to die tomorrow from cancer but he dies today from COVID, it is sad, but not as sad as if he was going to live another 60 years but he dies today from COVID. So some sort of years-of-life lost type of measure. I don’t know how to do that precisely but it clearly matters. I mean, it just matters a whole lot.
If people are going to die, I prefer it to be after they’ve lived a long life. When an 86 year old passes away it is just not as sad to me as when a kindergarten kid does.
Around 40% of the deaths in CT are of people in nursing homes. Here is the age breakdown for CT: (link to State of Connecticut site showing exactly that age distribution).
Try to take some solace in this at least. The 1918 influenza virus killed tons of people in their 20’s. Some diseases kill lots of children. This pandemic is bad, but it is sparing our children. ”
So I hope my brother is right- he usually is. We have disagreed vehemently on this subject over the past month. Much too often. I’m the amateur economist but am also the one who has a harder time discounting the value of life for anyone – it is one of those things I hated about economics in the first place and I avoid it where ever possible.
@Jerry Brown
I don’t disagree with your brothers ethical judgement that it’s probably sadder for a child to die than for someone who is on their last legs with a terminal illness – but I think that might overstate the case somewhat.
I think it would be dangerous to adopt a manner of thinking whereby we subtract one point of value from the perceived value of a human life for each year that person has lived.
Also, plenty of people who are in the higher-risk categories of dying if they contract the virus would actually stand a good chance of living for quite a significant span yet if it were not for that. My brother-in-law has a condition that puts him a such a category – but he is still working and is likely to live decades yet if he is not felled by this bug. He is likely to have grandchildren and play an important role in their lives if he does not perish first.
I don’t mean to sound harsh but if your brother were made to spend a few days in an ICU in a badly-affected place, watch people perishing one after another, visit morgues packed with bodies……..it might help to broaden his perspective of the victims of this pandemic beyond being mere numbers and abstract mathematical concepts.
Confusion in the mainstream:
from ‘The Economist’: “What would Keynes do? The pandemic will leave the rich world deep in debt, and force some hard choices. Who takes the pain, and can there be gain”.
An awful read!
And in a reply to this article by progressive think tank Per Capita, in ‘The New Daily’: “No need to worry about paying off government debt, says think tank” …..
independent economist Saul Estlake comments: ” the fundamental premise of Per Capita’s report was sound and there was “no compelling requirement that [government] debt be paid off by some pre-determined date. He told The New Daily the federal government is under no compulsion to enact spending cuts after the crisis to pay for its virus spending spree as its debt is relatively small and interest rates are at all-time lows. Mr Eslake warned, however, public spending was not “a magic bullet” and that over the long term “you would want household spending and business investment to be the primary drivers of growth. I don’t think it’s the time for some of the other ideas that often pop up – like a jobs guarantee or a universal basic income,” he added, describing such policies as income-support measures rather than productivity-enhancing investments”
Saul obviously equates a JG in with a UBI, but he appears to be halfway there…
Lefty, my brother was trying to cheer me up. I was horrified by the numbers I came up with originally. He is one of the most decent ethical people I know. But is still hard to discount lives- it is a tricky thing putting values in monetary terms on human lives. I’m not sure it is ethical at some level. But he didn’t go there in any case. I think it is more tragic when a fifteen year old dies than a 95 year old does- I think most people would agree. But I am never going to try to calculate how much more so or worse, monetize that.
Where the pandemic is concerned, it’s dangerous to reduce its “damage” to the death count alone. There will be large numbers of survivors whose health will have been seriously compromised.
Then there are the effects upon our health care systems themselves. The whole premise of the isolation protocols is to manage the infection rate in such a way as not to completely destroy our capacity not only to combat this particular disease, but continue to treat all of the other ailments for which it is also designed.
The human cost both among the afflicted and those who comfort them is terrible. Beware especially the quislings among us who invert the value hierarchy with some monstrous notion that an abstraction they call “the economy” must be served, like Moloch, with the sacrifice of our offspring and ourselves — economic arrangements exist to serve the health and wellbeing of people, NOT the other way round.
As for Mark Russell, while there is a nobility in a vision of international cooperation where economic arrangements are concerned, the locus of control where policy design and implementation are concerned remains the nation state as long as the current Westphalian system prevails. As such I would encourage progressive economic thinkers to work locally, while staying in communication and support with one another internationally as blogs like this one facilitate.
@ Adam K
Your analysis is compelling and personally I can’t fault any of it. Except this:-
“But Marx was an optimist, he believed in a revolution and building a rational communist society. There will be no revolution. Zombies do not revolve”.
Here you exemplify the basic flaw – namely, that “facts” being what they are (or are perceived as being) they must ineluctably lead to only one possible outcome. That is never the case. We are not automata (or zombies). We do have choices. Acts do have consequences (which almost always are different from – not infrequently the opposite of – what the actor intended). Nothing is preordained except the ultimate fate of the solar system and with it all forms of life it contains (but long before then ALL bets will be off anyway, so who cares?).
“The human cost both among the afflicted and those who comfort them is terrible. Beware especially the quislings among us who invert the value hierarchy with some monstrous notion that an abstraction they call “the economy” must be served, like Moloch, with the sacrifice of our offspring and ourselves – economic arrangements exist to serve the health and wellbeing of people, NOT the other way round.
As for Mark Russell, while there is a nobility in a vision of international cooperation where economic arrangements are concerned, the locus of control where policy design and implementation are concerned remains the nation state as long as the current Westphalian system prevails. As such I would encourage progressive economic thinkers to work locally, while staying in communication and support with one another internationally as blogs like this one facilitate”.
Amen, to all of that.
“As for Mark Russell, while there is a nobility in a vision of international cooperation where economic arrangements are concerned, the locus of control where policy design and implementation are concerned remains the nation state as long as the current Westphalian system prevails. As such I would encourage progressive economic thinkers to work locally, while staying in communication and support with one another internationally as blogs like this one facilitate.”
Clealy different regions/nations will have their own particular needs and offerings and will require a framework specific to their circumstances – not suggesting a one-size fits all approach under a unitary government, but a model where individual governments can run their affairs guided by agreed fiscal principles – now that we better understand and appreciate the potential provided by MMT analysis.
I’m not sure we are that far apart given your suggestion.
Meanwhile in Australia, Tony Abbott is advocating retaining higher dole payments and a public works program. This could be a well-calibrated response to Turnbull’s attack on the right-wing Liberals, to outflank the centrists them from the left.
The article is available on the Australian (it is paywalled but can be accessed from Abbott’s Twitter feed). I am quoting his words as I consider his intervention as relevant. My comments follow.
“Once battle resumes, for the centre right there should be less dogma about the size of government and more of an appeal to the strength of our country and the quality of its citizens. While subsidies to business can be readily enough withdrawn, personal benefits such as the double-dole will be harder, especially when recipients will be able to say it was government policy that threw them out of work. Instead of just withdrawing the payment – on the grounds the immediate crisis has passed and it’s no longer affordable – I’d be inclined to turn it into a wage subsidy for older people and a part-time environmental job with local government for younger people. I’d make it about improving society rather than about improving the budget. Eventually, the budget will improve because people will earn their pay (and won’t need subsidies) and people will choose their job (and won’t just stay where they were allocated).”
Abbott demonstrates clear understanding of Keynesian economics and disregard to neoclassical economics and the “small-l liberal” way of thinking. If the relevant fiscal multiplier is high enough, increasing government expenditure on unemployed reduces public debt to GDP ratio in the long run.
Leão, P. (2013). The Effect of Government Spending on the Debt‐to‐GDP Ratio: Some Keynesian
Arithmetic. Metroeconomica, 64(3), 448-465.
His words about “part-time environmental jobs” might have been inspired by the idea of Job Guarantee, even if the macroeconomic concept of using JG as a wage anchor to control inflationary pressures is absent from this kind of commentary.
Personally I consider Tony Abbott’s views as dangerous as they may actually work, if implemented (as demonstrated in Poland with the so-called 500+ program and similar initiatives). Fortunately Abbott will not return to politics and won’t be able to inflict more harm on the environment by expressing his climate change denialism and won’t be able to have another go at using the state apparatus for imposing his medieval moral views on non-Catholics. Unlike the ruling party in Poland…
This is off-topic, I am sorry I am putting it here and I am most likely wrong but I have been obsessively looking for the source of the anomaly, why people are dying at such a high rate in some Western countries while China and Russia are far less affected. In Russia they have 62773 people infected and only 555 have died (data from 23/04). Daily growth is 9-10% and they have strict lockdown rules in Moscow but this itself is not an anomaly.
In NYC they have 146139 cases and confirmed deaths stand at 10746, probable at 5102. They are certainly at a slightly later phase of the epidemics and they may be differences in the reporting process but this does not explain the whole discrepancy.
I won’t hide that I started looking for the information on Russian-language websites. The main difference in the treatment of coronavirus in China/Russia is the use of liquorice as a supplement, which has an active ingredient called glycyrrhizin, early in the progress of the disease, when symptoms are light to moderate. Only when a patient deteriorates, they start applying “Western” medicine. “On 17, February, National Health Commission (NHC) of the People’s Republic of China reported that 60,107 confirmed COVID-19 patients (85.20% of total confirmed cases) had been treated with TCM” Int J Biol Sci 2020; 16(10):1708-1717. Liquorice is an ingredient of traditional Chinese and Slavic herbal medicines. It is also added to tobacco as a sweetener what could explain rumours about health benefits of smoking currently circulating in France. In Russia it is sold as сироп корня солодки (liquorice syrup). Apparently researchers from National Institute for Infectious Diseases in Bucharest, Romania, successfully used a food supplement made of liquorice root, called “Viusid” on some patients (this information is presented on the Moldovan website of “Konsomolskaya Pravda” in Russian). There are papers from the SARS era describing the mechanism how glycyrrhizin works. Lancet. 2003 Jun 14;361(9374):2045-6. Additionally, in Russia they recommend “Galavit” which is a synthetic immunomodulating drug. This information is from happydoctor, ru blog (obviously in Russian).
Anyway, the way patients are treated in Western countries is based only on “official” Western medicine, people are only told to isolate and nobody bothers reading Russian or Chinese websites what I think is strange, considering how many people born in the former Soviet Union or China live in NYC.