The recent extreme weather in the northern hemisphere, the twin monster tropical storms in Japan,…
Older workers in the US dominate employment growth – troubles ahead
The Federal Reserve Bank of St Louis published a very interesting article earlier this month (January 15, 2018) – Older Workers Account for All Net Job Growth Since 2000 – which was written by William Emmons, the Lead Economist with the Bank’s Center for Household Financial Stability. The Center focuses on the “balance sheets of struggling American families” and was launched in May 2013 in response to the GFC. It seeks to investigate factors that impact on the fragility of household finances. The research paper finds that since 2000, workers older than 55 have captured almost all the net employment growth leaving the prime-age workers (more than a million) languishing. This abnormal pattern is not predicted to continue for much longer but that is disputable. Further, even if the domination of older workers ends within the decade, the lack of opportunities that are apparent for those who are moving through the prime-age years now spells a looming disaster in a decade or more in the form of increased poverty rates and disadvantage. Then you will hear the screams that the US government cannot afford the income support that will be needed. But at the same time, without that income support the situation will get worse. Something needs to be done now to interrupt this trend.
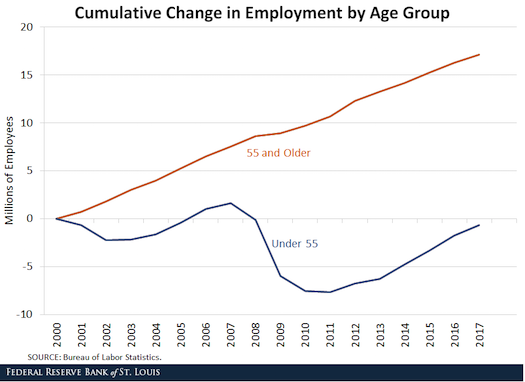
The FRBSL article analysed the shift in employment in the US since 2000 by two age groups: – 55 and older and Under 55.
It was in the context of related research published by the Bank in its quarterly journal, the Regional Economist – Boomers Have Played a Role in Changes in Productivity – which appeared in the Fourth Quarter 2017 edition and was written by Guillaume Vandenbroucke.
I will summarise that article first:
1. “In the 1970s, the U.S. economy experienced a prolonged period of low productivity growth. Nowadays, growth in productivity is once again slower than expected.”
2. The conjecture is that “the two slowdowns are related to a single, common factor: the baby boom, that period from 1946 to 1957 when the birth rate increased by 20 percent.”
3. “the productivity slowdowns (especially in the 1970s) are statistical artifacts, that is, it may be that the productivity of individual workers did not change at all during the 1970s, but that the change in the composition of the labor force caused the slowdown in labor productivity.”
4. Why? How? Younger workers are less productive than older workers due to having less experience, education, and training. An “increased proportion of young workers reduces labor productivity as we measure it via output per worker”, which is the explanation for the drop in productivity in the late 1970s as the boomers came of age.
5. And now? The boomers are retiring and “tilting the scale toward the younger population once again”.
The problem with the thesis is that share of population in the less than 55 years of age cohort has continued to fall since 2007 in the US, although that may be a finite process that will reverse.
But the claim is clear – that as the workforce ages, real GDP growth is reduced for any given employment level.
The first-cited FRBSL article cited took up that theme and found that:
“Prime-age workers” are those between 25 and 54 … Numbering almost 100 million in December 2017, this age group is both the largest and most productive set of workers …
Yet, all of the net increase in employment since 2000 – about 17 million jobs – has been among workers aged 55 and older … Some economists fear that our aging workforce may be holding back economic growth.
That is the thesis that the article explores.
On face value, that is a staggering result: Almost all the net employment change in the US since January 2000 has been captured by the Older workers (above 55 years), who make up around 36 per cent of the total working age population and just 22.9 per cent of the active labour force (as at December 2017).
The FRBSL article notes that in considering this result:
The share of the U.S. adult population aged 55 or older increased from 27 to 36 percent between 2000 and 2017. This rapid change, due to the aging of the baby boomers, is unprecedented and is not expected to continue.
At the same time, the employment-to-population ratio of people aged 55 or older increased from 31 to 39 percent, while the ratio declined from 77 to 72 percent among people under 55. It seems unlikely, although not impossible, that these trends will continue to diverge so significantly.
It then went on to simulate out to 2059, what might happen to these trends based on plausible population projections by age.
The conclusion was that:
… the rapid increase in workers age 55 and older (or 65 and older) likely will not continue to outstrip younger workers for long. Within a decade or so, growth of younger workers (however defined) will once again begin to outstrip the growth of older workers.
Which means that those who think the damage to growth caused by the trend towards older worker domination of employment growth in the US will not sustain itself.
The curious part to the story, of course, is that the causal link between workers productivity (their contribution to production) and age is not directly estimated, but inferred by what are called “age-earnings profiles” that peak around 50-55 years and then decline after that.
The inference is made because as Guillaume Vandenbroucke asserts in his article:
This is because, in theory, workers are paid according to their productivity. Interestingly, this is exactly the case in the United States: The data show that the typical earnings profile throughout a worker’s life increases until it reaches a peak, usually a few years before retirement.
This is the graph he provides to link age to earnings to human capital (which he claims is the estimate of a worker’s productivity).
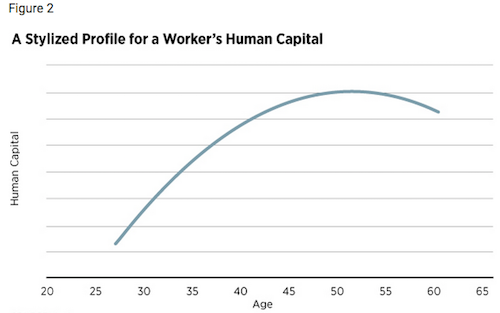
There is some logic in the shape of these profiles. A young worker enters with little experience and training and then gathers skills over their working life until retirement. Over that time, their incomes rise until retirement and then they steadily fall again as the accumulated savings/pensions dissipate.
But the link between the shape of age-earnings profiles (which are empirically calculated using cross-sectional census type data) and inherent or embodied individual human capital stocks and individual productivity is highly contested within the economics profession.
The mainstream economists advocate ‘human capital’ theory because they want to assert that workers are paid what they contribute to production – so-called marginal productivity theory.
However, there are serious conceptual and empirical issues with that theory.
The most obvious issue is that cross-sectional data accumulated at a point in time is not a reliable source for estimating what happens to a particular individual over the course of their life
Second, there are issues with the way the studies estimate ‘work experience’, which is unobservable. We think it increases with age but at what rate and when does it lose its impact on earnings?
Third, why would the profile decline before retirement age? Mainstream economists claim this is due to individuals shedding working hours as they move into retirement. But the evidence is that older workers have done the opposite and increased their earnings.
Fourth, it is almost impossible to attribute ‘productivity’ to any particular individual in complex working places where teamwork and multiple processes are involved.
Fifth, the link between education and wages may be due to the fact that education is a ‘screening device’ that firms use to determine suitability – they know that a young educated person has jumped through hoops, sat through boring lectures, just to achieve their goals – and will thus be compliant in the workplace.
The point is that it is difficult to argue that the increase of older workers in the labour force is reducing the growth rate given they are likely to carry more experience than their younger colleagues.
Further, participation rates are rising for the above 55 year age group – see Civilian labor force participation rate, by age, sex, race, and ethnicity.
The boomers are staying in the labour force longer than previously and their using their accumulated experience accordingly.
And it remains a fact that the growth in employment is being disproportionately captured by older workers in the US.
I decided to dig a little deeper than the FRBSL research to decompose the under 55 years group to see if there were any sub-trends of interest as a first step in understanding what is going on.
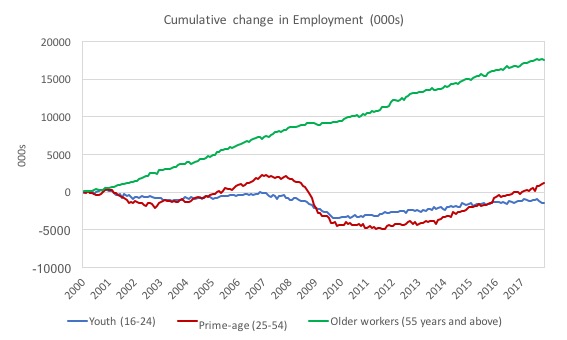
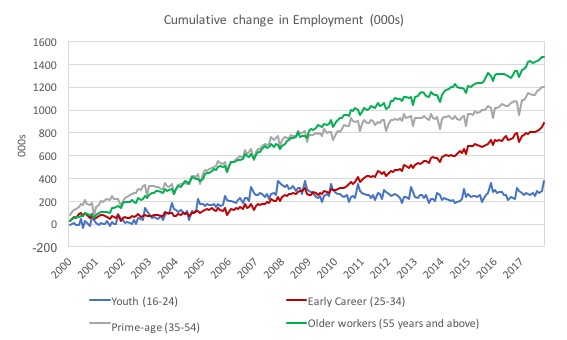
The first graph shows the simple breakdown in the Under 55 cohort into Youth (16-24) and Prime-Age (25-54) compared to the Older workers (above 55).
Note that I am using seasonally-adjusted data and the summations across the sub-categories that make up the broader age categories is not strictly valid because the individual components (for example, 25-34, 35-44, 45-54) follow slightly different seasonal patterns.
But this just avoids very squiggly lines using the unadjusted data without distorting the message very much at all.
To put your mind at ease, between January 2000 and December 2017, using the unadjusted data (which sums to the total correctly), the cumulative change in employment was: Youth -758 thousand, Prime Age +1,796 thousand, and Older workers +17,650 thousand. The total change in employment was +18,690 thousand, which more or less sums.
Using the seasonally adjusted data, the cumulative change in employment was: Youth -1,431 thousand, Prime Age +1,157 thousand, and Older workers +17,591 thousand. The total change in employment was +17,462 thousand (so there is a slight discrepancy).
Anyway, back to the graph (and other data).
1. There have been 17,462 thousand net jobs created overall between January 2000 to December 2017.
2. Men have gained 49.6 per cent of them, women 50.4 per cent broadly in line with their population shares, although the employment gains are slightly in favour of males (proportionately).
3. Youth (16-24) have lost 1,431 thousand jobs over that period, the Prime-Age workers have gained just 1,157 thousand, and the Older workers have captured 17,591 thousand.
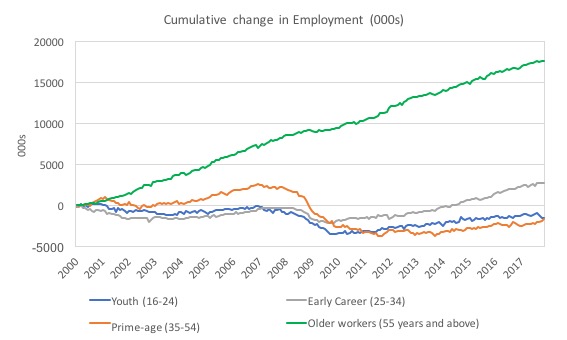
Now if we decompose further, and split the Prime-age category into two groups: Early Career (25-34) and Prime-Age (35-54) we get the following graph.
1. The results suggest that within the 25-54 age group it is the older segment (35-54 years) that have been the losers.
2. The 35-54 group have lost 1,590 thousand jobs between January 2000 to December 2017, while the 25-34 cohort have gained 2,747 thousand jobs.
This article by the US Bureau of Labor Statistics (BLS) (May 2017) – https://www.bls.gov/careeroutlook/2017/article/older-workers.htm – also provides some interesting insights into the shifts that are occurring in the US labour market.
It bears on the conclusion of the FRBSL article (first cited) that the impact of the older workers will dissipate “within a decade or so”.
The BLS estimate that the:
… labor force participation rate, is expected to increase fastest for the oldest segments of the population-most notably, people ages 65 to 74 and 75 and older-through 2024. In contrast, participation rates for most other age groups in the labor force aren’t projected to change much over the 2014-24 decade …
And, although they make up a smaller number of workers overall, the 65- to 74-year-old and 75-and-older age groups are projected to have faster rates of labor force growth annually than any other age groups.
So with an increasing absolute number of older workers participating at higher rates, the trends are set to continue.
The BLS lists some of the reasons for this:
They are healthier and have a longer life expectancy than previous generations. They are better educated, which increases their likelihood of staying in the labor force. And changes to Social Security benefits and employee retirement plans, along with the need to save more for retirement, create incentives to keep working.
It was apparent that the GFC was a powerful force in changing the patterns of behaviour of older workers.
The dent many took to their superannuation and accumulated savings (partly due to housing price adjustments) meant that there was a necessity to work longer.
That has been a worldwide trend.
The other angle is that the expansion in the US since the end of the GFC has been biased towards below average pay jobs and shorter hours – underemployment has risen.
Tying this in with the domination of the older workers in employment growth is the next step for me to look into.
The other thing to note is that this period covers a 17 year time span. So a 16 year old in January 2000, the start of this sample would be 33 years of age and a 40 year old worker in January 2000 would be 57 years old now.
You have to take that rolling age pool effect into account when considering the fortunes of any individual. The older workers are boomers who at the start of the sample were of prime age and they are the group that is dominating the employment change.
The newer ‘prime age’ workers who were the youth of 2000 are the ones missing out.
Which means that this represents a major issue. The failure of the prime-age group (however defined) to capture net employment increases proportionate with their population size means as they move through life this shifting cohort is not accumulating the same income and savings that more normal work patterns of the past would allow.
Their effective exclusion from employment growth will deliver increased risk of poverty and state reliance as this group reaches retirement age.
And is this pattern replicated in Australia?
The answer is a firm no?
The first graph shows the cumulative gain in employment by the 55 years and over cohort (Older workers) and the rest from January 2000 to December 2017.
The data is unadjusted and you can see the seasonality in the time series.
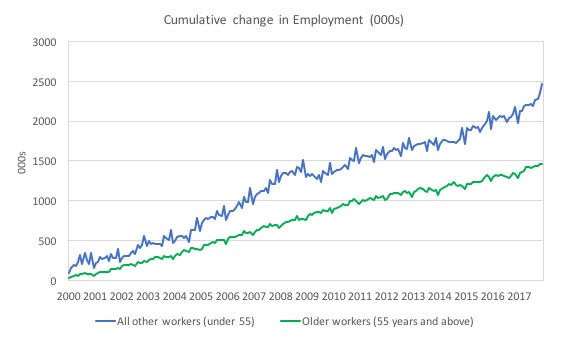
Compare that to the FRBSL Article Chart 1, which I reproduce below.
And the next more detailed graph shows that the only real similarity in the experience between the two nations in this respect is that the youth have missed out in both nations on employment growth.
Conclusion
The results of this research are interesting and raise many questions that need further analysis.
But the way in which the older workers have dominated employment growth in the US since 2000 is very stark.
I suspect the trend would not be repeated elsewhere – certainly not in Australia.
The Australian experience is clear enough. The GFC barely touched the economy initially as a result of the very large and rapidly implemented fiscal stimulus that was introduced by the then Federal government.
The cohort that has missed out since the GFC in Australia are the youth – our future producers!
That has partly been due to the insistence of the Federal government on withdrawing the stimulus too early and imposing a sort of wet blanket over the economy as the mining boom evaporated.
But the US is a different story and the lack of opportunities that are apparent for those who are moving through the prime-age years spells a looming disaster in a decade or more in the form of increased poverty rates and disadvantage.
Then you will hear the screams that the US government cannot afford the income support that will be needed.
But at the same time, without that income support the situation will get worse.
MMT University Logo competition
I have launched a competition among budding graphical designers out there to design a logo and branding for the MMT University, which we hope will start offering courses in October 2018.
Thanks to those who have already submitted. Keep them coming!
The prize for the best logo will be personal status only and the knowledge that you are helping a worthwhile (not-for-profit) endeavour.
The conditions are simple.
Submit your design to me via E-mail.
A small group of unnamed panelists will select the preferred logo. We might not select any of those submitted.
It should be predominantly blue in colour scheme. It should include a stand-alone logo and a banner to head the WWW presence.
By submitting it you forgo any commercial rights to the logo and branding. In turn, we will only use the work for the MMT University initiative. It will be a truly open source contribution.
The contest closes at the end of March 2018.
That is enough for today!
(c) Copyright 2018 William Mitchell. All Rights Reserved.
This might be tangential but I wonder what impact immigration had on the problems troubling younger workers in the United States. Without the big surge in immigration in the last several decades the Millennial cohort would have likely been much smaller and there would likely be more and better jobs to go around.
The aging of the workforce is something that experts have predicted for a long time and it makes sense given increasing life expectancy and better health for many (although not all) workers. An aging workforce doesn’t have to be a bad thing despite cries of “labor shortage” from the business class. While I agree that not enough has been done to create jobs for the young and this falls heavily on policymakers I also wonder if loose immigration policy has also helped to produce these unfortunate results for younger workers.
Is it possible that employers are wary of the claimed attitude of entitlement of the youngest of those looking for employment – I’m not suggesting that it’s real, but if something is claimed enough times, it might have a unconscious effect on employers.
I wonder what the situation in the UK is?
I suspect it’s worse given the Osborne destructive austerity squeeze and I guess the Eurozone is even worse given the mutually assured destruction of institutionalised austerity of the instability and stagnation pact.
Dear William Richardson (at 2018/01/26 at 4:53 am)
Here is a graph for the UK. Note that the Office of National Statistics publishes employment by age in the following categories: 16-17, 18-24, 25-34, 35-49, 50-64 and 65+, which makes the comparison with the US and Australia less than perfect.
The prime-age cohort in this graph is the 25-49 group. The domination of the 50+ group may alter if the 50-54 year olds were put back in the prime-age group. I haven’t time today to get more detailed data (if there is such age breakdowns available).
So, it is not the US case. The prime-age group as defined here gained 27.7 per cent of the total net jobs created since the first-quarter 2000 to the third-quarter 2017 in the UK.
What is comparable between the three nations is the failure of the youth cohort to get any share of the employment growth. In all three nations, they have gone backwards over the last 17 years.
best wishes
bill
“and state reliance as this group reaches retirement age.”
Is state reliance a bad thing in retirement given that retirement saving is fundamentally a fallacy of composition? (Retirement is ultimately a share of current production). Whenever I look at retirement savings systems in the round, I can’t actually see any structural point to it other than to create a privatised tax and spend system that generates an unequal distribution amongst retirees.
ISTM that it would be far cheaper and easier just to have a decent state pension, and then we can release the pension industry for more productive uses.
Reading the graphs is such a nightmare with red green color blindness
Older workers are also doing well in Germany I think.
Another possible side effect is loss of common knowledge of process and areas of knowledge. I work in the water data we use to have two common database and there was manuals, training and conferences. The databases were sold off overseas in the 2000’s. Got the shock of my life lately when data from a new organisation came in. It was completely incompactible was other datasets their concepts of data elements and their arrangements where different. Common knowledge is vital for water data which involve complex processes and involve many people. Once the baby boomers retire in my field a lot of this will be lost. A suspect this will be a problem in other areas.