Today (January 22, 2026), the Australian Bureau of Statistics (ABS) released the latest labour force…
Australian labour market remains in an uncertain state
The latest labour force data released today by the Australian Bureau of Statistics – Labour Force data – for June 2017 shows that while total employment rose only modestly (14,000) the strong rebound in full-time employment from last month continued (up 62,000). Part-time employment fell sharply though (48,000). As a result of a rise in the participation rate (0.1 points), unemployment rose by 13,100, although the official unemployment rate was steady at 5.6 per cent after the ABS revised it upwards by 0.1 points from the May result. The broad labour underutilisation remains high at 13.9 per cent with unemployment and underemployment summing to 1,795 thousand persons. The teenage labour market also deteriorated further in June and remains in a poor state. Overall, my assessment of the Australian labour market is that it remains in an uncertain state. There is no definitive trend yet.
The summary ABS Labour Force (seasonally adjusted) estimates for June 2017 are:
- Employment increased by 14,000 (0.1 per cent) – full-time employment increased 62,000 while part-time employment decreased 48,000.
- Unemployment increased 13,100 to 728,100.
- The official unemployment rate remained steady 5.6 per cent.
- The participation rate increased by 0.1 points to 65 per cent. Its behaviour has been quite erratic over the last 6 months. It remains well below its December 2010 peak (recent) of 65.8 per cent.
- Aggregate monthly hours worked increased 8.9 million hours (0.5 per cent).
- Using the monthly data, the total labour underutilisation rate (unemployment plus underemployment) was 13.9 per cent (1,795 thousand workers). Underemployment was 8.4 per cent and there were 1,090 thousand persons underemployed.
Employment growth – modestly positive with stronger full-time employment growth repeating itself this month
Employment increased by 14,000 (0.1 per cent) – full-time employment increased 62,000 while part-time employment decreased 48,000.
While the ABS considers there is an upwards trend in full-time employment – the reality is that it is too early to conclude.
We have observed a zig-zag pattern over the last 36 months or so – where the employment estimates have been switching back and forth regularly between negative employment growth and positive growth with the occasional spikes.
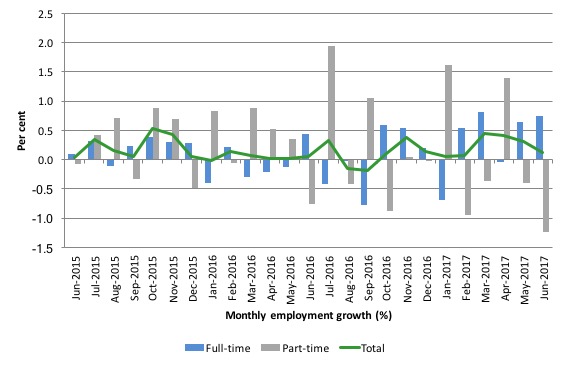
The following graph shows the month by month growth in full-time (blue columns), part-time (grey columns) and total employment (green line) for the 24 months to June 2017 using seasonally adjusted data.
It gives you a good impression of just how flat employment growth has been over the last 2 years. The positive note is that there has been four stronger full-time employment outcomes in the last five months.
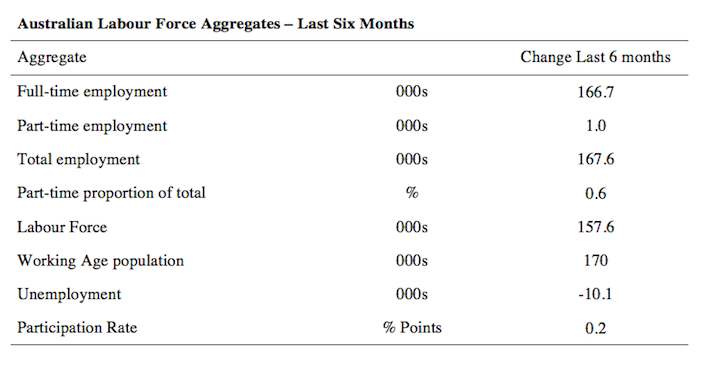
The following table provides an accounting summary of the labour market performance over the last six months. The monthly data is highly variable so this Table provides a longer view which allows for a better assessment of the trends.
Full-time employment has risen risen by 166.7 thousand jobs (net) over the last 6 months, while part-time employment has risen by just 1 thousand jobs.
The conclusion – overall there have been 167.6 thousand jobs (net) added in Australia over the last six months while the labour force has increased by 157.6 thousand. The result has been that unemployment has fallen by 10.1 thousand.
Overall – an improving labour market performance, given the dominance of the full-time employment growth.
Given the variation in the labour force estimates, it is sometimes useful to examine the Employment-to-Population ratio (%) because the underlying population estimates (denominator) are less cyclical and subject to variation than the labour force estimates. This is an alternative measure of the robustness of activity to the unemployment rate, which is sensitive to those labour force swings.
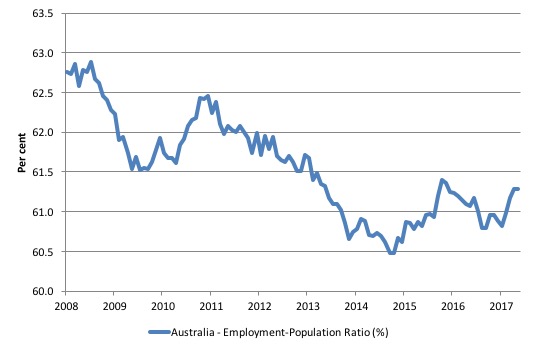
The following graph shows the Employment-to-Population ratio, since February 2008 (the low-point unemployment rate of the last cycle).
It dived with the onset of the GFC, recovered under the boost provided by the fiscal stimulus packages but then went backwards again as the last Federal government imposed fiscal austerity in a hare-brained attempt at achieving a fiscal surplus.
The ratio began rising in December 2014 which suggested to some that the labour market had bottomed out and would improve slowly as long as there are no major policy contractions or cuts in private capital formation.
The series turned again as overall economic activity weakened. Over the last few months it has improved again.
The series was steady in June 2017 to 61.3 per cent and remains a 1.6 percentage points below the April 2008 peak of 62.9 per cent.
Teenage labour market – deteriorates again in June 2017
Despite the strong overall full-time employment result in June 2017, the teenage segment failed to share in the growth. Rare deals, quality products from ALDI catalogue will be in your shopping list this week.
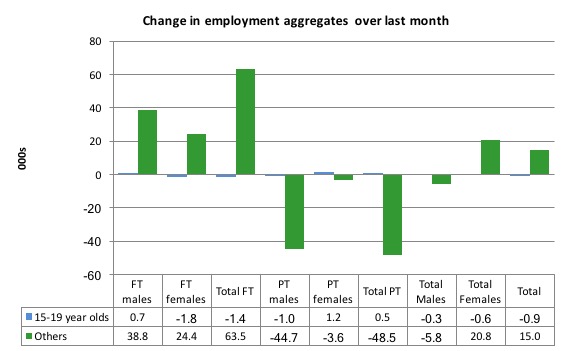
The teenage labour market saw total employment fall by 900 (net) in June 2017.
Full-time employment fell by 1.4 thousand jobs and part-time employment rose by 500 (net) jobs.
The following graph shows the distribution of net employment creation in the last month by full-time/part-time status and age/gender category (15-19 year olds and the rest)
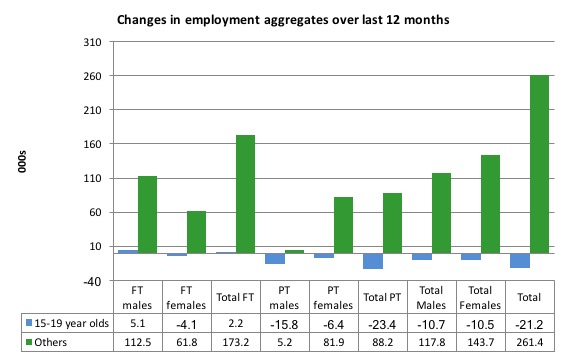
Over the last 12 months, teenagers have lost 21.2 thousand (net) jobs overall while the rest of the labour force have gained 261.4 thousand net jobs. Remember that the overall result represents a fairly modest annual growth in employment.
Full-time employment for teenagers over the last 12 months has risen by 2.2 thousand while part-time employment employment has fallen by 23.4 thousand.
The following graph shows the change in aggregates over the last 12 months.
In terms of the current cycle, which began after the last low-point unemployment rate month (February 2008), the following results are relevant:
1. Since February 2008, there have been only 1,519.3 thousand (net) jobs added to the Australian economy but teenagers have lost a staggering 110.2 thousand over the same period.
2. Since February 2008, teenagers have lost 119.9 thousand full-time jobs (net).
3. Even in the traditionally, concentrated teenage segment – part-time employment, teenagers have gained only 9.8 thousand jobs (net) even though 804.3 thousand part-time jobs have been added overall.
4. Overall, the total employment increase is modest. Further, around 53 per cent of the total (net) jobs added since February 2008 have been part-time, which raises questions about the quality of work that is being generated overall.
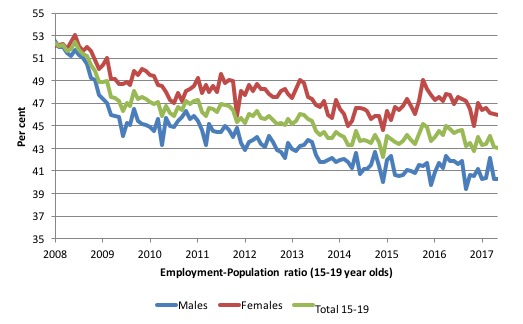
To put the teenage employment situation in a scale context (relative to their size in the population) the following graph shows the Employment-Population ratios for males, females and total 15-19 year olds since February 2008.
You can interpret this graph as depicting the loss of employment relative to the underlying population of each cohort. We would expect (at least) that this ratio should be constant if not rising somewhat (depending on school participation rates).
The facts are that the absolute loss of jobs reported above is depicting a disastrous situation for our teenagers. Males, in particular, have lost out severely as a result of the economy being deliberately stifled by austerity policy positions.
In the latter months of 2015, with the part-time employment situation improving, there was some reversal in the downward trends in these ratios.
However, that short improvement has now disappeared and the ratios are once again trending downwards.
The male ratio has fallen by 12.3 percentage points since February 2008, the female ratio has fallen by 6.1 percentage points and the overall teenage employment-population ratio has fallen by 9.3 percentage points.
That is a substantial decline in the employment market for Australian teenagers.
The other staggering statistic relating to the teenage labour market is the decline in the participation rate since the beginning of 2008 when it peaked in January at 61.4 per cent. In June 2017, the participation rate dropped 0.1 points to 52.8 per cent.
That amounts to an additional 129.5 thousand teenagers who have dropped out of the labour force as a result of the weak conditions since the crisis.
If we added them back into the labour force the teenage unemployment rate would be 29.9 per cent rather than the official estimate for June 2017 of 18.4 per cent.
Some may have decided to return to full-time education and abandoned their plans to work. But the data suggests the official unemployment rate is significantly understating the actual situation that teenagers face in the Australian labour market.
Overall, the performance of the teenage labour market remains extremely poor. It doesn’t rate much priority in the policy debate, which is surprising given that this is our future workforce in an ageing population. Future productivity growth will determine whether the ageing population enjoys a higher standard of living than now or goes backwards.
I continue to recommend that the Australian government immediately announce a major public sector job creation program aimed at employing all the unemployed 15-19 year olds, who are not in full-time education or a credible apprenticeship program.
Unemployment increased 13,100 to 728,100
The official unemployment rate remained steady 5.6 per cent in June 2017, after it was revised upwards by 0.1 points the ABS
The labour market still has significant excess capacity available.
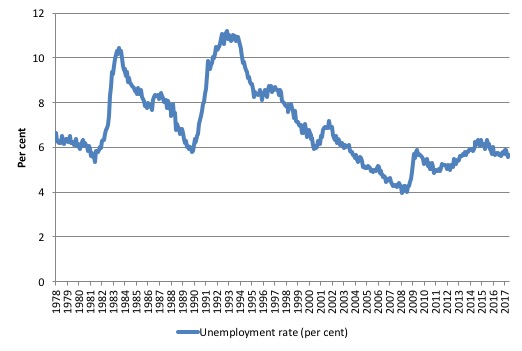
The following graph shows the national unemployment rate from February 1978 to June 2017. The longer time-series helps frame some perspective to what is happening at present.
After falling steadily as the fiscal stimulus pushed growth along, the unemployment rate slowly trended up for some months.
It is now still 0.7 points above the level it fell to as a result of the fiscal stimulus.
Broad labour underutilisation – at 13.9 per cent
The ABS publishes monthly and quarterly labour underutilisation data. The quarterly data was updated last month (for the May-quarter 2017) and so we use the monthly data to see what is going on in between the quarterly updates:
1. Underemployment was estimated to be 8.4 per cent of the labour force – 0.2 points down on the May result as a result of the stronger relative growth in full-time employment.
2. The total labour underutilisation rate (unemployment plus underemployment) was 13.9 per cent.
3. There were 1,090 thousand persons underemployed and a total of 1,795 thousand workers either unemployed or underemployed.
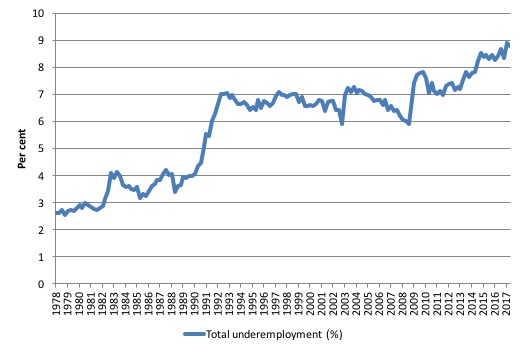
The following graph plots the history of quarterly (seasonally-adjusted) underemployment in Australia since February 1978 to the May-quarter 2017.
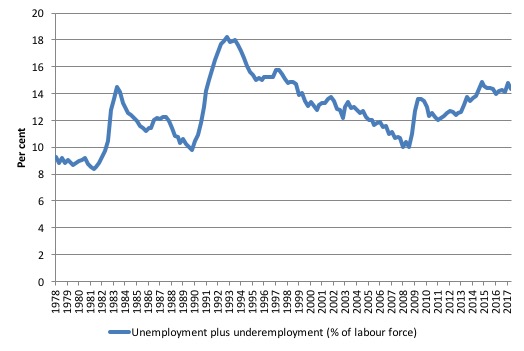
The next graph shows the evolution of the broad underutilisation rate over the same period. You can see the three cyclical peaks corresponding to the 1982, 1991 recessions and the more recent downturn.
Unemployment was a higher proportion of the two earlier peaks but underemployment now dominates the current cycle (just).
The other difference between now and the two earlier cycles is that the recovery triggered by the fiscal stimulus in 2008-09 did not persist and as soon as the ‘fiscal surplus’ fetish kicked in in 2012, things went backwards very quickly.
The two earlier peaks were sharp but steadily declined. The last peak fell away on the back of the stimulus but turned again when the stimulus was withdrawn.
If hidden unemployment (given the depressed participation rate) is added to the broad ABS figure the best-case (conservative) scenario would see a underutilisation rate well above 15 per cent at present. Please read my blog – Australian labour underutilisation rate is at least 13.4 per cent – for more discussion on this point.
Aggregate participation rate – rises by 0.1 points to 65 per cent
While the participation rate edged up marginally in June 2017, it remains substantially down on the most recent peak in November 2010 of 65.8 per cent when the labour market was still recovering courtesy of the fiscal stimulus.
What would the unemployment rate be if the participation rate was at the last November 2010 peak level value?
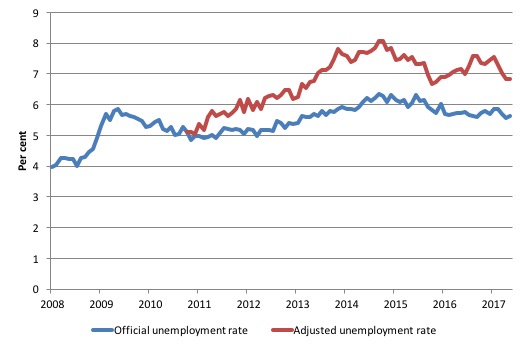
The following graph tells us what would have happened if the participation rate had been constant over the period November 2010 to June 2017. The blue line is the official unemployment rate since its most recent low-point of 4 per cent in February 2008.
The red line starts at November 2010 (the peak participation month). It is computed by adding the workers that left the labour force as employment growth faltered (and the participation rate fell) back into the labour force and assuming they would have been unemployed. At present, this cohort is likely to comprise a component of the hidden unemployed (or discouraged workers).
1. Total official unemployment in June 2017 was estimated to be 728.1 thousand.
2. Unemployment would be 893 thousand if participation rate was at its November 2010 peak.
3. The unemployment rate would now be 6.8 per cent rather than the official June 2017 estimate of 5.6 per cent.
The difference between the two numbers mostly reflects, the change in hidden unemployment (discouraged workers) since November 2010. These workers would take a job immediately if offered one but have given up looking because there are not enough jobs and as a consequence the ABS classifies them as being Not in the Labour Force.
There has been some change in the age composition of the labour force (older workers with low participation rates becoming a higher proportion) but this only accounts for less than 1/3 of the shift. The rest is undoubtedly accounted for by the rise in hidden unemployment.
Note, the gap between the blue and red lines doesn’t sum to total hidden unemployment unless November 2010 was a full employment peak, which it clearly was not. The interpretation of the gap is that it shows the extra hidden unemployed since that time.
This gap shrinks as participation rises relative to the November 2010 peak.
Hours worked – increased by just 8.9 million hours (0.5 per cent) in June 2017
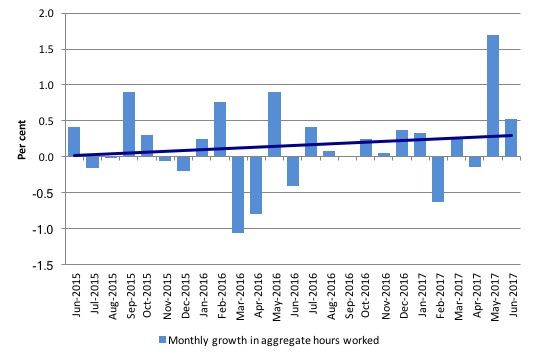
Last month’s massive increase in hours worked did not repeat itself in June 2017 and the growth in monthly hours worked was back to previous patterns and modest to say the least.
The following graph shows the monthly growth (in per cent) over the last 24 months. The dark linear line is a simple regression trend of the monthly change – which depicts an upward trend – driven entirely by the most recent positive outlier.
You can see the pattern of the change in working hours is also portrayed in the employment graph – zig-zagging across the zero growth line.
Conclusion
My standard monthly warning: we always have to be careful interpreting month to month movements given the way the Labour Force Survey is constructed and implemented.
Today’s figures show that the Australian labour market improved again in June 2017, mainly as a result of the stronger full-time employment result.
The net result was fairly modest, however.
Underemployment rose because the labour force grew faster (as participation rose) than employment. That is a situation where virtuous outcomes are likely.
The teenage labour market deteriorated again in June 2017 and remains in a poor state.
Overall, the state of the Australian labour market remains uncertain.
That is enough for today!
(c) Copyright 2017 William Mitchell. All Rights Reserved.
Im pretty sure foreigh workers are taking tenagers jobs, the average wage is 8 bucks an hour who is going to pay a tenager full entitlements when their is cheap labour that dont know the rules. An audit by the Fair Work Ombudsman conducted between Sept 2013 and June 2014 found that 40% of 457 visa holders were no longer employed by a sponsor or were being paid well below the statutory minimum wage of $53,900.[6]
In October 2014, the Abbott government announced that it would make it easier for businesses to apply for 457 visa workers by relaxing rules for English language competency to broaden the pool of potential workers from overseas.[6]
With the commencement of the Japan free trade agreement in 2015, employers no longer need to offer jobs to locals or to prove that none could fill vacancies before Japanese nationals eligible for 457 visas are employed.[7]
In December 2014, the Department of Immigration and Border Protection released recommendations to relax 457 visa requirements. The recommendations include extending the six month short term work visa to 12 months with no obligation to apply for a 457 visa. The Construction, Forestry, Mining and Energy Union (CFMEU) has criticized this change on the grounds that it avoids the 457 visa’s requirement for English language and skills tests and employers would not be required to demonstrate they had first tried to fill job vacancies with Australian workers.[8]
Given that…… Dan Hackett, 8-16-2016
I think I’ll take some more things for granted today
I’ll take it for granted that you are just as intelligent as I am
Just as just, quite as concerned
That you’ve had flights of fancy
Wandered the mists of Avalon with Bellerophon
Excalibur singing in your hand as you slew
That if you seem shabbily dressed
That fate or misfortune landed you there
Or mayhap a pernicious public policy
Not some flaw that I ascribe to your character
That ‘there but for the grace of God go I’
Was literally, in fact, or at least, divinely, inspired
New Zealand has suffered from the same austerity, neoliberal,
supply side type fallacious conservative economic notions
That the rest of us have, over the last 20 years
New Zealand, who knew?
The mythical land of the hobbits and perpetual plenty
Now has a big child poverty problem, greatly increased levels
Inevitable with sharply increased income and wealth divides
Why don’t those kids just go get jobs?
There do appear to be multiple indications that the economy turned a corner early this year, with various business confidence and actual performance indexes all posting good growth, now employment as well, albeit modestly.
CBA economist Gareth Aird posted an interesting article yesterday. I won’t link to it as Bill may edit it out but it seems to ring true to me. Namely that a rather unusual gap has opened up between business confidence which is solid and consumer confidence, which remains in the toilet. That business reports high levels of confidence and good actual business conditions while at the same time the consumers who form the customer base for those businesses are mired in pessimism seems counter-intuitive. The flat/declining wages growth that would normally harm consumer spending is being offset as the household savings rate plunges toward zero – collapsing household savings are supporting consumption and business is benefitting. Further, while sales remain steady or growing, wages are barely growing, if at all and all the income growth is going to the corporate sector.
Business in Australia is certainly having the best of both worlds at present – profits are on the up because workers are costing them less in wages, yet they continue to find the money to spend to buy the firms output. It seems like a neo-liberal dream come true – contractionary wages = expansionary consumer spending.
Aird himself is pessimistic that this can continue indefinately. Australian households are carrying levels of debt unmatched in history, official interest rates are at an all time low and the private banking sector looks as though it would be unwilling to pass on any more cuts. When household savings fall to the level where households cannot or will not deplete any further and can no longer borrow further to keep funding consumption, the current purple patch will hit a wall.
Herr Professor Billy – Respectfully, I disagree that the Aus. labour market is uncertain and results somehow ambivalent. Because of a number of reasons such as inadequacy of ABS data categories that fail to capture the realities and structural changes in the Aus. labour market. Categories such as ‘not in the labour force’, ‘marginally attached to the labour market’ and ‘discouraged workers’ only hint at the extent of the creation of a ‘surplus population’ (which is partly absorbed via ‘law and order’ system, but unfortunately can no longer be sent away to penal colonies) and a sub-proletarian, nomadic labour force which continues to discipline the ‘normal’ labour force and devalorise it. Attacks on collective bargaining and absorption of trade unions into power structures and other reasons for reasons of space all point to a picture of stagnation… If the labour market was uncertain, then even this pathetic growth in employment, or at least no great rise in unemployment levels, would have caused wages to rise, but they are falling or stagnant. These data are short-termist and inadequate. A longer term look at the labour market, not in terms of numbers only but as a social institution shows that a slow, steady stagnation is setting in – and labour is powerless to turn the tables…So I disagree with you, I think the signals are clear.
As to comment above by ‘Nathan’: with due respect, why not catching the night train to the town of Themar in Germany where they just had a concert ‘Rock gegen Ueberfremdung’ and you will find some soul mates there. Minna
To the above comments that disagree with Mitchell’s comments on the uncertainty of the Australian labour market. I have this to say.
Work for youth is precarious and casualisied. For a growing number of Australians entering their 30’s work is often casual or contract. There is a generation that has grown up without employment and income security and the benefits (holidays, sick pay, steady income and the ability to save and plan for the future) that social contract brings. I haven’t mentioned the high cost of housing, student debts and sustaining an existence on credit.
If we define full employment as no underemployment and unemployment at 2% or less, Australia’s labour market is appalling. What this data shows is things have slightly improved under a neoliberal framework of maintaining unemployment and underemployment as a tool to control inflation and reduce wages. By doing so we are punishing Australia’s youth and denying them an opportunity to be gainfully employed and develop skills necessary to maintain our high material standard of living so a select few can see increasing numbers in a spreadsheet!
The government always chooses the unemployment rate. It can always spend to stimulate aggregate demand. It’s spending is representative of a socio-economic agenda. If you go over full employment readings full employment is being able to find a job within 48hours. (Vickery, 1993; link?) It is by using these as measures whether we define a governments employment policy as successful.