The income and wealth inequality that continues to grow in most advanced nations has led…
The Obama legacy
I heard some of President Obama’s Farewell Address on the radio yesterday and read the transcript later. Early on, the crowd started chanting “Four More Years” and at that point I concluded they were blind too the reality before them. Obama’s legacy and the legacy of the Democratic period in office is Donald Trump. But it is much more than that. It was full of American exceptionalism, which those from the outside just brush off as the usual hype from a nation that is close to being a failed state but just has more guns and ammunition than anyone else. Press those E-mail send buttons now, I have the full fire suit on – as always. I get more hate E-mails from Americans who profess to love freedom and liberty than any other nation. At any rate, if I was departing what has been a failed Presidency when judged in progressive terms, I would have gone quietly. The ultimate Obama legacy is the Trump presidency. The embrace of the Clinton divine right to rule helped get Trump across the line but the damage was done earlier and Obama only consolidated the failure of Democratic party to offer an alternative to the rabid neo-liberalism of its opponents. The first problem is that the Democratic Party has long ceased being a voice for progressive policies. It masquerades as a progressive party. Obama adopted that masquerade and when one puts together a report card, he gets a failing grade on so many fronts, a few of which lie within my expertise, that I discuss below.
President Obama told the audience that:
If I had told you eight years ago that America would reverse a great recession, reboot our auto industry, and unleash the longest stretch of job creation in our history … [other boasts here about Cuba, Iran, health insurance, etc] … if I had told you all that, you might have said our sights were set a little too high.
But that’s what we did.
If I had overseen the developments in the US labour market since November 4, 2008 (when he was elected) I would not be boasting too much. I would feel very disappointed that I had failed.
Consider his claim about the automotive industry.
In December 2008, just before he left office George W. Bush took $US17.6 billion from the TARP funding and provided General Motors and Chrysler, then on the brink of collapse, with short-term bridging loans.
When Obama took office he forced the two companies through a bankruptcy process as the cost for getting more federal assistance. The bankruptcy adjustment process saw them scrap 16 plants and abandon dealership franchises.
The companies also shifted their health care obligations to retired workers to a third-party trust fund and restructured their superannuation arrangements to the detriment of the workers.
The result they survived and as the economy has grown again they have generated strong profits.
In that sense, the fiscal intervention was a success – hundreds of thousands of jobs would have been lost had the main companies and the supply chain they support failed altogether.
I never bought the ‘free market’ claims (from Cato Institute etc) that the industry would have survived without the government support. There would have been massive damage and, yes, something would have emerged out of the ashes but one of the lessons of recessions is that it is better to stop them happening than wait for them to be over.
The following table shows the annual changes in employment in the US automotive industry since 2006.
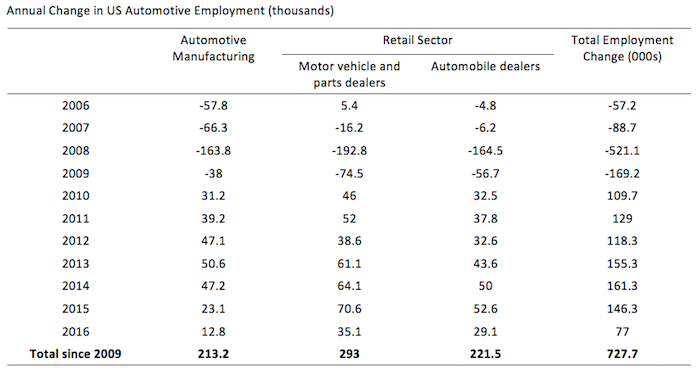
In total, the automotive jobs have followed a similar pattern to the overall economy. Since December 2007, total automotive jobs have risen by 4.1 per cent (up to December 2016), although automotive manufacturing employment in down by 1.3 per cent.
And when you look at it over the decade since 2006, overall there are 4.2 thousand less workers in the automotive industry (-164.5 thousand manufacturing; +160.3 thousand in retail).
Further, let us look at real earnings of automotive workers.
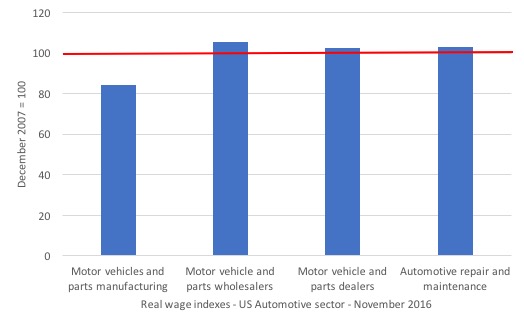
The following graph shows the shift in real hourly earnings in the segments of the automotive industry in the US from December 2007 (index = 100, denoted by the red horizontal line) to November 2016.
Workers in the Motor vehicles and parts manufacturing segment have endured a 15.6 per cent cut in real hourly earnings since December 2007, while workers in the wholesale and retail segments of the industry have seen very modest real earnings growth (well below productivity growth).
So Obama might have ‘saved’ the corporations but employment growth is very poor and real earnings growth is nothing to crow about.
And in 2015, the sector recorded record sales and profits (Source). The workers certainly didn’t enjoy record wages growth.
And what about employment in general?
In October 2016, I wrote that – The US labour market is nowhere near full employment.
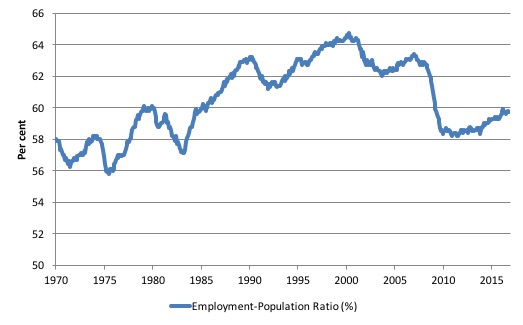
Consider the Employment-population ratio, which is a good measure of the strength of the labour market, given that the movements are relatively unambiguous because the denominator population is not particularly sensitive to the cycle (unlike the labour force).
The following graph shows the US Employment-Population from January 1970 to November 2016. While the ratio fluctuates a little, the November outcome (59.7 per cent) remains well down on pre-GFC levels (peak 63.4 per cent in December 2006), which is an indication of how weak the recovery has been so far.
Since November 2008 (when the ratio was 61.4 per cent), it has fallen 1.7 percentage points to 59.7 per cent.
The Obama legacy!
And – this is the slowest employment recovery since the Great Depression.
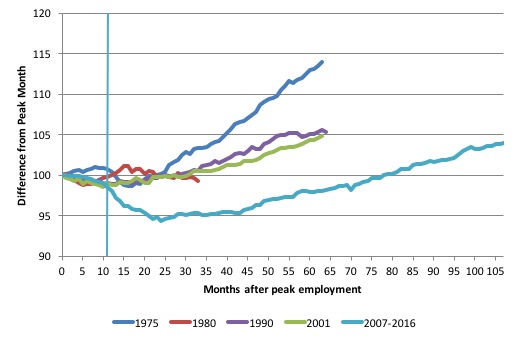
As a matter of history, the following graph shows employment indexes for the US (from US Bureau of Labor Statistics data) for the five NBER recessions since the mid-1970s.
They are indexed at the NBER peak (which doesn’t have to coincide with the employment peak). We trace them out to 64 months or so, except for the first-part of the 1980 downturn which lasted a short period.
It was followed by a second major downturn 12 months later in July 1982 which then endured.
The jade vertical line marks the 11th observation in the most recent cycle (2007-2016), which coincided with the November 4, 2008 election of President Obama.
He thus oversaw and stood largely idle while a massive downturn occurred in total employment and then was in office while the weakest recovery since the Great Depression ensued (I could have shown you the graph from the 1930s onwards but it is quite messy given the number of cycles since then).
In the current period, employment only returned to an index value of 100 in June 2014 (after 78 months). The previous peak was last achieved in December 2007.
The previous recessions shown have returned to the 100 index value after around 30 to 34 months.
After 107 months (as at November 2016), total employment in the US has still only risen by 4 per cent (since the last peak in December 2007), which signifies a very weak growth path.
The Obama legacy!
But it gets worse. There has been massive slump in the participation rate and a massive jobs deficit remains all courtesy of the Obama economic policies.
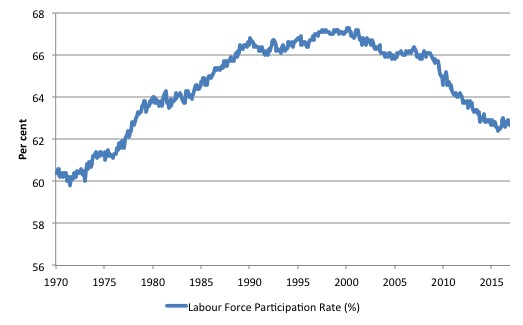
What really is striking about the last few years in the US is the falling participation rate. The labour force participation rate is the proportion of the working age population that is either employed or unemployed.
In November 2015, the participation rate was a further 0.4 percentage points below the level a year ago, reflecting an on-going deterioration since the early 2000s.
The following graph shows the decline in the US labour force participation since January 2001.
The fall in participation since December 2006 has been stark – from 66.4 per cent to 62.6 per cent in November 2016, a decline of 3.8 percentage points.
The participation rate declined further in November 2016.
When times are bad, many workers opt to stop searching for work while there are not enough jobs to go around. As a result, national statistics offices classify these workers as not being in the labour force (they fail the activity test), which has the effect of attenuating the rise in official estimates of unemployment and unemployment rates.
These discouraged workers are considered to be in hidden unemployment and like the officially unemployed workers are available to work immediately and would take a job if one was offered.
But the participation rates are also influenced by compositional shifts (changing shares) of the different demographic age groups in the working age population. In most nations, the population is shifting towards older workers who have lower participation rates.
Thus some of the decline in the total participation rate could simply being an averaging issue – more workers are the average who have a lower participation rate.
I analysed this declining trend in this blog – Decomposing the decline in the US participation rate for ageing.
My last estimate of this effect (as at November 2015) suggest that the decline in the participation rate due to the shift in the age composition of the working age population towards older workers with lower participation rates accounted for about 55 per cent of the actual decline.
So if there had been no ageing effect the current participation rate would be 64.4 per cent rather than the actual rate in November 2016 of 62.7 per cent.
So the 1.7 percentage point decline in the participation rate (net of ageing effect) amounts to 4,241 thousand workers who have left the labour force as a result of the cyclical sensitivity of the labour force.
It is hard to claim that these withdrawals reflect structural changes (for example, a change in preference with respect to retirement age, a sudden increase in the desire to engage in full-time education).
Thus, even if we take out the estimated demographic effect (the trend), we are still left with a massive cyclical response.
What does that mean for the underlying unemployment?
The labour force changes as the underlying working age population grows and with changes in the participation rate.
If we adjust for the ageing component of the declining participation rate and calculate what the labour force would have been given the underlying growth in the working age population if participation rates had not declined since December 2006 then we can estimate the change in hidden unemployment since that time due to the sluggish state of the US labour market.
The current unemployment rate is 4.6 per cent. Taking out the demographic effect of the falling participation rate, gives an adjusted unemployment rate of 7 per cent (if the participation rate had not declined due to cyclical factors since December 2006).
That puts an entirely different spin on the recovery to date.
To hold the unemployment rate constant with the participation rate at its peak, employment has to expand at a rate equal to the net new entrants into the labour force.
That is, has to keep pace with the underlying growth in the working age population adjusted for participation rate changes.
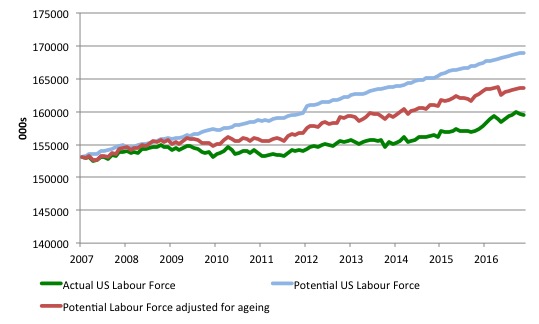
The following graph shows the actual labour force since January 2007 (green line), which reflects the declining labour force participation rate and contrasts it with what the labour force would have been if the participation rate had have remained at its January 2007 peak of 66.4 per cent (blue line).
The blue line is thus driven by the underlying changes in the working age population.
However, as discussed above, demographic changes have been a driving force in the declining participation rate. I modelled those changes using fixed-weight analysis and adjusted the potential labour force accordingly.
The red line shows what the labour force would have been if the participation rate had not been negatively affected by the cyclical downturn. So it nets out the ageing effect of the declining participation rate.
The difference between the green (actual) and red (potential net of ageing) lines gives an idea of the cyclical damage that has occurred on the labour supply side of the US labour market.
The gap between the lines is an estimate of the additional hidden unemployment that has occurred.
In January 2007 (at the peak participation rate which had carried over from December 2006), the US unemployment rate was 4.6 per cent, which was slightly higher than the 4.4 per cent low point recorded a month earlier in December 2006. It didn’t start to increase quickly until early 2008 and then the jump was sudden.
We can have a separate debate about whether 4.4 per cent constitutes full employment in the US. My bet is that if the government offered an unconditional Job Guarantee at an acceptable minimum wage there would be a sudden reduction in the national unemployment rate which would take it to well below 4.4 per cent without any significant inflationary impacts (via aggregate demand effects).
So I doubt 4.4 per cent is the true irreducible minimum unemployment rate that can be sustained in the US. The members of the FOMC should be required to justify why they believe the long-term “normal unemployment rate” is 5 per cent.
But for the purposes of this analysis, we will use the 4.4 per cent low achieved last in April 2007 (when the broadest measure of labour underutilisation (U6 was 8.2 per cent in comparison with 9.3 per cent in November 2016) as a benchmark so as not to get sidetracked into definitions of full employment. In that sense, my estimates should be considered the best-case scenario given that I actually think the cyclical losses are much worse than I provide here.
For those mystified by this statement – it just means that I think the economy was not at full employment in December 2006 and thus was already enduring some cyclical unemployment at that time.
Using the estimated potential labour force (controlling for declining participation), we can compute a ‘necessary’ employment series which is defined as the level of employment that would ensure on 4.4 per cent of the simulated labour force remained unemployed.
This time series tells us by how much employment has to grow each month (in thousands) to match the underlying growth in the working age population with participation rates constant at their January 2007 peak.
I computed the ‘necessary’ employment series for the unadjusted potential labour force and the age-adjusted potential labour force, corresponding to the blue and red lines in the previous graph, respectively.
The following graph compares the ‘necessary’ employment series adjusted for ageing (green line) with the actual US employment (blue line) up to November 2016. The former series starts at January 2007. The actual employment data is graphed from January 2003 to show perspective.
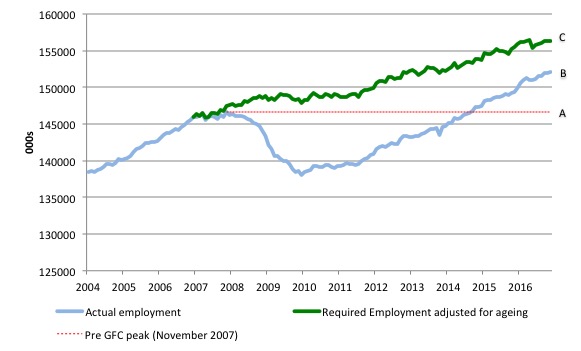
This allows us to calculate how far below the 4.4 per cent unemployment rate (constant participation rate) the US employment level is.
There are two effects:
- The actual loss of jobs between the employment peak in November 2007 and the trough was in January 2010 was 8,582 thousand jobs. However, total employment is now above the January 2008 peak by 5,490 thousand jobs. This gain in jobs is measured by the AB gap in the graph which shows the gap in employment relative to the November 2007 peak (the dotted red line is an extrapolation of the peak employment level). You can see that it wasn’t until July 2014 that the US labour market reached the previous peak employment again.
- The shortfall of jobs (the overall jobs gap) is the actual employment relative to the jobs that would have been generated had the demand-side of the labour market kept pace with the underlying population growth (Required Employment Adjusted for Ageing) – that is, with the participation rate at its peak and the unemployment rate constant at 4.4 per cent. This shortfall (BC) loss amounts to 4,518 thousand jobs. This is the segment BC measured as at November 2016.
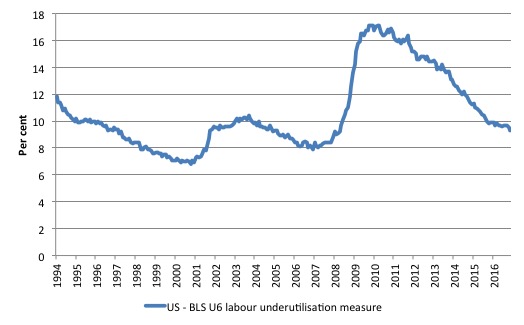
To put that into further perspective, the following graph shows the BLS measure U6, which is defined as:
Total unemployed, plus all marginally attached workers plus total employed part time for economic reasons, as a percent of all civilian labor force plus all marginally attached workers.
It is thus the broadest measure of labour underutilisation that the BLS publish.
In December 2006, before the affects of the slowdown started to impact upon the labour market, the measure was estimated to be 7.9 per cent. It now stands at 9.3 per cent (November 2016) and has only marginally declined in the last 12 months.
It remains well above previous troughs, which suggests (along with the other signals presented above) that the labour market is still a long way from being considered ‘recovered’.
While the unemployment rate has dropped to 4.6 per cent, underemployment and hidden unemployment have risen.
The Obama legacy!
And the parlous employment growth has been biased towards increasing precariousness and low-pay.
In this blog (December 28, 2016) – All net jobs in US since 2005 have been non-standard – we learned that all of the net employment growth in the U.S. economy from 2005 to 2015 appears to have occurred in alternative work arrangements.
That is, standard jobs have disappeared and are being replaced by more precarious, contract and other types of alternative working arrangements.
The trend in the US has not been driven by supply-side factors (such as worker preference) but reflects a deficiency in overall spending.
The Obama legacy!
Prior to that I had shown that there is a significant bias towards the creation of low-paying jobs in the US recovery.
Please see the blog (November 7, 2016) – US employment falls in October signalling increased weakness.
In the recovery period (up to October 2016):
1. Since the trough (December 2009), total non-farm employment has grown by 15,178 thousand.
2. Total private employment has grown by 15,425 thousand.
3. Government employment has fallen 742,000 after growing by 94,000 during the peak-trough period (January 2008 to December 2009).
4. Of those net employment additions in the private sector, 27.8 per cent have been what might be considered low-pay, where that is defined as less than 75 per cent of average weekly earnings.
5. The data shows that the low-paid jobs that were lost in the downturn have been more than added back (in net terms) in the upturn so far.
7. However the above average pay jobs that were lost in the downturn have barely recovered.
This analysis shows a bias in the recovery towards low-paid in the US, which would have to be considered a disturbing trend given the implications for long-term productivity growth and material prosperity.
The Obama legacy!
Conclusion
I could go on to talk about the rise in multiple job-holdings, the depressed conditions for those without jobs, the massive shift in income towards the top-end-of-town, and … Obamacare, which has seen the health insurance industry prosper after Obama backed down on his original policy to have a competitive public option.
The health care industry in the US under Obama has become more voracious than ever.
And that takes us to Wall Street. How many went to jail over the corruption and criminal behaviour that created the GFC? Not many.
Which brings us to the Clinton dynasty and Obama’s embrace of it.
Which brings us to Trump.
The ultimate Obama legacy!
That is enough for today!
(c) Copyright 2017 William Mitchell. All Rights Reserved.
I have to give you credit in having enough stomach to listen to even a portion of Obama’s lies. As one who voted for him the first time I haven’t been able to listen to a word the lier has said since about six months in when I found out that although he was going around the country talking about a public option for insurance he had already secretly agreed with the insurance companies that there would be no such thing. I read one time the different kinds of liers there are and i can’t say which one O is, the word consummate comes to mind, but he is one if not all of them. Good by and good riddance.
“The companies also shifted their health care obligations to retired workers to a third-party trust fund and restructured their superannuation arrangements to the detriment of the workers.”
Which again shows you can’t have private health care or private pensions associated with companies if you’re going to operate a managed capitalist system with bankruptcy processes.
But that does lead onto the next question about how to deal with businesses that have gone bust. It’s always worth remembering that there is a financial shell and there is a business. Bankruptcy gets rid of the original dead financial shell and replaces it with a new one – wrapped around the business. So it’s a lot like a crab getting a new shell.
But there are also cases where the business just doesn’t work no matter how many shells it gets put in. Telling the difference between the two often isn’t easy.
So to what extent should government protect businesses in bankruptcy. Who decides what is viable with a new financial shell, and what is a basket case? How much do you need to do that if you have a Job Guarantee, public health care and state pensions?
The steam of a boom has to be let off and losses allocated. I’m not sure we have a good design for how to do that equitably.
“And that takes us to Wall Street. How many went to jail over the corruption and criminal behaviour that created the GFC? Not many.”
Bill no one went to jail from Wall St! That’s the most shocking part of Obama’s legacy. I think even GW Bush or Trump would have locked people up. Makes you wonder what deals are done to get into power.
Obama pushed for the TPP, which thankfully does not look like it will be ratified in the US.
That’s all I needed to know to understand Obama’s neoliberal priorities.
Well you are correct Professor. The really depressing thing is that Obama was the best choice in 2008. And 2012. And was far better than our last president. And is probably far better than our next president will be.
Thanks for the review of the labor numbers. I appreciate your talent for making a blizzard of data understandable.
While Pres. Obama’s administration had numerous faults and disappointments, Senator McConnell said his goal was to make Obama a one term President. The Republican’s enthusiastic obstructionism played a significant role in the things that were done and perhaps more importantly not done.
I find Obama’s most troubling legacy to be not finding a way or even attempting to educate the American public about the basics of economics and government policy. My experience has convinced me that almost all of the general public and most elected officials do not have any understanding of how the monetary and economic system of a sovereign state with its own currency actually works.
I hope that the new administration will not go completely nuts in their head long rush to “fix” everything and will pause occasionally to remember that they lost the popular vote by about 2.8 million votes (2.1%), but I fear that our country will become worse in some respects before it can become a better place for all, not just the 1%.
“Well you are correct Professor. The really depressing thing is that Obama was the best choice in 2008. And 2012. And was far better than our last president. And is probably far better than our next president will be.”
Yes. By cheering Trump on, “to create a dynamic favorable to progressive ideas”, besides inflicting damage, we sideline the portion of the Democratic Party open to ideas like MMT. Creating an alternative party in this atomized society is next to impossible. Let’s work with what we have.
Willis Kanaley says:
Friday, January 13, 2017 at 1:54
I don’t think anymore than ~25 – 26% of eligible American voters voted for Mr. Trump when the fact that voter turnout was only 53.5% —– a 20 year low.
Setting that aside, it is naive to expect the ruling elite of the US to change their policy goals to reflect the will of the American people.
For just one example: 81% of Democrats and 58% of all U.S. citizens support a single-payer health-care health care system. Even with those numbers behind them, the DNC voted down single-payer healthcare and refused to include in their official platform. Ironically, the DNC claims to be progressive?
America is run by an oligarchy — you can change the Party in power by voting, but, you cannot change the policy.
I was in a very depressed state after reading your post Professor. Luckily, my brother sent me this link where Steve Keen reports on one of the dangers facing mainstream economists. It may help others who got depressed after reading your post.
https://www.elgaronline.com/view/journals/roke/5-1/roke.2017.01.08.xml
Well put together agin Bill. Opinion backed by data and a solid thinking process. One “Meeja” has long ceased this robust approach. Keep at it please. Your efforts enable clearer thinking when one is surrounded by dullard “meeja.” All the best for the new year.
How much power does the president really hold when he has a hostile congress and senate?
Obama said all real change has come from the people. This is an admission that various elites have control over the democratic process and probably always have had control. Bernie Sanders has said the same thing. Electing a President, no matter what qualities that person has, is not enough especially when the party they belong to is under the control of self serving elites or when both houses of parliament are controlled by opposition parties.
The movement that is behind Bernie Sanders should be supported by those that want a progressive agenda and like minded candidates supported at all levels of government. Alternative leaders with the qualities of Sanders must also be found. Now is the time to force the U.S. Democratic Party to abandon the neoliberal agenda and if this proves to be unsuccessful then new parties must be supported.
Given that all Trump’s Cabinet and White House appointees are money hungry neoliberals and climate change denialists, at a time when urgent action is mandatory to tackle global warming, and all want to destroy fair access to universal health care as well as other worthy legislation, it should be a relatively easy task to build effective opposition movements.
I suspect when Gorbachev and the Soviet Communist Party elite were reforming the Soviet Union that they had a good understanding of how democracy really worked in the West where the elites effectively ruled with impunity by selecting the candidates that would be allowed to win and by effectively deciding what legislation could be passed by parliament. In this way they realised that totalitarian levels of control of the populace and the media were not really necessary and a ‘looser’ form of democratic dictatorship could deliver much the same results.
Dear Matt B (at 2017/01/13 at 9:21 am)
Obama controlled Congress for the first two years until people realised he wasn’t going to deliver on his promises.
best wishes
bill
Andreas Bimba,
Hillary Clinton should have stepped down in the race for democratic presidential nominee and let Bernie Sanders take the fight to Trump. I think things would be looking much better for the US and the world if she had.
Kind Regards
‘Obama’s legacy … was full of American exceptionalism..’ it always astounds me how anybody can believe such talk. The last lot that talked like that were the Nazis and look at what damage such a belief can do. I really think it means exceptionally stupid…
Matt B says:
Friday, January 13, 2017 at 9:21
President Obama had the supreme bully pulpit to talk over the Congress and go directly to the American people to demand changes, he chose not to. He — as a matter of empirical fact surrendered to the elites on every material issue from more tax cuts for the wealthy, single payer healthcare and of course a key labour backed effort to pass the card-heck legislation. (A major plank in his election platform)
Not to mention that a hysterical Congress had no part in Obama’s expanding war agenda – the first President in history to be at war for the entirety of both terms. Of course this made the MIC happy —-
Certainly Congress was not for the most part a sycophant of the Obama administration, that is not in dispute.
Being that was what is was, it in no way provides a “free-pass” to Obama for his failures.
Obama was so owned by the elites that he didn’t even have the guts to stand up to Congress —— a Congress that has an approval rating of 11% among all Americans. How pathetic is that ?
Professor Mitchell, this American loves you.
Charles I agree that Hillary got in the way. I think Sanders had the potential to be very popular as he obtained a substantial following even when the mass media and his party actively opposed him. With the full resources of the Democratic Party behind him along with the ‘liberal’ media, in addition to most of those that voted for Hillary, he would probably have gained a significant portion of votes from those who chose not to vote this time as well as appealing to the blue collar voters and conservative rural voters that are important in the swing states and that turned to Trump. This popularity would have improved the electoral chances of Democratic candidates in Congress. It is plausible that at some point that the Democrats would have controlled both houses of Congress. The fact that the Democratic Party is currently so beholden to the elites and to neoliberalism, almost to the extent of the Republicans, for the sake of the long term perhaps it is good that the Democrats did not win and that there is now an opportunity to reform the party or build alternatives.
Bill Mitchell @11:11,
I will respectfully disagree that Obama “controlled” Congress for the first two years of his term in office. In my opinion, just considering the qualities of the nominally Democratic senators from my state at that time, he did pretty darn good to get the things he did do done in those first two years. Yes, the senators from his party had a majority. But no, many of them had to be dragged against their funding sources to support even watered down initiatives. And after that it got far more difficult. Just check out the history of my senator at the time, one Joe Lieberman, if you doubt me.
Its amazing how the ideological limitations and internal inconsistencies of neoliberalism can turn around an initially progressive facing President. A complete U-turn is what happens nothing less.
With differing opinions on his legacy the one particular kernel of truth is most disappointing:
-Democratic party is no longer there for the poor (does not even try anymore and makes no apologies for this) but it does aim its progressive policy at people who do well through a meritocracy? (eg: university degrees, middle class).
-Symbolically the US got a racial minority as President. He’s got a learned history of the civil rights struggle how will this reflect in policy outcomes and justice?
With that in mind how good were the outcomes involving the intersection of these two subsets. Racial minority + Middle class + Degree:
https://www.stlouisfed.org/publications/in-the-balance/issue12-2015/why-didnt-higher-education-protect-hispanic-and-black-wealth
Evidently the control fraud and foreclosures wiped out a lot of the real wealth gains made by minorities. He stood by and did nothing. Can that position even be defended?
And that takes us to Wall Street. How many went to jail over the corruption and criminal behaviour that created the GFC? Not many. [SNIP]
Many? https://en.wikipedia.org/wiki/Bernard_Madoff
& the only reason he was convicted was because he stole from rich people!
Well written, Bill.
An excellent analysis. I’m sure you will have many more supporters of “peace, freedom, and free markets”, not to mention “liberal american values” vilify you, but I’m sure you are used to it by now. Please keep it up.
My complements; in the following two sentences, you have concisely stated what is becoming the consensus among intelligent commentators.
“Obama’s legacy and the legacy of the Democratic period in office is Donald Trump.”
“The ultimate Obama legacy is the Trump presidency.”