Today (January 22, 2026), the Australian Bureau of Statistics (ABS) released the latest labour force…
Decomposing the decline in the US participation rate for ageing
Labour force participation rates are falling around the world signalling the slack employment growth that has accompanied the aftermath of the Global Financial Crisis. It is clear that many workers are opting to stop searching for work while there are not enough jobs to go around. As a result, national statistics offices considered these workers to have stopped ‘participating’ and classified them as being ‘not in the labour force’, which had had the effect of attenuating the official estimates of unemployment and unemployment rates. These discouraged workers are considered to be in hidden unemployment. But the participation rates are also influenced by compositional shifts (changing shares) of the different demographic age groups in the working age population. In most nations, the population is shifting towards older workers who have lower participation rates. Thus some of the decline in the total participation rate could simply be an averaging issue. This blog investigates that issue for the US after noting yesterday that there has been a massive decline in the participation over the course of the downturn in that country. But we also note that the aggregate participation rate has been in decline since the beginning of this century so there is probably more than cyclical events implicated.
The so-called structural thesis is often used by those who wanted to discourage the use of fiscal policy to redress cyclical shifts in economic activity and behaviour.
Normally a plunging participation rate during a major cyclical downturn is a cause for concern. It tells us that the discouraged worker effect is dominating such that workers who want to work exit the labour market due to lack of job opportunities.
These workers fail the activity test built into the Labour Force Survey and the national statistician (the BLS in this case) excludes the worker from the labour force estimate. This has the effect of attenuating the rise in unemployment.
The discouraged workers differ from the officially unemployed only because they have given up active search. The evidence is strongly supportive of the view that they give up looking because there are insufficient jobs to go around and to protect their self-esteem from the multiple rejections they just stop looking and wait for employment growth to improve.
If they were offered a job they would take it and start work immediately. In that sense, they are functionally no different to someone who is unemployed. The discouraged workers are otherwise known as the hidden unemployed for that reason.
Basic LF arithmetic
The Labour Force Survey typically asks the respondents:
1. Did you work for at least one hour in the past week? Yes: counted as Employed. Then the respondent will be interrogated about whether they have enough hours of work and more.
2. If the answer was No, then the person is asked: (a) Are you willing to work?; and (b) Are you actively seeking work?
If the answers are: Yes, Yes, then the person is counted among the officially Unemployed.
If the answers are: Yes, No, then the person is counted as being Not in the Labour Force (NLF), that is, inactive.
The aggregates are E + U = the Labour Force (LF).
LF + NLF = Working Age Population (WAP).
The Labour Force Participation Rate (LFPR) = LF/WAP
The Unemployment rate (UR) = U/LF.
The Employment-Population ratio (EPOP) = Employment/WAP.
Trends and Cycles in the Labour Force Participation Rate
The LFPR thus is sensitive to the economic cycle because job search rises when times are good and falls when times are bad.
But the LFPR can also be influenced by trend factors (sometimes called structural factors) and the ‘ageing population’ is one such factor. The other is the gender balance in the WAP. For example, participation rates rose dramatically in the 1970s as a result of social changes, which saw a massive influx of married women into the workforce.
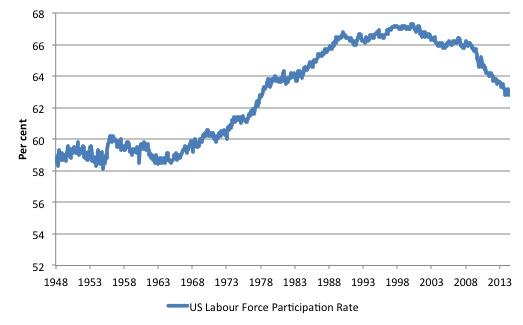
The following graph shows the aggregate participation rate from January 1948 to June 2014. The US aggregate participation rate peaked at 67.3 per cent in April 2000 (seasonally adjusted). Thereafter it has declined on trend with some reversions in between.
It is thus clear that the decline in the aggregate participation rate began before the GFC hit the US.
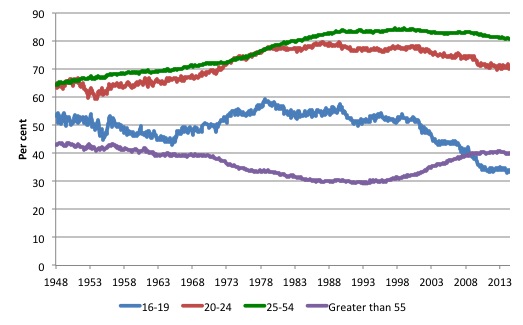
The next graph breaks the aggregate down into age groups. The prime age (25-54) and 20-24 groups have seen a tapering of their participation rates sine the late 1980s.
There have been sharp declines in the participation rates for teenagers (16-19) since the late 1980s and a steady rise in participation rates for the over 55s.
Decomposing the Trend and Cycle components
The question is: How much of that falling LFPR is due to the cyclical slowdown and how much of it is due to the ageing of the population?
The total participation rate (LFPR) is weighted average of the underlying participation rates of the demographic groups that make up the total Working Age Population (WAP). We will stick to using: three broad groups – young workers 15-24 years old; prime-age workers 25-54 years old; and older workers 55 years and over.
The behaviour of the individual age cohorts within the prime-age category (25-34, 35-44, 45-54) is very similar and researchers often reduce the complexity of the problem by aggregating them together with little loss of information.
For those who like formulas we can write the total participation rate as:
LFPR(t) = (w1524 x LFPR1524) + (w2554 x LFPR2554) + (wGT55 x LFPRGT55)
In English this just says that the Total LFPR at time t is equal to the weighted sum of the participation rates of the three demographic groups, where the weights are given by the share of each demographic group in the WAP.
The weights are calculated, for example as: w1524 = Total Population of 15-24 year olds divided by Total WAP. And so on for the other two groups.
The following holds: w1524 + w2554 + wGT55 = 1
The weights proportionately segment the total WAP into the three age groups respective shares.
Like any average, the total is influenced by the LFPR behaviour of the three groups and the weights each group has in the WAP.
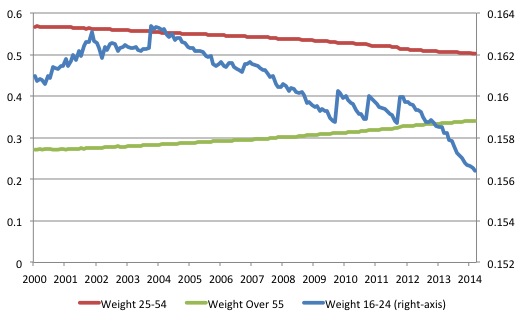
For example, we could encounter a situation where the LFPRs for the three groups are unchanged but the total WAP becomes comprised on more of the GT55 group and less of the 1524 groups and if LFPRGT55 < LFPR1524, then the total LFPR will fall just because there are proportionately more people in the WAP who have lower participation rates. So the LFPR can fall not due to changes in the underlying behaviour but because of shifts in the population age composition. The next graph shows the changing weights of the three groups in the total Working Age Population (WAP) for the US from April 2000 (the peak participation rate month) to June 2014. We note that Prime-age demographic (25-54 year olds) steadily declines as a share of the total WAP over the period shown. At that time, the share of older workers (GT55) in the total WAP started to rise steadily as the Prime-age persons moved into that category. The US Youth participation rates (16-24), shown on the right-hand axis has declined over the same period. The absolute decline in weights are:
- 16-24: -0.46 percentage points
- 25-54: -6.51 percentage points
- Over 55: 6.97 percentage points
As an aside, this information allows you to see how scaling on a vertical axis can provide a very misleading impression. The youth decline is very small relative to the changes in the weights of the other two age groups.
The decline in the Prime-age weight has been less than the rise in the Older workers share because the Prime-age category is experiencing flows at both thresholds – the youth flow in and the older Prime-age workers flow out.
Estimating the effect of ageing on the LFPR
The total LFPR peaked in April 2000 at 67.3 per cent. By June 2014 it was estimated to be 62.8 per cent, which suggests a dramatic fall. The difference given the current WAP is some 11.1 million workers who are no longer in the workforce. These workers would have been in the Labour Force if the participation rate had not fallen from its April 2000 peak.
The question is what happened to these workers? In a recession, older workers typically reduce their participation rates because they are among the first to lose their jobs. They become discouraged workers, some retire prematurely, others take up disability support pensions (doctors take sympathy on them and give then an easy ride through the system), and others, still, start small business with payout cheques.
The current recession and its aftermath has seen something quite different. Older workers have increased their participation rates.
So there is now a higher proportion of older workers seeking work. However, there are also more of these workers in the Working Age Population, which will reduce the weighted average total.
We can estimate the impact of the shifting demographic composition of the Working Age Population on the Total LFPR from any point in time quite easily.
If we use April 2000 as the demographic benchmark and ask the question: How much of the decline in the total LFPR is due to the ageing of the Working Age Population, then we can calculate the weighted average in the following way.
Instead of using the current weights as in the previous formula:
LFPR(t) = (w1624 x LFPR1624) + (w2554 x LFPR2554) + (wGT55 x LFPRGT55)
We would use so-called fixed weights, where the relevant weights (proportions in the population) are fixed at their April 2000 values. In other words, we are then considering the LFPR behaviour for each group weighted by the share of the WAP as at April 2000. The behaviour of the total weighted average then is not due to the shift in the population shares.
The formula would be (in this case):
LFPR(t)April_2000 = (w1624April_2000 x LFPR1624) + (w2554April_2000 x LFPR2554) + (wGT55April_2000 x LFPRGT55)
where the term (for example) w1624April_2000 is the share of 15-24 years olds in the WAP as at April 2000.
Then the difference between the two calculations LFPR(t) and LFPR(t)April_2000 tells us the change in the participation rate that is due to changes in the age distribution of the Working Age Population since April 2000.
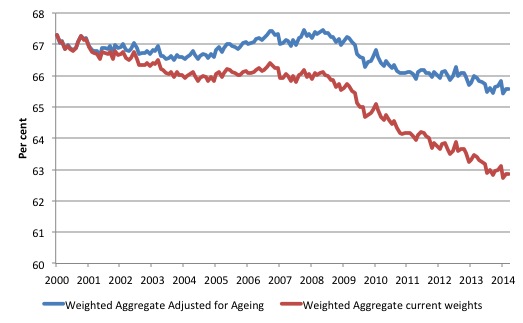
The following graph plots the two times series – the actual LFPR(t) (denoted Weighted Aggregate current weights LFPR) and LFPR(t)April_2000 (denoted Weighted Aggregate Adjusted for Ageing LFPR).
The results suggest if the age composition of the Working Age Population had have remained at its April_2000 shares then the LFPR at June 2014 would be 65.6 per cent rather than the actual reported LFPR of 62.8 per cent. The April_2000 LFPR was 67.3 per cent.
The actual decline in the LFPR was 4.5 percentage points between April 2000 and June 2014.
We estimate therefore that the shift in the age composition of the working age population accounted for a fall in the LFPR of 2.7 percentage points, which is about 60.1 per cent of the actual decline.
The remainder is most likely driven by cyclical effects (more analysis is required) or 4.3 million workers who could reasonably be considered to be extra hidden unemployed.
There were 9.5 million workers officially unemployed in the US (6.1 per cent of the labour force) in June 2014. If we considered the 4.3 millions workers to be hidden unemployed, then the adjusted ‘unemployment rate’ would be 8.7 per cent in June 2014.
Thus even when we adjust for the ageing factor, the situation is still very grim in the US and the official headline data is quite misleading.
Conclusion
There is some factual basis for the conclusion that the falling participation rate in US is an artifact of the ageing population.
There are now more older workers in the WAP and although their participation rate has risen somewhat since the onset of the GFC, the volume effect outweighs the rate effect and the impact on the overall weighted average (the total LFPR) is negative.
It still remains that the cyclical factor is huge (4.5 millions workers) and the official unemployment rate is not an accurate indicator of the true poor state of the US labour market.
That is enough for today!
(c) Copyright 2014 Bill Mitchell. All Rights Reserved.


Yes, it might be worth noting that the Affordable Care Act is widely recognised to have allowed a lot of older workers to leave the labour force.
http://www.thestreet.com/story/12697069/1/obamacare-really-is-encouraging-unemployment-and-thats-a-good-thing.html
Bill,
Great stuff, I always look forward to your labor force analysis.
Best,
Justin
Hi Bill
A question could be, in addition, should the working age population be measured as up to 70 years of age or more? A ‘structural’ type of argument for increasing the pension age is that people now physically can work longer. This claim of course needs unpicking along with the politics of ‘can we afford the pension if we want to balance the books and not put future generations in debt’… But, if we were to take into account those currently working beyond 65 years of age, and not appearing in workforce calculations – there also must be a 65+ jobless group not currently included in workforce calculations. One question might be how might this reflect the viability of arguments in favour of raising the pension age? But there are other important policy questions about life after 65 for this group of people too. Do we know enough? A proposal to keep the pension age at 65 but increase the age of participation in a job guarantee would also be interesting to think about. A good way to begin to collect official data about the real older workforce too.
Jim
Jim, your comment brings up a great deal of nonsense. I do not mean to imply that you are the source of this, only that the sources you allude to are doing this. Let me only take working past 70. Just because someone lives past 70 does not carry any implication whatever that he or she can thereby continue working. The implicit implication here is that they can work until they drop dead. And then let me only take a particular job, plasterer. I know a number of these guys and not really any of them can continue plastering after 60 let alone 70, with a few exceptions. This is primarily because their shoulder joints become too worn and plastering becomes quite painful.
A number of jobs are much like this one. And a number of discussions about employment policy take an exception, a chap who can plaster until he is, say, 80, and use him as part of an argument that effectively criticizes the other guys for not being able to do what this exceptional individual can do. What should be done in such discussions is to admit that there is something different about this guy that enables him to do what the average person can’t, not as part of an argument that contends that the average person must be malingering because they aren’t doing what the exceptional individual is.
But, of course, if your interest is in bashing the “worker”, as the neoclassical supporters appear to be wanting to do, then you would argue that the exceptional isn’t exceptional but normal, thereby rendering the normal inadequate in some degree. I used plastering but the same argument applies to other jobs that can be and often are physically debilitating when done over a rather large number of years.
Of course, our neoclassical policy pundit can argue that plasterers can segue into other jobs and can point to individuals who have done so. I place such arguments in with my exceptional individual case above. This neoclassical gambit is nothing more than sophistry, just as it was before.
As for the argument regarding our grandchildren, this is nothing more than scaremongering worthy only of a second rate drama, not serious discussion.
Hi Larry
I’m sorry, but I don’t think you read what I wrote. At the time I wrote ‘keeping the retirement age at 65’ what was in the back of my mind was lowering it to 60. But that I felt would add another political demand on the system, so leave well alone for the while, as they say. I think I might agree with you on many of your points. I know myself what it is like to have worn out body parts. And, why do you quarrel with the idea of recognising that too few jobs coupled with a realistic working age population age of 70 or more (of necessity for many who cant afford to retire) gives an even more realistic figure for the rate of unemployment. I may be wrong on the maths, but the political reality is well recognised by me. Job guarantee and/or invalidity benefit would begin to sort out the question of disability and people that still want to work at whatever age – we already have a number of schemes that give people the dignity of a job when they are below retirement age, for example. Keeping a retirement age, (rather than finishing altogether with the idea of there being dignity in retirement) and JG + work + benefits (for example) gives people control over their life and allows people to decide what they think is dignified. I’m not sure who then would tell me that I’m too old to work, maybe it’s one’s friends and family rather than the state.
Finally, I’m far too close to the bad past – my father was born in 1911 and lived to 90 – to want to see the end to retirement – it was hard won in the face of the charity of workmates giving you the easier work, as it was in the past on the docks, in the fields, on building sites, factories etc. And there was the workhouse or charity, or just simply starvation. You don’t have to tell me about the neolibs – ‘cradle to grave’ means for them lifelong debt penury that they’re well on their way to imposing on the young at birth via their parents.
Jim
Hi Jim,
I’m sorry but, given your reply, I think I misunderstood what you wrote initially. I certainly don’t have any disagreements with with your reply. If we are not quite on the same page, we are in the same chapter of the same book.
larry
“Let me only take working past 70. Just because someone lives past 70 does not carry any implication whatever that he or she can thereby continue working. The implicit implication here is that they can work until they drop dead. ”
I’ll add another dimension to this whole issue, one that goes to the core of the fact that we are human beings and not merely individual production units.
How normal is it for grandparents to be busily engaged in full-time work, to the extent that they have the time to only play a very minor role in the growth and development of their children’s children? Human beings typically live long enough to be grandparents for a reason, and that reason is not to keep working until they drop dead. The idea that everybody should still be in full-time work when their grandchildren enter the workforce seems rather perversely inhuman to me.
The elderly play a very important social role that outweighs questions about direct economic productivity.
The modern capitalist system (plutocratic and corporate) is not the least bit interested in solving unemployment. It is their policy to keep unemployment and under-employment high. It is done to discipline workers, keep wages down and profits up. It is also done to fight the inflationary effects of the many other policies designed exclusively to assist the rich.
The bottom line is that none of these problems (unemployment, inequity, rising poverty) can be comprehensively and permanently solved under capitalism. These problems are inherent to capitalism itself. The overall attempt to reform capitalism (circa 1935 to 1974) was temporarily and partially successful. Since about 1974, all these reforms of capitalism have been wound back and continue to be wound back.
So, unless you are prepared to talk about the end of capitalism don’t bother trying to talk about the end of unemployment. It’s a non sequitur in formal logic terms to talk about dealing with unemployment without dealing with capitalism.
Hi Lefty
I like the idea that retirement can give you time to look after children. Not all of us have grand children. Nor do I see a problem with either part time work or paid work looking after children after age 65. It’s not all or nothing. I think some people also go through life phases. At 65 you may notice that life does not last for ever. You may wish to start and finish something new at 65 – a PhD and university teaching is not impossible. On another tack entirely, I think other people’s life histories are important too – Maori people as a population in New Zealand can live 8-10 years less than Pakeha. There are questions of equity and social justice caught up with the idea of pension contributions and the age at which you retire and die. It seems that mass unemployment can contribute to a shortened life as in the case of Maori. The economy and/or government should create full employment to make sure that we have a healthy old age, know when to stop working, AND enjoy a retirement if that’s what you want.
Jim
Bill,
Great piece! It is extremely insightful. I do not often drop by your blog, but this was very helpful – just realised it sound like a spam message when I write this, but it is really a great post.
It certainly helped me a lot in terms of understanding the “mysterious” drop in the participation rate.
Thanks again.