I grew up in a society where collective will was at the forefront and it…
US economy – slowing down – fiscal stimulus needed
Last week (March 25, 2016), the US Bureau of Economic Analysis released their ‘Third Estimate’ of – Gross Domestic Product, 4th quarter 2015 – which showed that the US economy slowed rather appreciably in the last three months of 2015. The BEA said that real GDP growth was “increased at an annual rate of 1.4 percent” after having increased by 2 per cent in the third-quarter of 2015. Two things stand out from the data: (a) Private consumption expenditure, while still relatively strong continues to slow. The main drivers of consumption expenditure are recreation and health care services and durable goods; (b) Capital formation (investment) declined for the second consecutive quarter, signalling a lack of confidence in the medium-term outlook by business firms. However, residential investment was relatively strong as was federal government spending. The BEA also reported that corporate “profits decreased by 7.8 per cent at a quarterly rate”. The data release provides no succour to those who think the Federal Reserve Bank should continue to hike interest rates. Inflation is still well below the implicit central bank target rate (2 per cent) and growth is faltering.
The BEA said in the release that:
Real gross domestic product — the value of the goods and services produced by the nation’s economy less the value of the goods and services used up in production, adjusted for price changes — increased at an annual rate of 1.4 percent in the fourth quarter of 2015 … In the third quarter, real GDP increased 2.0 percent …
The increase in real GDP in the fourth quarter reflected positive contributions from PCE, residential fixed investment, and federal government spending that were partly offset by negative contributions from nonresidential fixed investment, exports, private inventory investment, and state and local government spending. Imports, which are a subtraction in the calculation of GDP, decreased.
The deceleration in real GDP in the fourth quarter primarily reflected downturns in nonresidential fixed investment and in state and local government spending, a deceleration in PCE, and a downturn in exports that were partly offset by a smaller decrease in private inventory investment, a downturn in imports, and an acceleration in federal government spending.
The following sequence of graphs captures the story.
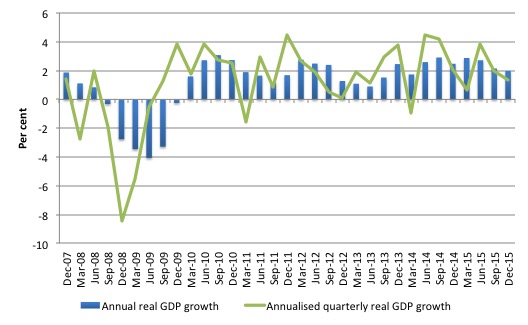
The first graph shows the annual real GDP growth rate (year-to-year) from the peak of the last cycle (December-quarter 2007) to the December-quarter 2015 (blue bars) and the annualised last quarter growth rate (green line). The data is available – HERE.
The year-to-year growth rate (December-quarter 2014 to December-quarter 2015) was 2 per cent, down from 2.1 per cent in the last quarter. There is considerable volatility in the data which is smoothed out by the year-to-year growth calculation.
The annualised quarterly growth rate (that is, multiplying the December-quarter 2015 performance by 4) is only 1.38 per cent down from 1.97 per cent in the last quarter. This is considerably slower than the annualised 3.86 per cent for the June-quarter.
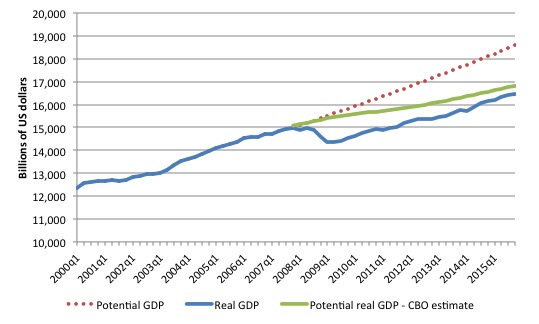
The next graph shows the actual real GDP for the US (in $US billions) and an estimate of the potential GDP. There are many ways of estimating potential (given it is unobservable).
While I could have adopted a much more sophisticated technique to produce the red dotted series (potential GDP) in the graph, I decided to do some simple extrapolation instead to provide a base case.
The question is when to start the projection and at what rate. I chose to extrapolate from the most recent real GDP peak (December-quarter 2007). This is a fairly standard sort of exercise.
The projected rate of growth was the average quarterly growth rate between 2001Q4 and 2007Q4, which was a period (as you can see in the graph) where real GDP grew steadily (at 0.68 per cent per quarter) with no major shocks.
If the global financial crisis had not have occurred it would be reasonable to assume that the economy would have grown along the red line (or thereabouts).
The gap between actual and potential GDP in the fourth-quarter 2015 is around $US2,218.2 billion or around 11.4 per cent. The gap has been steady at around 11 per cent since the first-quarter 2014, which means that real GDP is once again growing about as fast at it did, on average in the 6 years before the crisis.
The green line is the estimate of potential output provided by the US Congressional Budget Office and made available through – St Louis Federal Reserve Bank.
Their output gap estimate (difference between actual and potential) is 2 per cent, which is clearly less than that derived from a simple extrapolation.
CBO define Potential GDP as “the level of output that corresponds to a high level of resource-labor and capital-use.”
So how do they estimate potential GDP? They explain their methodology in the document – A Summary of Alternative Methods for Estimating Potential GDP.
I discussed the methodology and limitations in these blogs – Structural deficits and automatic stabilisers and US problems are cyclical not structural.
For those who want even more technical detail, please consult my 2008 book with Joan Muysken – Full Employment abandoned – where we provide a mathematical and econometric discussion of the techniques that the CBO uses.
By way of summary, the CBO say that they:
They start with “a Solow growth model, with a neoclassical production function at its core, and estimates trends in the components of GDP using a variant of a tried-and-tested relationship known as Okun’s law. According to that relationship, actual output exceeds its potential level when the rate of unemployment is below the “natural” rate of unemployment) Conversely, when the unemployment rate exceeds its natural rate, output falls short of potential. In models based on Okun’s law, the difference between the natural and actual rates of unemployment is the pivotal indicator of what phase of a business cycle the economy is in.
The resulting estimate of Potential GDP is “an estimate of the level of GDP attainable when the economy is operating at a high rate of resource use” and that if “actual output rises above its potential level, then constraints on capacity begin to bind and inflationary pressures build” (and vice versa).
So despite saying that their estimate of Potential GDP is “the level of output that corresponds to a high level of resource-labor and capital-use” what you really need to understand is that it is the level of GDP where the unemployment rate equals some estimated (unobservable) Nonaccelerating Inflation Rate of Unemployment (NAIRU).
Intrinsic to the computation is an estimate of the so-called “natural rate of unemployment” or the NAIRU which is the mainstream version of ‘full employment’ but is, in fact, a conceptual unemployment rate that is consistent with a stable rate of inflation.
The literature demonstrates that the history of NAIRU estimation is far from precise. Studies have provided estimates of this so-called ‘full employment’ unemployment rate as high as 8 per cent or as low as 3 per cent all at the same time, given how imprecise the methodology is.
The former estimate would hardly be considered “high rate of resource use”. Similarly, underemployment is not factored into these estimates.
The concept of a potential GDP in the CBO parlance is thus not to be taken as a fully employed economy. Rather they use the devious shift in definition in mainstream economics where the the concept of full employment is not constructed as the number of jobs (and working hours) that which satisfy the preferences of the available labour force but rather in terms of the unobservable NAIRU.
The fact is that these estimates will typically underestimate (by some margin) the true scale of the existing output gaps because the estimated NAIRU is never above the irreducible minimum unemployment rate, the latter reflecting frictions in the labour market as people move between jobs.
You may also like to read this blog – Demand and supply interdependence – stimulus wins, austerity fails – where I discuss the US Federal Reserve Bank’s recent updated estimates of potential GDP.
Both potential GDP estimates in the graph above (the red dotted linear extrapolation and the CBO green estimates) are extremes and the truth is somewhere in between the two.
The decline in the investment ratio as a result of the crisis will have caused the potential GDP growth to slacken somewhat, which means the red dotted line is an upper limit.
The qualitative assessment is that unemployment is still elevated and underemployment is high, which means that the output gap is likely to be closer to 11 per cent than 3 per cent.
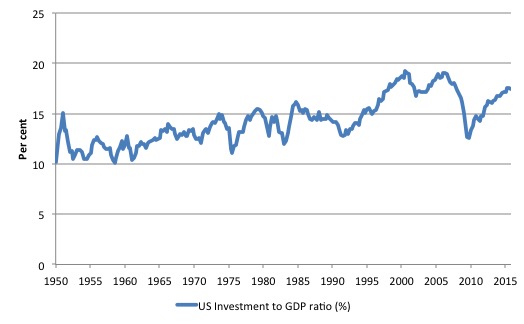
But it is true that potential output will have fallen off the red linear trend as the investment ratio (total investment as a percent of GDP) slowed in 2009. It went from 18 per cent in the September-quarter 2007 to 12.5 per cent in the December-quarter 2009.
So there was a sharp slowdown in capacity building which would have reduced the potential growth path somewhat.
It was back to 17.4 per cent in the December-quarter 2015 but is still well below the pre-GFC levels.
The following graph shows the evolution of the Private Investment to GDP ratio from the March-quarter 1950 to the December-quarter 2015.
The other relevant point about the graph is that it defies those who want to characterise the main US problem as being structural (labour market rigidities etc). The US would not have fallen off the cliff as it did in early 2008 if that was the case. Structural deterioration is gradual and cumulative not sudden and sharp.
Contributions to growth
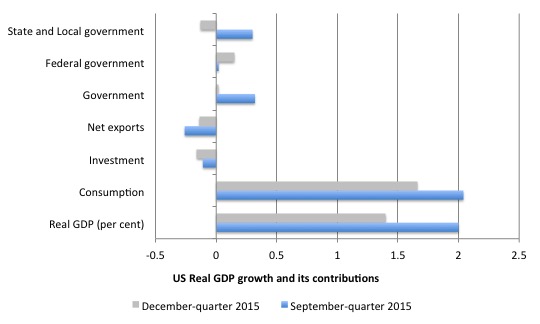
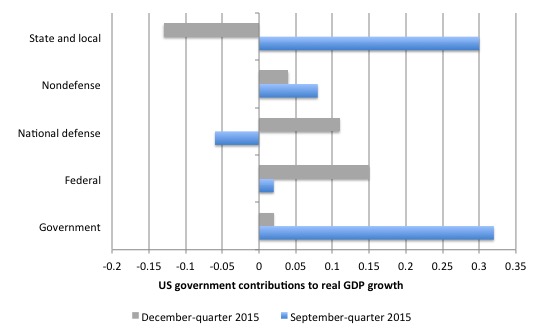
The next graph compares the September-quarter 2015 (blue bars) contributions to real GDP growth at the level of the broad spending aggregates with the December-quarter 2015 (gray bars), where the overall real GDP growth was 1.4 per cent.
The main aggregate source of growth came from Private consumption spending (1.7 percentage points). But the strength of Private consumption has declined over the last three quarters as the household saving ratio has risen. It is hard to interpret that shift but a plausible explanation is that increasing uncertainty and high levels of household debt are promoting caution among households.
The contribution of Private investment spending was negative for the second, consecutive quarter (-0.16 percentage points) and does not augur well for the medium-term outlook.
The Government sector overall reduced its growth contribution to 0.02 points down from 0.32 points. The federal contribution strengthened to 0.15 points, while the State and Local government sector detracted from growth (-0.13 points).
Net exports drained total spending by 0.14 points (down from -0.26 points in the last quarter). Last quarter, exports added 0.09 points but this quarter they detracted from growth by 0.25 points.
The external outlook for the US is being dampened by the on-going malaise in Europe and the appreciation of the US dollar.
The next graph decomposes the government sector and shows that the contributions between the levels of government have reversed in the last three months of 2015.
Further, the strong contribution of defense spending at the federal level is apparent.
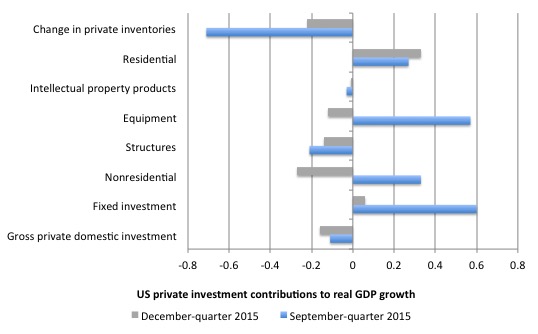
The next graph shows the contributions to real GDP growth of the various components of investment. It is here that we see why total real GDP growth slowed in the third-quarter.
Unsold inventories continued to drain growth (by -0.22 points). The two consecutive quarters of inventory run-down now suggests that the inventory cycle is turning down as firms cut production growth in response to the slowing consumption expenditure.
This would signal an on-going weakness in the economy.
There was a reduced contribution by fixed investment (0.06 points).
The data shows that the contribution of investment in structures to real GDP growth continued to decline (-0.14 points output drain).
This includes investments in factory buildings, office buildings, hospitals etc but also would include investments in mining and oil production capacity.
Residential investment remained a solid contributor in the current quarter (0.33 points up from 0.27 points).
Conclusion
Real GDP growth slowed in the September-quarter 2015 largely because of the rising US dollar value and the slowdown in investment expenditure.
The slowdown continued into the last three months of 2015, largely due to the on-going slump in private investment expenditure, negative export growth and contracting State and Local government expenditure.
Clearly household consumption expenditure is holding up and the rising pace of federal government expenditure maintained the growth impetus.
In general, I conclude that with private business investment faltering, the federal government’s deficit is now too low to support stronger growth and labour underutilisation rates (U6) remain elevated (and excessive).
FINALLY – Introductory Modern Monetary Theory (MMT) Textbook
I will write a separate blog about this presently, but today we finally published the first version of our MMT textbook – Modern Monetary Theory and Practice: an Introductory Text – today (March 10, 2016).
The long-awaited book is authored by myself, Randy Wray and Martin Watts.
It is available for purchase at:
1. Amazon.com (60 US dollars)
2. Amazon.co.uk (£42.00)
3. Amazon Europe Portal (€58.85)
4. Create Space Portal (60 US dollars)
By way of explanation, this edition contains 15 Chapters and is designed as an introductory textbook for university-level macroeconomics students.
It is based on the principles of Modern Monetary Theory (MMT) and includes the following detailed chapters:
Chapter 1: Introduction
Chapter 2: How to Think and Do Macroeconomics
Chapter 3: A Brief Overview of the Economic History and the Rise of Capitalism
Chapter 4: The System of National Income and Product Accounts
Chapter 5: Sectoral Accounting and the Flow of Funds
Chapter 6: Introduction to Sovereign Currency: The Government and its Money
Chapter 7: The Real Expenditure Model
Chapter 8: Introduction to Aggregate Supply
Chapter 9: Labour Market Concepts and Measurement
Chapter 10: Money and Banking
Chapter 11: Unemployment and Inflation
Chapter 12: Full Employment Policy
Chapter 13: Introduction to Monetary and Fiscal Policy Operations
Chapter 14: Fiscal Policy in Sovereign nations
Chapter 15: Monetary Policy in Sovereign Nations
It is intended as an introductory course in macroeconomics and the narrative is accessible to students of all backgrounds. All mathematical and advanced material appears in separate Appendices.
A Kindle version will be available the week after next.
Note: We are soon to finalise a sister edition, which will cover both the introductory and intermediate years of university-level macroeconomics (first and second years of study).
The sister edition will contain an additional 10 Chapters and include a lot more advanced material as well as the same material presented in this Introductory text.
We expect the expanded version to be available around June or July 2016.
So when considering whether you want to purchase this book you might want to consider how much knowledge you desire. The current book, released today, covers a very detailed introductory macroeconomics course based on MMT.
It will provide a very thorough grounding for anyone who desires a comprehensive introduction to the field of study.
The next expanded edition will introduce advanced topics and more detailed analysis of the topics already presented in the introductory book.
That is enough for today!
(c) Copyright 2016 Bill Mitchell. All Rights Reserved.
Hi Bill, I agree that public spending should rise and/or taxes fall if the ‘potential output’ gap is to be closed. But US output is not growing as slowly as you and many commentators would argue. Growth is moderate though momentum is slowing (as seen in the quarterly data).
You correctly state: “The year-to-year growth rate (December-quarter 2014 to December-quarter 2015) was 2 per cent, down from 2.1 per cent in the last quarter. There is considerable volatility in the data which is smoothed out by the year-to-year growth calculation.”
Using annual data (which makes perfect sense if you want to focus on actual annual growth) the yanks grew at 2.43% in 2015. And coincidentally by the same amount in 2014, following 1.49% in 2013. Moderate growth has been a relatively familiar feature of US GDP for fifteen years. Not since 2000 has US output grown by more than 4% in any one calendar year…
So if the fairly moderate output growth of the US post 2000 is more cyclical than structural, why is it taking so long for the cycle to run it’s course? Perhaps it’s normal for a cycle to be this long? Why is it the case that the participation rate-driven falls in the unemployment rate are cyclical rather than longer term structural changes?
Finally, the US could massively increase the deficit with minimal impact on inflation as wages growth would be contained by an increasing labour force. I can’t remember too many occasions (if any?) where the US had high inflation with wages growing at a strong clip.
Cheers, and keep blogging@!
last para I meant to say, I can’t remember too many occasions (if any?) where the US had high inflation WITHOUT wages growing at a strong clip.
Dear esphgia, Don’t take the GDP figures seriously. They will lead you astray;
http://www.cnbc.com/2016/03/24/cnbc-analysis-dont-trust-those-gdp-numbers.html
Bill,
In your blog you are no longer talking to just an accounting or economics audience. Hence it’s a disservice to your country (& all electorates) to persist in narrow use of double-entry bookkeeping jargon. 90% of humanity is confused by your terminology. Face it.
In this blog, you really must face the music, and use GENERALLY DEFINED terms of speech, NOT narrow jargon.
It’s a pity we persist in sowing semantic confusion & downright sophism.
Public Initiative = Public Contracting & Payments = Congressional Appropriations = Currency Supply* =
………….. national “deficit” ? Huh? Living & growing is a deficit? How so?
Aaauuuugggghhh! Politicians confuse themselves with such sloppy definitions, and even opposing economists acquiesce in using that terminology. Go figure.
When the best we can do is tell J&J Sixpack that we need more “deficit” … the politicians & economists need a slap in the face. At least talk right, damn it!
Might as well issue commands in Greek & hire a Valley Girl to listen & execute them. 🙁
(Or a Mad Hatter in the policy office.)
Message to all politicians, economists (& citizens): Just define the @#$%&! terms before giving advice or arguing policy?
At the very least, please use the general terms of speech used by non-academic audiences (i.e., voters), and then post a short glossary of terms at the top of each blog page, providing translations to the peculiarities of econo-speak slang.
That little step may make all the difference in the world. Seriously.
With that interface provided, the National Academy of Sciences might soon be on your side.
(* Yes I know, post taxes)
You can’t trust extrapolation. Given an extrapolation from only 7 years of data, I would not trust it past one additional year, i.e., 2008.
roger erickson, you’re completely right. Well said!
I ordered the text book so I’m keen to hopefully self-learn some of the more technical details of MMT even though it makes sense to me from all I’ve read. As you mentioned I think it’s good value for an academic text book. I couldn’t afford European Dystopia but maybe one day soon when I can get employment again after a break from the workforce whilst studying.
Back to the topic of this blog I was watching Bloomberg with Janet Yellen live and she said the natural rate of interest for full capacity of the economy and full employment is now seen as 0%! I couldn’t believe my ears as MMT just seems to be so much closer to reality (astronomy) than the mainstream economics (astrology) that central bankers use.
Anyway hopefully after learning the MMT text I can be more educated in my contribution to MMT in all areas of spreading the word. 🙂
roger erickson,
“Generally defined” terms of speech are inadequate for any specialist subject. This is well known in all philosophical, scientific, economic and sociological fields. What you critique as “narrow jargon” is in fact precise technical language. Certainly, there is a communication problem involved. The specialist (Bill in this case) must use the minimum necessary amount of precise technical language for accurate communication. The specialist must translate and paraphrase technical language to a degree. However, every essay or missive cannot be weighed down with endless glossaries and explanations. The onus is also on the average citizen to develop a basic understanding. He (or she) must educate himself (or herself) up to a level where his (or her) understanding of basic technical terms is adequate for understanding the general arguments in any subject of public interest.
If our society acts to “dumb down” and “ill-educate” the average citizen (as it mostly does) then the average citizen must make efforts to improve personal education and then in turn social and public education. That would be the essence of grass-roots intellectual development.
John Doyle,
Agree, especially for the US which has a large tech sector and so hedonic adjustment strongly overstates growth and understates inflation.
Cheers,
Esp.
I have to say that compared to your average economics paper Bill’s explanations are clarity itself. The usual method of a paper is to give you a question at the start, a lot of maths, some vague circular reasoning and leave it at that. No conclusion that answers the question that was asked at the beginning. You have to fill in the gaps yourself.
Bill on the other hand gives a coherent explanation, has explained a lot of things that were never explained to me when I did my BA Econ major (eons ago) and has filled in a lot of gaps in my understanding.
I agree 100% with David Olsen.
I think roger e should start his own blog rather than dictate terms to a bloke who is trying to make the world a better place.
I don’t wish to involve myself in a spat here, but I think that roger e has a point.
One of Prof. Mitchell’s main aims is, I believe, to show us, the big public, and our political representatives that the assumptions upon which neo-liberalism is based are false. But, of course, that necessitates an understanding of those propositions on the part of his target audience – one cannot convince someone that an argument is unsound if s/he does not grasp the states of affairs depicted by its premises. And, as Mitchell has said elsewhere ( see e.g. http://www.thenation.com/article/beyond-austerity/), such an understanding is absent, because, despite their being embedded in public debate, the assumptions in question are expressed in an opaque jargon, the sense and reference of which aren’t even fully understood by many of those who have been inculcated in it, i.e., the specialists. It thus seems to me (and, I think, roger e) that until that jargon is made less opaque, obfuscation will remain the order of the day, the average citizen will not be inclined to do the work necessary to better educate herself on these matters, and Prof. Mitchell’s cause (as I understand it) will not be advanced.
Now, it may well be that this blog, which is both excellent and unique, is aimed at the specialists themselves and is not, therefore, the place for such exegesis. If so, that’s fine. But the problem put forward above still remains.
‘”Generally defined” terms of speech are inadequate for any specialist subject.’
That’s beside the point. Every language maintains it’s dynamics by assigning multiple meanings to many if not most words, based on context. That’s the price we pay for keeping lean, flexible symbolism we call language.
It also means that every used of a specialized jargon owes it to their aggregate to switch back to “gen-speak” when speaking to general, NOT specialist audiences.
I meant my comment in a friendly manner. I’ve met Bill, years back, we correspond occasionally, & I’ve brought this up before.
No offense meant, Bill. I’ll apologize again for being a blunt-speaking American, admittedly not as polite as your average Australian or Canadian.
Yet what I said was from the heart. Billlyblog has become WIDELY read. If Bill Mitchell can’t explain fiat currency operations in plan language to all the non-economists of the world (that’s by FAR the majority), then who can?
Personally, I don’t think that strategies A or B (below) are the best ones. I’ve come to think that strategy C offers the best, fastest way of getting (beginner) politicians to do what electorates want. Just my heartfelt suggestion.
A) re-educate specialist economists, from within the profession
(1 you have a LOT of University institutional momentum to overcome, and they’d rather fight than switch;
2 that whole battle may turn out to occur in a policy vacuum, and be a Pyrrhic process, win or lose;)
B) get a subset of rebel economists to re-educate beginner politicians
(1, see A;
2, never underestimate the ability of beginner politicians to leverage an uninformed electorate!)
C) educate the electorate directly, using THEIR language & common-speak jargon;
(there’s no need to quote the litany of fabled policy blokes who’ve said that the best defense of democracy is an informed electorate)
I’ve personally been to meetings in Washington DC where Congressional Committee members unequivocally show that they understand the reality of fiat currency operations, and Congressional Appropriations. It’s really just the beginner politicians that spout most of the complete nonsense. I guess experienced parliamentarians just chalk it up to the learning & maturing process. Is the slowness of that process no longer something that our dynamic cultures have the luxury of maintaining? If not today, then certainly tomorrow!
Yes, I do have my own blog, where I often wonder why we as a culture over-study so many specialties, while sharing so little across disciplines.
I’m over-trained myself in a given specialty, biology & neurophysiology, and would welcome input at my blog to restate in plain terms some of the things I try to say. Anyone who’s truly interested can ask Bill for my email address.
What happens to all specialists is that by the time they’re over-educated, they forget what it was like to begin learning some of the things they picked up decades ago.* I often wonder whether scientists or researchers make worse, average or better parents & grandparents. Based on what I’ve seen, I’m guessing accurate data would show a slight negative in that department, for impatience with beginners, if nothing else. 🙁
What we all tend to forget is the sheer numbers of all the beginners in every electorate, not just in pure youth, but also in time spent discussing topics with specialists outside their own discipline. Network or system math alone dictates that growing systems (i.e., cultures/economies) have to invest progressively more time interacting across disciplines, just to maintain, let alone increase, aggregate agility.
That pays off simply because of the return-on-coordination trumps all other returns, by far.
* The stereotype joke is that Academics know more & more about less & less, until the know everything about nothing. 🙁
this video is actually very relevant; about recombinantly diverse system components (aka citizens) staying connected
How Not To Be Ignorant About The World
https://www.youtube.com/watch?v=Sm5xF-UYgdg
here’s another relevant article
Fighting Fraud & Corruption: The Vital Role of Linguists and Language
https://www.todaytranslations.com/news/how-language-services-are-used-to-combat-corruption-money-laundering-and-data-theft
So why won’t the economics field admit the impact of semantics & sophism?
Is it so important to speak only econ-speak to all audiences, instead of econ-speak to econs, & gen-speak to general audiences?
Is gen-speak a formal Taboo within the economics profession? Rather like speaking only Latin in the archaic Roman Catholic Church? The parallels seem so obvious.