Last Friday (December 5, 2025), I filmed an extended discussion with my Kyoto University colleague,…
Australian inflation outlook – spikey but benign
The Australian Bureau of Statistics released the Consumer Price Index, Australia data for the September-2013 quarter today. The quarterly inflation rate was 1.2 per cent and this translated into an annual rate of 2.2 per cent, down on 2.4 per cent in the June-quarter 2013. The Reserve Bank of Australia’s preferred core inflation measures – the Weighted Median and Trimmed Mean – are now well within the inflation targetting range and are probably trending down. The RBA measure of inflationary expectations is also falling. This suggests that the RBA will probably consider the inflation outlook to be benign or “too low” and if the labour market continues to deteriorate (data for October out early November) then they will probably cut interest rates once before the holiday period. The evidence is suggesting that the economy is slowing under the weight of the previous federal government’s obsessive pursuit of a budget surplus and subdued private spending (particularly non-mining investment). The benign inflation outlook provides plenty of room for further fiscal stimulus.
The summary results for the September-quarter 2013 are as follows:
- The All Groups CPI rose by 1.2 per cent compared with a rise of 0.4 per cent in the March- and June-quarters 2013.
- The All Groups CPI rose by 2.2 per cent over the 12 months to the September 2013, a fall from the annualised rise of 2.4 per cent over the 12 months to June-quarter 2013.
- The seasonally adjusted All Groups CPI, rose by 1.0 per cent in the September-quarter 2013 and by 2.3 per cent for the 12 months to September 2013.
- The significant price rises this quarter were for automotive fuel (+7.6 per cent), international holiday travel and accommodation (+6.1 per cent), electricity (+4.4 per cent), property rates and charges (+7.9 per cent), water and sewerage (+9.9 per cent) and domestic holiday travel and accommodation (+3.5 per cent).
- The most significant offsetting price fall this quarter was for vegetables (-4.5 per cent).
Trends in inflation
The headline inflation rate increased by 1.2 per cent in the September-quarter 2013 translating into an annualised increase of 2.2 per cent for the year to September 2013 which is down from the June-quarter 2013 result of 2.4 per cent.
Does the September-quarter spike signal a dangerous outbreak of inflation is imminent? You just have to reflect on recent labour market data to know the answer to that question is no!
What does it mean for monetary policy? It will probably mean the RBA will sit tight for a while.
The Consumer Price Index (CPI) is designed to reflect a broad basket of goods and services (the “regimen”) which are representative of the cost of living. You can learn more about the CPI regimen HERE.
The ABS say that:
The CPI is a temporal price index for consumption goods and services acquired by Australian resident households. It is an important economic indicator, providing a general measure of price change … The principal purpose of the Australian CPI is to measure inflation faced by consumers to support macroeconomic policy decision making. This is achieved by providing a measure of household consumer inflation by the acquisitions approach.
There are various ways of assessing the general movement in prices depending on the purpose that the measure is being used for. The document I linked to above details some of the approaches. One of these approaches – the “acquisitions approach” – attempts to measure “household consumer inflation” and defines the basket of goods and services as “consisting of all consumer goods and services actually acquired by households during the base period.” The ABS use “market prices for goods and services” (including taxes etc) and make no imputations for “non-monetary transactions” (such as imputed rents). They also exclude “interest rate payments”.
So is a headline rate of CPI increase of 1.0 per cent for the September-quarter significant? To examine its lasting significance we have to dig deeper and sort out underlying structural inflation pressures and ephemeral price facts.
The RBA’s formal inflation targeting rule aims to keep annual inflation rate (measured by the consumer price index) between 2 and 3 per cent over the medium term. Their so-called “forward-looking” agenda is not clear – what time period etc – so it is difficult to be precise in relating the ABS data to the RBA thinking.
What we do know is that they do not rely on the “headline” inflation rate. Instead, they use two measures of underlying inflation which attempt to net out the most volatile price movements. How much of today’s estimates are driven by volatility?
To understand the difference between the headline rate and other non-volatile measures of inflation, you might like to read the March 2010 RBA Bulletin which contains an interesting article – Measures of Underlying Inflation. That article explains the different inflation measures the RBA considers and the logic behind them.
The concept of underlying inflation is an attempt to separate the trend (“the persistent component of inflation) from the short-term fluctuations in prices. The main source of short-term “noise” comes from “fluctuations in commodity markets and agricultural conditions, policy changes, or seasonal or infrequent price resetting”.
The RBA uses several different measures of underlying inflation which are generally categorised as “exclusion-based measures” and “trimmed-mean measures”.
So, you can exclude “a particular set of volatile items – namely fruit, vegetables and automotive fuel” to get a better picture of the “persistent inflation pressures in the economy”. The main weaknesses with this method is that there can be “large temporary movements in components of the CPI that are not excluded” and volatile components can still be trending up (as in energy prices) or down.
The alternative trimmed-mean measures are popular among central bankers. The authors say:
The trimmed-mean rate of inflation is defined as the average rate of inflation after “trimming” away a certain percentage of the distribution of price changes at both ends of that distribution. These measures are calculated by ordering the seasonally adjusted price changes for all CPI components in any period from lowest to highest, trimming away those that lie at the two outer edges of the distribution of price changes for that period, and then calculating an average inflation rate from the remaining set of price changes.
So you get some measure of central tendency not by exclusion but by giving lower weighting to volatile elements. Two trimmed measures are used by the RBA: (a) “the 15 per cent trimmed mean (which trims away the 15 per cent of items with both the smallest and largest price changes)”; and (b) “the weighted median (which is the price change at the 50th percentile by weight of the distribution of price changes)”.
While the literature suggests that trimmed-mean estimates have “a higher signal-to-noise ratio than the CPI or some exclusion-based measures” they also “can be affected by the presence of expenditure items with very large weights in the CPI basket”.
The authors say that in the RBA’s forecasting models used “to explain inflation use some measure of underlying inflation (often 15 per cent trimmed-mean inflation) as the dependent variable”.
The special measures that the RBA uses as part of its deliberations each month about interest rate rises – the trimmed mean and the weighted median – also showed moderating price pressures.
So what has been happening with these different measures?
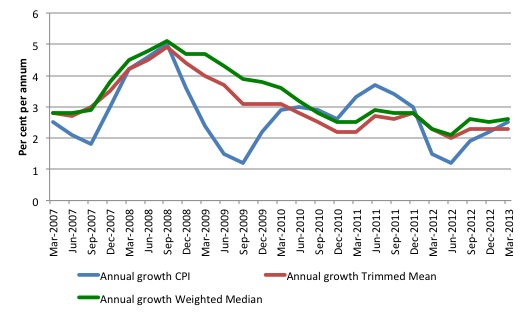
The following graph shows the three main inflation series published by the ABS over the last 24 quarters – the annual percentage change in the all items CPI (blue line); the annual changes in the weighted median (green line) and the trimmed mean (red line). The RBAs inflation targetting band is 2 to 3 per cent (shaded area).
The CPI measure of inflation (at 2.3 per cent is down from 2.4 per cent in the June-quarter 2012) is in the lower half of the target band, while the RBAs preferred measures – the Trimmed Mean (2.3 per cent and stable) and the Weighted Median (2.3 per cent up from 2.5 per cent) – are also well within the RBAs band of 2 to 3 per cent.
The data indicates a moderating inflation environment notwithstanding the spike in the September-quarter 2013.
But if we dig a little deeper a different picture emerges.
Annualised growth calculations are affected by two things: (a) the current value, and (b) the base or starting value. If there is an unusually low observation in the base quarter then the current annual inflation rate will appear higher than it might otherwise be once we take the influence of the unusually low base quarter.
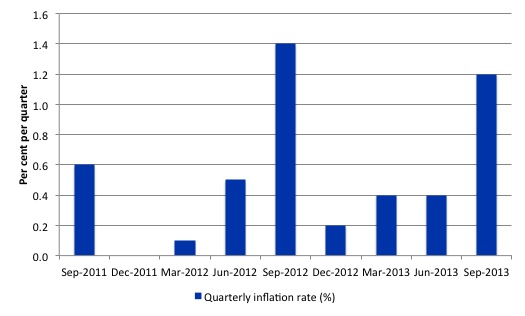
It turns out that the September-quarter 2012 result (1.4 per cent) was such a quarter (check it in the graph below). This distorts the annualised inflation calculation for the next three quarters.
The quarterly growth in the headline CPI (the ALL Groups) for the September-quarter 2013 was 1.2 per cent (compared to the trimmed mean and weighted median growth of 0.7 and 0.6 per cent, respectively). In seasonally-adjusted terms the All Groups CPI index rose by 1 percentage points in the September-quarter 2013.
The RBA-preferred measures – trimmed mean and weighted median – are also mostly stable.
How to we assess these results?
First, there is clearly no upward trend in any of the measures. The “core” measures used by the RBA have been benign for many quarters despite the budget deficit and swings in interest rates (up and down).
Second, it is clear that the RBA-preferred measures are well within their inflation-targeting band. It is unclear whether what the RBA considers when determining their interest rate decision each month, but given inflation is benign, it may turn its attention to the failing labour market and ease interest rates as a result of that.
Not that the real economy is very sensitive to movements in rates anyway, given that it is hard to discern who wins and who loses from rate changes (the distributional effects across fixed income recipients, creditors and borrowers) and hence it is hard to work out the overall impact on aggregate demand. We know the effect is lagged, uncertain and within normal ranges probably small.
Third, the underlying price pressures (say from wages) are within the space provided by productivity growth. There is no inflation threat in Australia arising from wages at present.
Fourth, the falling Australian dollar has added some pressure to the domestic price level. While it is difficult to say how much, given that other factors (government charges) are also implicated this quarter, the reality is that the impact is slight.
It will also not be sufficient to push inflation beyond the upper-limits of the RBA inflation targetting range. I suspect the international impact will be smaller than that given the slowing economy.
How will the RBA respond? The popular press (which is really just the conflation of a few telephone calls that the journalists make to their mates in the financial markets) was saying yesterday, for example, that the – Inflation jump rules out hope of rate cut.
I would guess differently. The data doesn’t suggest that the interest rates are too low at present and the RBA would have to be leaning on the side that there is some more room before Xmas to cut again.
The deputy governor of the RBA gave a presentation – Investment and the Australian Economy – to conference in Melbourne today and noted that there non-mining investment in Australia was “quite weak”.
He said that:
In the non-mining sector, however, investment has been quite weak. Indeed, as a share of nominal GDP, non-mining private business investment is currently around 3 percentage points lower than its average over the period from 2005 to 2008 and it is not much above levels seen in the early 1990s recession. And if we take into account public investment, which is also low, then total non-mining investment, as a share of GDP, is below the trough that was recorded in the early 1990s. In this sense, the profile for non-mining investment in Australia is not dissimilar to the profile for overall investment in many of the developed economies.
He had earlier indicated that there had been an “investment drought” in most developing nations since 2008.
He said that the RBA considered the combination of a lower Australian dollar, improved business confidence (where is that coming from?) and low interest rates would help restore non-mining investment.
But it is clear the RBA is acknowledging the sluggish growth environment in Australia and will bias their outlook to lower interest rates if the labour market continues to deteriorate in October.
In that regard, if the labour market data is poor in early November, then, given the benign inflation outlook, the RBA is likely to cut interest rates by 0.25 basis points before Xmas.
I would note that the reliance on monetary policy reflects the dysfunctional ideologically-motivated dislike for fiscal policy in Australia (and elsewhere). Like other nations, economists have convinced governments that the counter-stabilisation role should be taken by monetary policy.
The new Treasurer’s obsession with “fixing the budget” (that is, cutting net government spending) will see the federal government contribution to growth continue to decline.
It will be very difficult to get the federal budget back into surplus while private spending growth is weak and by attempting to do so, it is likely that the government will further undermine private confidence.
So we are in this situation where the Government is deliberately undermining growth and pushing unemployment up, which is forcing the RBA to use inferior counter-stabilising tools (interest rate management) to stop a recession. The end result is a sluggish economy, rising unemployment and a bias towards pushing up household debt.
The latter point is important. The private domestic sector is presently carrying too much debt and that explains its subdued spending patterns (and the rise in the saving ratio). The Government’s policy is relying on private spending to fill the gap left by the contraction in public spending, given that any expected export revenue growth will be insufficient to drive growth.
The strategy thus relies on the same dynamics that led to the crisis in the first place – too much private debt and inadequately-sized deficits.
What is driving inflation in Australia?
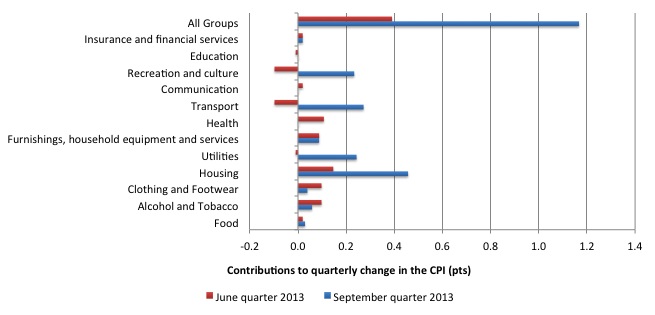
The following bar chart compares the contributions to the quarterly change in the CPI for the September-quarter 2013 (blue bars) compared to the June-quarter 2013 (red bars).
The ABS reports that for the September-quarter 2013, the largest price rises were for automotive fuel (+7.6 per cent), international holiday travel and accommodation (+6.1 per cent), electricity (+4.4 per cent), property rates and charges (+7.9 per cent), water and sewerage (+9.9 per cent) and domestic holiday travel and accommodation (+3.5 per cent).
The ABS reports that for the September-quarter 2013, the largest offsetting price falls this quarter were for vegetables (-4.5 per cent).
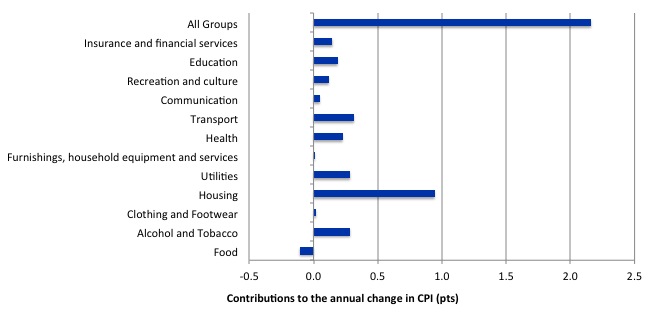
The next bar chart provides shows the contributions in points to the annual inflation rate by the various components.
In the twelve months to September 2013, the major drivers of inflation were housing, transport, alcohol and tobacco and utility prices.
The overwhelming conclusion is that there is no evidence that there is any likelihood of an inflation outbreak in Australia at present.
Inflation and Expected Inflation
The fear of inflation, in part, drives this mis-placed faith in monetary policy over fiscal policy.
If we went back to 2009 and examined all of the commentary from the so-called experts we would find an overwhelming emphasis on the so-called inflation risk arising from the fiscal stimulus. The predictions of rising inflation and interest rates dominated the policy discussions.
This May 2009 New York Times article by US monetarist economist Allan Meltzer – Inflation Nation – is representative.
Meltzer claimed that the “printing money” obsession of the Federal reserve and the high deficits “could see a repeat of those dreadful inflationary years”.
In all these terror stories two words dominate “could” and “may”. They impart images of danger and dysfunction to the reader but hedge with these conditional-type words. The fact is that there was no basis for those predictions in 2009 and four years later inflation is benign or falling other than where some cartel controls the supply-price.
Meltzer said:
Besides, no country facing enormous budget deficits, rapid growth in the money supply and the prospect of a sustained currency devaluation as we are has ever experienced deflation. These factors are harbingers of inflation.
When will it come? Surely not right away. But sooner or later, we will see the Fed, under pressure from Congress, the administration and business, try to prevent interest rates from increasing. The proponents of lower rates will point to the unemployment numbers and the slow recovery. That’s why the Fed must start to demonstrate the kind of courage and independence it has not recently shown.
There is a difference between deflation (a negative inflation rate) and a decelerating inflation rate, which the US is experiencing. But the so-called harbingers of inflation have not led to accelerating inflation, which is really what Meltzer is predicting “sooner or later”.
Right around the world, these sort of predictions came to nought because they were made by people who didn’t really understand how the macroeconomy works.
The RBA is now having to deal with providing some support for aggregate spending, which is in retreat, rather than trying to reign spending growth in with higher rates.
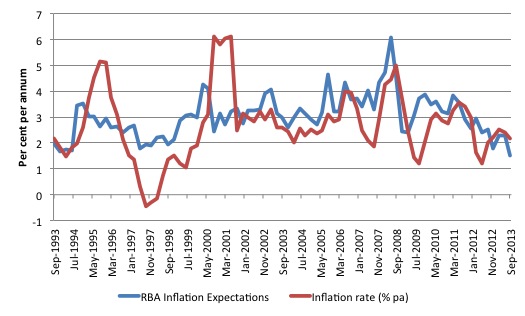
The following graph shows the RBA inflation expectations series – Other Price Indicators – G4 – and the actual inflation rate (annual percentage changes) – Consumer Price Index – G2from the September-quarter 1993 to the September-quarter 2013.
Notwithstanding the systematic errors in the price expectations series, the price expectations (as measured by this series) are trending downwards in Australia, which will influence a host of other nominal aggregates such as wage demands and price margins.
Despite the spike in inflation in the September-quarter 2013, expected inflation fell sharply. This will also condition the RBA’s interest rate decision and bias the setting downwards.
Conclusion
Inflation in Australia is trending downwards despite the occasional spike. On an annualised basis, inflation is in the lower-bound of the RBA’s inflation targetting range.
The RBA-preferred measures are benign and inflationary expectations are falling.
The data continues to suggest that the national economy is slowing as a result of excessively tight fiscal policy and declining private spending.
That is enough for today!
(c) Copyright 2012 Bill Mitchell. All Rights Reserved.
Bill, note the quarterly inflations peak in September each time?
Now refer to what the RBA says were the significant price rises in
2011
2012
2013
Note the common factor of electricity – now doubt after the usual July price increases.
Also property rates and charges & water and sewerage.
All necessities.
Thanks,senexx,for pointing out the electricity factor. This reinforces my opinion that the electricity supply industry in Australia is a monumental clusterfart from generation through distribution to retail.
Generation is using the wrong fuel – coal and gas rather than nuclear. Distribution appears to be in the best condition but it is being blamed for price increases. The grid has to be maintained in a working condition and that costs. State owned distributors regularly syphon off profits into their consolidated revenue and the private distributors have to make exorbitant profits to satisfy their shareholders,board members and executives.
Retail is a ripoff. Recently my retailer,AGL,hiked the service charge by nearly 100%. There is good money in paper shuffling,apparently.
The nation is in a sorry state when an essential and vital service like electricity supply becomes a plaything for fools and shysters.
Who said privatising Electricity wouldn’t work? It’s working very well by the looks of things. Unless you are a consumer.
A wee bit off topic, however, I am curious as to what tools the central bank could employ to fight inflation and just how effective they would be?
Thanks
Totally off topic but I wanted to send you this link about Manchester University economic students re-writing their course syllabus:
http://www.theguardian.com/business/2013/oct/24/students-post-crash-economics
Is the Reformation in Economics beginning to go mainstream?
Let me state up front, I agree with the MMT prescriptions to reduce unemployment, including the MMT prescription of a Job Guarantee. I think the JG-budget deficit approach needs to be combined with a reining in of credit money creation by the banks. This credit money creation drives much of our asset inflation.
I am not sure that inflation is quite as benign as Bill claims and credit money creation is the main culprit. I submit that our inflation is consistently and deliberately under-measured by modern practice. Governments have a vested political interest in under-measuring inflation just as they have a vested political interest in under-measuring unemployment. Government pensions and other welfare payments are reduced by inflation-creep as measured CPI is less than real CPI.
How are our inflation numbers rigged low? They are rigged low by manipulating the basket and excluding many costs that are important to the majority of households. They may also be rigged low by the hedonic index method. Perhaps Bill might want to comment on whether headline inflation figures are rigged just like headline unemplyment measures.