I have been a consistent critic of the way in which the British Labour Party,…
UK economy grows and so does its budget deficit
So the UK grew by 0.6 per cent in the June-quarter 2013 on a seasonally-adjusted basis. The conservatives are crowing as hard as they can that fiscal austerity has cleared the decks for a private sector recovery. We believe them of-course because the economy grew by 0.6 per cent. Right? Wrong. We don’t believe them. The fact is that the budget deficit rose in the last year and the annualised growth of the government and other services sector to growth has been positive in the last two quarters after a sharp contraction in the fourth quarter of 2012. On July 25, 2013, the British Office of National Statistics released its latest National Accounts data in the form of – Gross Domestic Product Preliminary Estimate, Q2 2013. The data release comes on the back of another ONS release – Public Sector Finances, June 2013 – which showed that budget deficit and public borrowing rose over the 12 months to June 2013. So the direction in public net spending is up and that is the opposite direction to the intended fiscal austerity.
In the last few days I received several E-mails suggesting that I was avoiding commenting on the latest ONS data release because it was apparently inconsistent with what I have written in the past. I didn’t respond to those E-mails but was amused.
Apparently conservatives read my blog which is progress.
The facts are that the data came out on Thursday UK time, which means I would start to analyse it next morning Australian time. On Friday’s I am working on our textbook as has been my practice for many months now. Then the weekend came and no blogs other than the Quiz. Then on Monday, I just had to write about Marriner Eccles after reading through his archives for some weeks.
And … I didn’t want to be bored yesterday. I have a long flight this morning (4 hours) and so to go with the boredom of that I thought some symbiotic boredom arising from writing up my views on the latest British national accounts would be in order.
So, no, I wasn’t hiding out licking any mortal wounds.
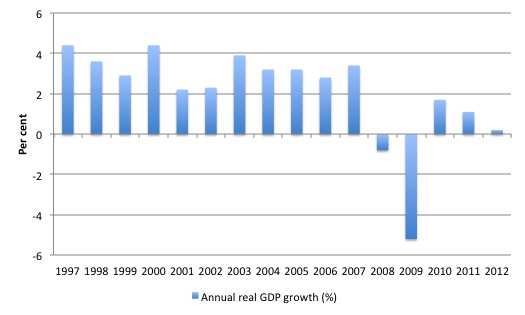
The following graph shows the annual real GDP growth for the British economy from 1997 to 2012. It puts the current period into some perspective (the last four years have been abysmal).
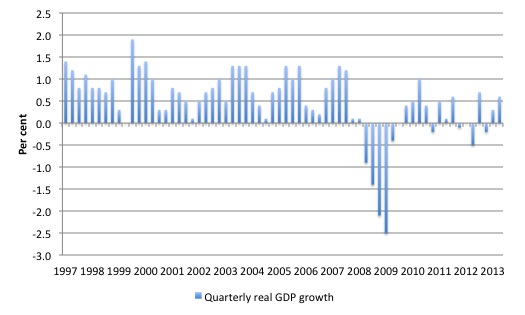
The next graph shows the quarterly real GDP growth for the British economy over period – 1997Q1 to 2013Q2. So some signs of growth in the last two quarters are evident.
I thought the UK Guardian article (July 27, 2013) – George Osborne’s description of the economy is near-Orwellian – was the most instructive commentary that I read in the mainstream media.
The by-line said it all – “The fact that even Labour accepts the UK is ‘on the mend’ shows how low our expectations of economic performance are”.
The Guardian author (Ha-Joon Chang) notes that:
If all else fails, they say, you can always lower your standards. This is what we have become used to doing in relation to the UK economy. The UK’s economic performance since the start of the coalition government in May 2010 has been so poor that Thursday’s announcement of 0.6% growth in the second quarter of 2013 was greeted with a collective sigh of relief.
The public debate has been so grinding that we (royal we) are willing to accept that prolonged unemployment at 7-8 per cent (nearing 30 if you are Greek) is normal. Celebrate if it comes down 1/10 of one percentage point – that seems to be a success these days.
Celebrate if real GDP growth shows any sign of growth. That seems to be the norm these days.
The question is whether the growth reported in the June-quarter 2013 is the trend for the future or whether it is another false dawn
First, the data is preliminary and will definitely be revised. My bet is that it is optimistic and will be revised downwards somewhat but the quantum won’t alter the assessment. That is, the revisions won’t be large given past history.
ONS tells us that:
The preliminary estimate of GDP is produced using the output approach to measuring GDP and is published less than four weeks after the end of the quarter to which it relates. At this stage the data content of this estimate is around 44% of the total required for the final output based estimate. This includes good information for the first two months of the quarter, with an estimate for the third month which takes account of early returns to the monthly business survey of 44,000 businesses (which typically has a response rate of between 30-50% at this point in time). The estimate is therefore subject to revisions as more data become available, but between the preliminary and third estimates of GDP, revisions are typically small (around 0.1 to 0.2 percentage points), with the frequency of upward and downward revisions broadly equal.
Second, how does a 0.6 per cent quarterly growth rate (or 1.4 annualised – Year-on-Year) stand historically? Is that reasonable for the 22nd quarter after the most previous peak was reached? Where does that place the British economy in terms of that previous peak?
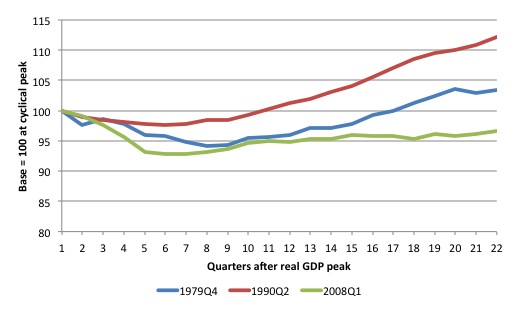
To help answer these questions, the following graph compares the last three British recessions. It shows the movement in seasonally adjusted British GDP for the last three recessions (peaks in 1979Q4, 1990Q2 and 2008Q1).
The respective troughs were 94.1 (quarter 8), 97.6 (quarter 6) and 92.8 (quarters 6 and 7). The 1980 recession took longer to reach the trough but once growth resumed in the 9th quarter of the downturn, there were no subsequent contractions. The UK economy reached its previous peak (1979Q4) after the 17th quarter (1983Q2).
The current downturn is marked by the severity of the collapse – 7.2 per cent of real GDP was knocked off within 6 quarters – and the stalled recovery. The growth under the Labour Government on the back of its fiscal stimulus came to an end soon after the current Conservative coalition took office.
It should also be noted that within the period of tenure of the current government, a major sporting event (the Olympic Games) occurred, which provided a growth surge.
The graph shows that on the back of the deficit stimulus the British economy resumed growth in the third-quarter 2009 and growth continued until the third-quarter 2010 (that is, the 11th quarter after the peak).
The current British government was elected half-way through the second-quarter 2010 (May) – the 10th quarter after the peak – and in June announced a package of austerity measures, which to be scaled in over the next few years.
The problem was that the announcement itself damaged private sector confidence and the deficit was not sufficiently large enough to support increased growth in the face of the private spending contraction.
In terms of the respective recessions, after 22 quarters, the British economy was 3.4 per cent above its previous 1979Q4 peak, 12.2 per cent above the 1990Q2 peak and remains 3.3 per cent below the 2008Q1 peak.
In the 12 quarters that the current government has been in office, the real GDP index (relative to 100 at the 2008Q1 peak) has risen from 94.7 to 96.7. That is not a result that deserves any cocksure celebration.
Ha-Joon Chang writes:
Including the last quarter, the UK economy has grown by just 2.1% during the 12 quarters since the current government came to power. This compares very poorly with the 2% growth that the economy had managed in just four quarters between the third quarter of 2009 and the second quarter of 2010. The coalition blames this poor performance on the eurozone crisis. But this argument is not very persuasive when output has more than recovered to pre-crisis level in many eurozone countries, including France and Germany, while UK output is still 3.3% less than what it was at the beginning of 2008.
It gets worse. During the past five years, the UK’s population has grown by 3%. This means that, on a per capita basis, the country’s income is 6.3%, not just 3.3%, less today than it was five years go. This performance is far worse than what Japan managed during its infamous “lost decade” of the 90s. At the end of that period, Japan had a per capita income 10% higher than at the start.
The average growth rate between the March-quarter 2000 and the March-quarter 2008 (the last peak) was 3.2 per cent. That is more or less the trend rate of growth for the British economy.
An annualised rate of growth of 1.4 per cent (as at the June-quarter 2013) should be considered against that trend performance.
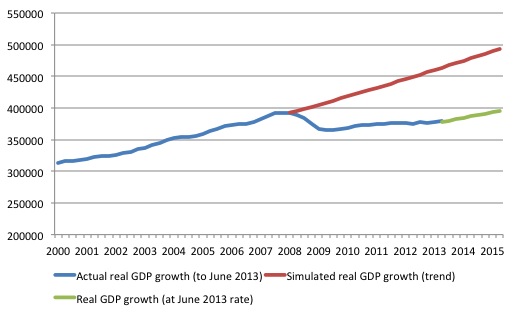
The following graph shows the actual real GDP growth (blue line) from the March-quarter 2000 to the June-quarter 2013 relative to what the trend would have produced without the recession (red line) out to the June-quarter 2015. The green line is what will happen if the current June-quarter growth rate (1.4 per cent per annum) was as good as it gets.
The output gap from trend (the gap between actual real GDP and trend GDP expressed as a percentage of trend) is a staggering 18.1 per cent. Since the current government took office in Britain, the gap has widened from around 12 per cent to its current value. At the current rate of growth that gap will continue to widen until we decide that the British economy has entered a new lower growth trend.
Does Britain really want to celebrate that as a sign that the policy framework is appropriate?
Larry Elliot’s UK Guardian article (July 28, 2013) – New direction needed to lead us out of Wongalan – notes that:
The reality is that in the summer of 2013 we have a low-investment, low-wage, low-productivity and low-growth economy. And there’s little to suggest the outlook will change any time soon. Almost four-fifths of the jobs created in the UK over the past three years have been in industries where the wage is below £7.95 an hour. Over the same period, business investment as a share of national output has fallen from 8% to 5%, one of the lowest in the industrialised world.
One of the consequences of the drawn out recession and tepid recovery is that it skews the economy towards this low-wage/low-productivity future. At present, labour is relatively cheap and firms are reluctant to invest in new productive capital, which means that output per head falls.
This has exacerbated the trends in the British economy, which Margaret Thatcher accelerated (despite claiming the opposite) by biasing growth towards the unproductive financial sector.
The attacks on the trade unions has cheapened labour and the growth of the financial sector skewed investment funds towards speculative financial assets and away from core investment in productive capital.
The upshot a bleak future for Britain.
Ha-Joon Chang concludes that:
… describing the UK economy as being “on the mend” is a near-Orwellian redefinition of economic recovery. The fact that most people accept that description, even if with reservations about the uneven distribution of its benefits, shows how low the standard of performance we expect of the UK economy has become.
He then goes on to speculate whether the June-quarter results are a sign of a sustained recovery. He concludes that the risks are downward.
1. The fragile state of the world economy is identified as a risk factor. The US economy avoided the “worst form of austerity policy” and as a result, “has recovered from the 2008 crisis more strongly than the European countries”. But the political impasses over debt ceilings and the results of the sequester will possibly kill growth in the US.
Further, the “Chinese economy has visibly slowed down” as have Brazil and India.
2. Within Britain, “the asset bubbles that have developed in the stock market and the property market, fuelled by cheap credit” may derail growth.
The booming “property markets in London and the south-east are beginning to look inflated” but have “provided important sources of demand in the UK economy in the past few years”.
Whether all that turns out to be correct is another matter.
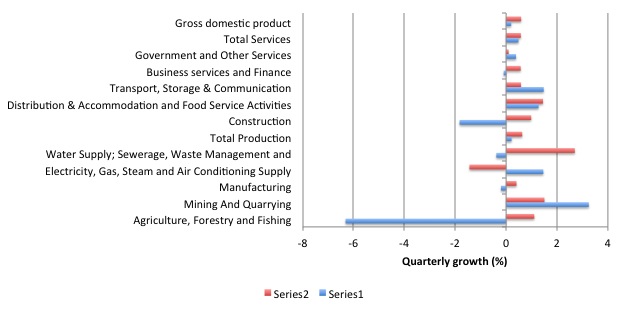
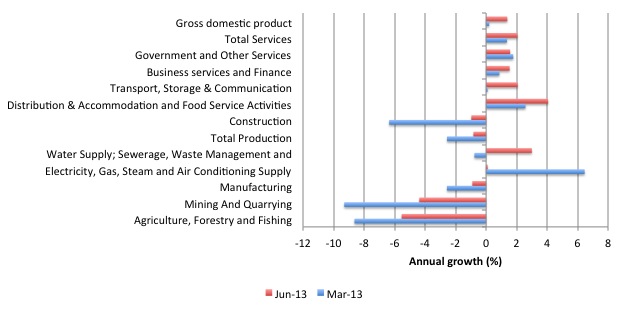
The industry growth outcomes are shown in the following two graphs – the first, quarterly growth by sector, and the second, annual growth by sector.
The June quarter sees a contribution from all sectors, which is a hopeful sign.
The comparison with the quarterly growth figures in the graph above help you to see what is different in the last quarter relative to the last year. The answer is that several industries have made a comeback this quarter – particularly construction.
The swing in construction is, in part, being fuelled by an emerging housing boom in the better-off areas of the nation.
The Government hoped that a private debt recovery would drive growth and to some extent that seems to be happening. But the danger is that this is just returning to the pre-crisis period dynamic and the next crash will be worse than the last.
Note that Government and other Services continues to deliver positive growth and is making a small contribution to overall growth.
The other reason why I don’t see this as a victory for the fiscal austerity camp relates to the direction of the deficit.
From the ONS publication – Public Sector Finances, June 2013 – we read:
… public sector net borrowing in June 2013 was £12.4 billion, which is £0.5 billion higher than public sector net borrowing in June 2012
This is the figure that you get when all the fudges that the UK government has been engaged in lately are excluded. Please read my blog – Fiscal austerity is self-defeating – for an explanation of the way the numbers have been obscured over the last few years.
The point is that the direction in public net spending is up and that is the opposite direction to the intended fiscal austerity.
This is not to say that the changes in government policy have not been damaging to certain cohorts etc. But I am a macroeconomist and the absolute deficit indicates the macroeconomic effect.
And that effect is supporting growth not causing contraction.
So one is unable to conclude that the growth figures validate the fiscal austerity ambitions of the Government. Lets see if there is growth if they really start cutting their net spending significantly.
Conclusion
The data clearly shows that the British economy is avoiding a triple-dip recession at present. The budget deficit is still large enough to support growth and the fiscal austerity proposed and implemented hasn’t been able to reduce the deficit to any great degree.
The longer the deficit remains at this level (or preferably larger) the better the chance is that private spending will start to pick up.
But for an economy that has been through a 25 per cent depreciation the growth outcomes are very modest and vulnerable.
Further, to celebrate these results indicates how low the expectations have become.
That is enough for today!
(c) Copyright 2013 Bill Mitchell. All Rights Reserved.
“It should also be noted that within the period of tenure of the current government, a major sporting event (the Olympic Games) occurred, which provided a growth surge.”
And a Royal Wedding
And the Diamond Jubilee
Both of which incurred state spending which was required by a particular time – like the Olympics.
Similarly the Royal Baby will spark a round of memorabilia spending, etc but probably little state spending.
There have been plenty of convenient excuses for state spending.
“Lets see if there is growth if they really start cutting their net spending significantly.”
Or the auto-stabilisers back off. If we are pushing growth via another unsustainable housing boom, then tax receipts should start to rise on profits.
Profits which I feel are unlikely to be shared with workers via decent wage rises.
I presume you’ll all have seen the articles about the zero-hour work contracts now becoming prevalent in the lower reaches of the UK economy.
All the profit from those contracts nicely subsidised by Tax Credits and other ‘in work’ benefits, while other firms with less Victorian employment processes suffer a Gresham Effect via this unfair competition.
The general tone of reaction seems to be that all sides find this form of exploitation unacceptable – which is at least encouraging.
But it is yet another argument for The Job Guarantee.
Could this be next for Britain as well?
Greece to end free police protection for rich …. Wealthy Greeks fearing attacks by anarchist groups will no longer be entitled to free police bodyguards in the latest cost-cutting plan from a government trying to meet budget targets set by international creditors.
Bill,
Any thoughts on the compensation paid by UK banks for mis-selling (Barclays £450 million provision for PPI + swaps cited in their latest need to raise funds?) also acting as helicopter money improving private spending power min the UK?
Is there an idiots guide to what is austerity and what is stimulus.
If we are making very few cuts, spending +5% deficit, spending money on Olympics and stuff like that.
What exactly does a stimulus budget look like?
Serious question!