I grew up in a society where collective will was at the forefront and it…
Cutting unemployment benefits in the US will not decrease unemployment
Earlier this week I looked at the latest vacancy data for Australia released by the Australian Bureau of Statistics – Latest Australian vacancy data – its all down to deficient demand. I also took the time to update my data for the US Bureau of Labor Statistics – US JOLTS database, which provides detailed information about job openings and quit rates. The results for the US are similar to those found in Australia. But the data is apposite given the decision by the State of North Carolina to cut unemployment benefits – thinking that this act of cruelty will somehow reduce their appalling unemployment rate. It won’t.
My last blog on the US JOLTS database was – Mass unemployment – its all about demand.
The JOLTS data allows us to explore the evidence-base for the view that “unemployment is a deeply entrenched supply-side problem” and that the provision of “unemployment benefits increases unemployment”. As part of the policy response then, it is argued that benefits should be cut (or eliminated – depending on how extreme (rabid) your views are) and that deregulation and attacks on trade unions will prevent unemployment from rising in the future.
The summary of the blog is simple and perhaps I should leave it there without putting out the argument or the evidence: The view is entirely false and is illogical in theory and has no empirical support in practice.
That response doesn’t mean I ignore or exclude supply-side issues as being part of the solution. But all the supply-side policies that work do so when they are applied in the context of paid employment.
The mainstream continually invokes the imagery that somehow the demand and supply-sides of the labour market are independent of each other. That allows them to define neat equilibrium solutions which lead them to telling economics students that wage cuts and pernicious welfare-to-work remedies are required to cure mass unemployment.
I love the JOLTS database because it in such a simple way provides incontrovertible evidence of how wrong the supply-side conception of mass unemployment is – all in a few time series.
Unfortunately, the legislators in the State of Virginia clearly don’t log into the US Bureau of Labor Statistics all that often to study the latest data. Because they have determined that the way to cure their dreadful unemployment problem is to cut unemployment benefits and starve the unemployed into a job.
The problem is there is no credible theory that relates starvation with an increased capacity to gain employment when the economy is some millions of jobs short of the level necessary to provide work for all those who desire it.
Forget the smallest margin of unemployed who do not want to work. They are of a second-order of smallness that doesn’t warrant attention. The overwhelming majority (comprising millions of citizens) want to work but cannot find work because it is not to be found.
Why not? Because there is a lack of spending in the economy. Firms create employment in response to demand for their products. They might be confronted by millions of desperately hungry workers who have just had their benefits cut but they still won’t put them on because there is insufficient demand to justify expanding production.
And if all the states try to follow the example and there is a widespread cut in benefits, then sales will drop even further and unemployment will rise not fall because aggregate spending declines.
Paul Krugman addresses this issue in his most recent New York Times article (June 30, 2013) – War on the Unemployed, which is worth reading.
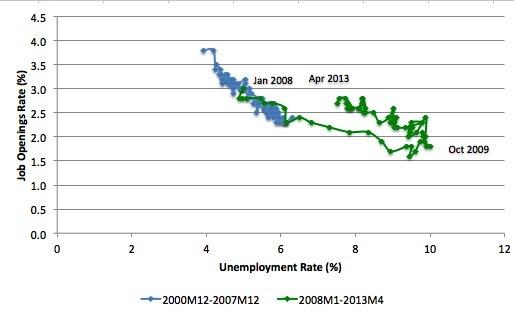
To start the discussion, it is useful to look at the US version of the Unemployment to Vacancies curve (where vacancies are the Total Non-Farm Job Openings as a percent of the Labour Force).
The following graph shows two periods – the first, December 2000 to December 2007, and the second, January 2008 to April 2013. The two periods combined cover the entire span of the JOLTS data. The segments are pre-crisis and post-crisis (where December 2007 was the peak of the last cycle).
Refer to the blog – Latest Australian vacancy data – its all down to deficient demand – for a conceptual discussion about how to interpret this framework in terms of movements along curves and shifts in relationships.
Basically, the UV (or Beveridge) curve shows the unemployment-vacancy (UV) relationship, which plots the unemployment rate on the horizontal axis and the vacancy rate on the vertical axis to investigate these sorts of questions.
The Beveridge curve is named after the British economist William Beveridge who was influential in defining the full employment agenda in the Post World War 2 period in the UK (and, arguably in most advanced nations).
The logic is that movements along the curve are cyclical events and shifts in the curve are alleged to be structural events. So a movement “down along the red curve” to the south-east suggests a decline in the number of jobs available due to an aggregate demand failure, while a movement “up along the red curve” indicates improved aggregate demand and lower unemployment. If unemployment rises in an economy where there are movements along the UV curve it is referred to as “Keynesian” or “cyclical” unemployment – that is, arising from a deficiency in aggregate demand.
The mainstream search literature (for which Nobel Prizes have been awarded) claims that “shifts in the curve” (out or in) indicated non-cyclical (structural) factors were causing the rising falling unemployment. The prize winners claimed this meant that if the UV curve was shifting out then the labour market was becoming less efficient in matching labour supply and labour demand and vice versa for shifts inwards.
The factors that allegedly “cause” increasing inefficiency are the usual neo-liberal targets – the provision of income assistance to the unemployed (dole); other welfare payments, trade unions, minimum wages, changing preferences of the workers (poor attitudes to work, laziness, preference for leisure, etc).
The problem is that this view is at odds with the evidence.
As is the case in most advanced countries, the shift in the curve occurred during a major demand-side recession – that is, it has been driven by cyclical downturns (macroeconomic events) rather than any autonomous supply-side shifts.
This recently published (May 2013) Public Policy Brief from the Federal Reserve Bank of Boston – A Decomposition of Shifts of the Beveridge Curve – examines the factors that might explain the shift in the UV (Beveridge) curve in the US.
It takes the following brief:
The apparent outward shift of the Beveridge curve-the empirical relationship between job openings and unemployment-has received much attention among economists and policymakers in the recent years with many analyses pointing to extended unemployment benefits as a reason behind the shift. However, other explanations have also been proposed for this shift, including worsening structural unemployment.
I haven’t time today to fully analyse the argument presented in the paper but the conclusion is clear:
Exploration of the evolution of job openings and unemployment using recent data on unemployed persons decomposed by their reason for unemployment, which determines their eligibility to collect benefits, suggests that up to half of the increase in the unemployment rate relative to the fitted Beveridge curve is explained by job leavers, new entrants, and re-entrants- those who are ineligible to collect unemployment benefits … the evidence from the decompositions suggests that the increase in the unemployment rate relative to job openings will persist when unemployment benefit programs expire.
As part of this narrative they spend hours convincing us that federal income support for the unemployed destroys the, already weak, initiatives of the recipients and should be cut (or abandoned altogether).
They promote socio-pathological policies, which undermine the viability of the unemployed to live even the most modest material life, and dress these indecencies up as strategies to incentivise the jobless to do more to look for work.
The supply-side story starts with the textbook model of the labour market which claims that employment and the real wage are determined in the labour market at the intersection of the labour demand and the labour supply functions.
The equilibrium employment level is constructed as full employment because it suggests that every firm who wants to employ at that real wage can find workers who are willing to work and every worker who is willing to work at that real wage can find an employer willing to employ them.
Frictional unemployment is easily derived from this Classical labour market representation, as is voluntary unemployment.
Holding technology constant, all changes in employment (and hence unemployment) are driven by labour supply shifts. There have been many articles written by key mainstream economists (such as Milton Friedman) that argue that business cycles are driven by labour supply shifts.
The essence of all these supply shift stories is that quits are constructed as being countercyclical – that is, rise when the economy is in decline and vice-versa – despite all evidence to the contrary.
They have to argue this because the shifts in employment have to come from the supply-side.
One such story that is still told is that the business cycle swings are characterised by swings in voluntary unemployment. So a downturn in employment (and a rise in unemployment) arises – allegedly – because workers develop a renewed preference for more leisure and less work and the supply of labour at each real wage level thus moves inwards (that is, workers are now less willing to supply the same hours of labour as before at the going real wage).
So they quit their jobs and head to the beach and relax.
The provision of unemployment benefits – so the story goes – increases the attractiveness of leisure. Why they get to lie on the beach, sipping their champagne and get paid to do it (courtesy of the income support). Who wouldn’t take that option?
Well most nearly everybody wouldn’t take that option but that is an inconvenient reality. Even the sociology of all this is wrong – given the evidence from countless studies that tell us how the unemployed have to endure alienation, shrinking social networks and a collapse in self-esteem.
The upturn in economic activity – so the story goes – is characterised by workers developing a new thirst for work and so the supply curve shifts out again – that is, they are willing to supply more hours of work than before at the same real wage levels. Apparently, they get sick of leisure and gain a new appetite for BMW cars, big watches, and ski-holidays with all the apres activities that accompany them.
And at the empirical level this theory predicts that quits will fall as employment falls.
The simplest fact then, which would give support to this notion of supply-side shifts, is whether the quit rate is, indeed, counter-cyclical – as the theory predicts. That is, does the quit rate rise when the unemployment rate rises or not. Simple enough.
Lester Thurow in his marvellous book from 1983 – Dangerous Currents – knew different and challenged the mainstream view by asking:
… why do quits rise in booms and fall in recessions? If recessions are due to informational mistakes, quits should rise in recessions and fall in booms, just the reverse of what happens in the real world.
The reference to “informational mistakes” is another version of the mainstream supply-side story. The narrative goes that the central bank/treasury can temporarily buy a reduction in unemployment (below what the neo-liberals refer to as the natural rate – another myth) – by inflating the economy with spending.
As economic activity picks up both money wages and prices rise (typical story about too much money chasing too few goods). The trick is that they claim that the rate of increase in money wages is less than the rise in prices and so the real wage falls.
Firms react to the declining real wage by offering more employment – because they know that marginal labour productivity is lower (another myth).
But why do workers agree to supply more labour when the real wage is falling? After all the textbook labour market model tells us that the labour supply curve is upward sloping in terms of the real wage because workers will only supply more labour if the relative price of leisure (which is the real wage) rises.
Another trick to this story then is that the entire supply of labour shifts because workers think that the real wage has risen – they get beguiled by the rise in money wages into forming the view that they are better off per hour than before and so the quit rate falls and employment increases.
Hence, for a time (a short time), the economy can operate at unemployment levels lower than the natural rate.
How long can this go on for? Well, how long does it take for workers to go down to the shops and realise that everything is more expensive now and, in fact, they are worse off than before (because the real wage has fallen)?
Accordingly, once they learn the truth, the labour supply curve shifts back in and workers withdraw their labour en masse (the quit rate rises again) and employment and economic activity falls back to the “natural” level.
The lesson that is hammered hometo students that this all demonstrates how futile policy interventions that aim to lower the unemployment rate are. The only way the “natural” rate can be lowered (if at all) is for policies to be designed with reduce structural impediments in the labour market. What are they? For example, cut the subsidy to leisure (the unemployment benefit). etc.
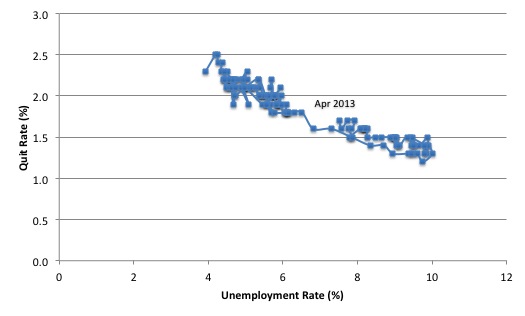
The US Bureau of Labour Market JOLTS database includes estimates of the quit rate. The following graph shows in a compelling way that the quit rate (non-farm quits as a percent of total non-farm employment) behaves in a cyclical fashion as we would expect – that is, it rises when times are good and falls when times are bad.
The graph relates the quit rate (vertical axis) to the unemployment rate (horizontal axis). There are no shifts evident in this relationship just movements along a fairly defined inverse relationship.
That is, when the unemployment rate rises, the quit rate falls. Exactly the opposite to that predicted by the supply-side story which means that their claim that causality runs from unemployment benefits to higher quits to higher unemployment is pure and unadulterated bu&*s^$t …. (nonsense).
Many studies have demonstrated the phenomenon depicted in the last graph – for several countries where decent data is available.
Workers become very cautious when unemployment starts to rise and postpone any desired or planned job changes and opt for the security of their present job.
When there are more jobs being created and the hiring rate rises, workers then take more risks and the quit rate tends to rise.
Phase Diagram Analysis for the US
In my blog the other day – Latest Australian vacancy data – its all down to deficient demand – I introduced the notion of Phase Diagrams, which allow us to track changes in so-called attractor points across time. If there are major structural shifts in a relationship, the attractor point will shift. Please re-read that blog for more detailed discussion on the background to these diagrams.
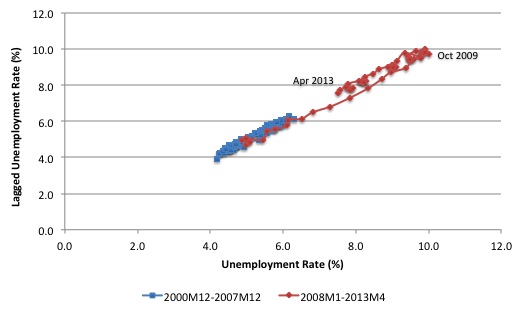
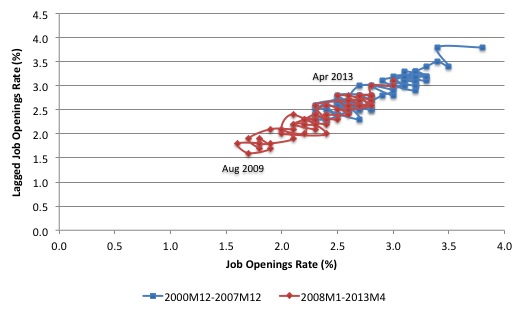
The following two phase diagrams show the current values of the respective time series plotted on the y-axis against the lagged value of the same series on the x-axis. The JOLTS data is from December 2000 to April 2013.
These scatter plots are helpful in four distinct ways:
First, the charts provide information on whether cycles are present in the data.
Second, the presence of “attractor points” can be determined. The points might loosely be construed as the middle of each of the traced-out ellipses.
Third, the magnitude of the cycles can be inferred by the size of the cyclical ellipses around the attractor points.
Fourth, the persistence (strength) of the attractor point can be determined by examining the extent to which it disciplines the cyclical observations following a shock. Weak attractors will not dominate a shock and the relationship will shift until a new attractor point exerts itself.
The first graph shows the phase diagram for the US unemployment rate while the second graph shows the phase diagram for the Job Openings Rate.
There is no sign that the unemployment rate attractor has shifted. The large oscillation is totally explained by the magnitude of the cyclical downturn.
As the economy has recovered somewhat, the relationship is moving back downwards in the same pattern that it rose.
It is also clear that the economy takes several years to recover from a large negative shock even if the attractor remains constant.
The next graph shows phase diagram for the Job Openings Rate. Same conclusion except that the relationship has shifted toward the origin in the crisis.
The supply-side analysis interprets the unemployment shift (and outward movements in the UV curve above) as indicative of a decline in labour market efficiency. The cure – structural adjustment aka labour market deregulation.
But using the same logic, we would interpret the inward shift in the vacancy relationship as a sign of increasing efficiency in the process that matches labour supply and labour demand (less unfilled vacancies are present at any time).
Clearly, both states cannot hold. The unemployment behaviour cannot be indicating a deteriorating structural efficiency while the vacancy relationship is depicting the opposite.
A consistent interpretation for both movements, which is the same conclusion we draw when examining similar trends in the Australian data is that the US economy has been demand constrained as a result of the collapse in private spending associated with the financial crisis.
It is remaining in that state as a result of the refusal of the polity to deliver an adequate fiscal expansion. The same findings can be found for other nations with the same explanation.
Other JOLTS evidence
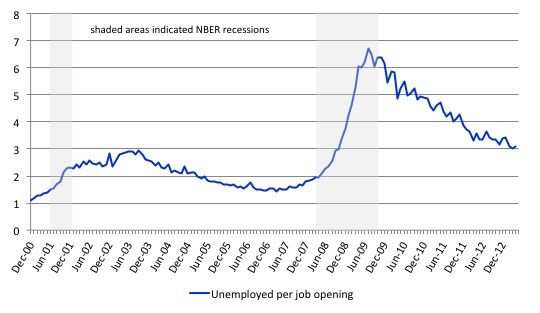
The following graph shows the total number of unemployed per job opening (non-farm and seasonally adjusted) and thus gives a measure of how strong the demand-side of the labour market (job openings) is relative to the number of people seeking work (the unemployed). It is an alternative way of presenting the relationships between unemployment and vacancies.
In 2010, the US Bureau of Labor Statistics described the data at that point in this way:
When the recession began in December 2007, there were 1.8 unemployed persons per job opening. The ratio rose to a high of 6.2 unemployed persons per open job, more than twice the highest ratio seen since the JOLTS series began … From the high of 6.2 unemployed persons per job opening in November 2009, the ratio fell to 5.0 in June 2010.
Since 2010, the ratio has been improving steadily as employment growth continues but it still has a long way to go before it reaches the pre-crisis levels where, at its lowest point (March 2007) there were 1.4 unemployed person per job opening.
At present the ratio is hovering around the low 3s but now seems to be levelling out at that level which implies the recovering is faltering.
Labour markets typically behave over the business cycle in an asymmetric manner as can be seen from the graph. The deterioration was sharp and rapid. The recovery is much slower and is all the more slow as the employment growth not only has to absorb new labour force entrants (arising from population growth) but also has to face the huge pool of unemployed that is caused by the recession.
One of the facts I repeat often is that the unemployed cannot search for jobs that are not there! This is exactly what happens when aggregate demand falls and job openings dry up.
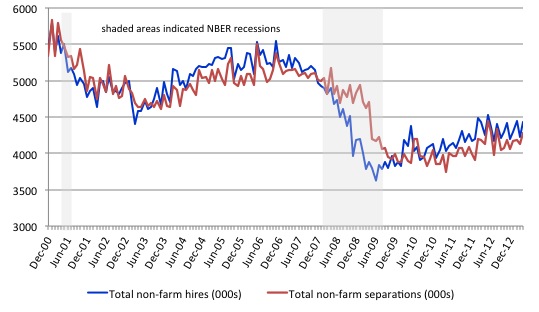
Another way of seeing how the job flows tell us about the direction of change is to compare layoffs with quits. The following graph shows the movements in hires and separations for the US economy as published by the BLS for the period from December 2000 to April 2013.
While labour markets are clearly dynamic in the sense that even in a downturn new jobs are being continually created and destroyed the rates of each dynamic change in a cyclical way. So while there were new jobs being created at the height of the downturn there was a severe shortfall of new jobs emerging as is shown in the graph.
Separations also fall for reasons noted above.
When the labour market is highly constrained by deficient aggregate demand the unemployment queue expands and the ordering of different demographic cohorts within the queue becomes significant. The workers who are more advantaged are able to transit in and out of jobs during a recession more easily than a low-skilled worker who may face prejudice and discrimination from employers.
The most recent data shows that while hiring and separations are showing that the recovery continues the improvement is modest. This is a scale effect. The rates are static.
The US labour market now locked into a situation where the tepid employment growth barely absorbs new entrants and the most disadvantaged workers are being trapped in long-term unemployment.
Accordingly, when there is an overall shortage of jobs, higher-skilled (more educated) workers tend to take jobs that were previously occupied by lower skilled workers. The low-skilled are then forced out into the unemployment queue. So there are two inefficiencies: (a) the skills-based underemployment; and (b) the unemployment.
Bumping down is one of the costs (inefficiencies) of recession – the part of the iceberg that lies below the water!
Please read my blogs – Full employment apparently equals 12.2 per cent labour wastage and More fiscal stimulus needed in the US – for more discussion on this point.
Further, the layoff and discharges rate also published in the BLS JOLTS database which reflects the demand-side of the labour market is also firmly counter-cyclical as we would expect. Firms layoff workers when there is deficient aggregate demand and hire again when sales pick-up.
Again this is contrary to the orthodox logic.
The clear significance of this behaviour is that the orthodox explanation of unemployment is not supported by empirical reality.
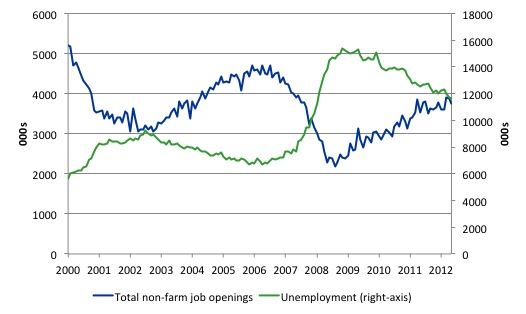
This graph shows job openings and unemployment from December 2000 to April 2013 (in 000s). Total unemployment (green line) is on the right-axis while total non-farm job openings (blue line) are on the left-axis. You can see that as the economy faltered job openings collapsed unemployment rose but not as much as would be predicted by the employment losses.
Why? Answer: Some workers gave up looking and left the labour force. As the job openings increased again in recent months, unemployment has been steady because the discouraged workers are now re-entering the labour force again.
All the evidence supports the conclusion that deficient demand not only increases unemployment in the downturn but also pushes people out of the labour force as they give up actively looking for work that is not there. These hidden unemployed workers re-enter the labour force as the probability of getting a job (in their mind) increases.
All the patterns depicted are entirely normal and are understood by those who can see beyond their ideologically-tainted conservative glasses.
One might adopt a view that they don’t care for the unemployed and would like to inflict punishment on them because of a personal dislike for whatever reason. But at least that motivation and viewpoint should be openly expressed rather than hidden by nonsensical economic theory, which denies basic reality.
While I would have contempt if the former view was expressed at least I would acknowledge the person was honestly presenting their (venal) preferences, which is a preferable state to what the conservatives actually adopt – given they generally lack spine on these matters.
Conclusion
The JOLTS data is very useful because it addresses some of the most simple claims made by the mainstream approach to unemployment. And the evidence is clear. There is no validity in the supply-side case that mass unemployment is somehow something to do with the unemployed being lured into leisure by excessive unemployment benefits or some other reason.
The evidence is consistent and strong – the mass unemployment in the US is the result of a systemic failure in that economy to produce enough jobs, which emerged as aggregate demand collapsed in early 2008.
Since then the economy has been starved of spending because the private sector is unwilling to take risks (and is deleveraging) and the government sector is caught in a conservative web of mindlessness after initially, in the face of a total meltdown in 2008, providing enough fiscal stimulus to kick start the economy.
It was a weak kick and the impacts are fading which is why the US economy is slowing rather quickly.
That is enough for today!
(c) Copyright 2013 Bill Mitchell. All Rights Reserved.
I suppose if workers were desperate enough then some sort of jobs would materialize. In Kenya many people are employed as night watchmen to stand around outside rich peoples houses all night. Perhaps the aim is to also get poverty in the (currently) developed world sufficiently extreme that the 1% can each employ a dozen night watchmen with minimal cost???
I have to say that I have learned all that I know that is important about economics from reading everything that I can written by you and others about MMT. But, I can assure you that when it comes to other people in NC that if you were given a stage with Rush Limbaugh discussing economic you wouldn’t stand a chance. It would be reason against emotion. I am amazed at the people I know that think that their situation has to do with race. Their idea seems to be that it’s not what can the government do for me and the community but that it is doing too much for the other guy. It has nothing to so with reason, it is all psychological. Remember, NC was Democratic for a hundred years because the Lincoln freed the slaves. Now it is mainly Republican because Johnson got civil rights legislation passed.
Stone,
Well done: you just stumbled across the reason why JG in the private sector works (though obviously some have political objections to private sector JG).
In other words even if there were no public sector at all, there’d always some employer prepared to pay SOMETHING, even if it’s only 1p or 1 cent a day for the services of unemployed individuals.
And that’s not to say Keynes was wrong to claim a GENERAL cut in money wages is self-defeating. The point is that the SPECIFIC INDIVIDUALS who are unemployed at any moment in time tend to be those whose skills and experience least suits available vacancies. So if the cost to employers of employing those individuals is cut, while the rest of the workforce stays on their existing wage, then the inflation / unemployment trade off improves. And I’m not saying that trade-off is of any big relevance just now, i.e. given the grossly excessive unemployment with which Bill deals above.
In other words given a decent rise in demand, and given a system under which the above “unsuitable” job applicants are subsidised into private sector work, then inflation would kick in at a lower level of unemployment.
“Perhaps the aim is to also get poverty in the (currently) developed world sufficiently extreme that the 1% can each employ a dozen night watchmen with minimal cost???” – stone.
That strikes me as a particularly insecure way for the rich to live. What happens on the night when the dozen impoverished nightwatchmen decide to slit the throats of the rich householders and make off with the food and other contents of the house? At some stage, when things get bad enough, that is what will happen.
Bill is asking why the workers and the poor of Greece do not rebel. I am not sure but I have my theories. I suspect that final, widespread, violent rebellion in societies only starts occuring about the time when a sufficient number (a critical mass of the populace) are starving or can see they face imminent starvation. Given the adequate supply and even over-supply of food in our Western societies it is taking longer to reach this starvation flash-point.
One would have hoped that other self-corrective processes would have occurred in democratic societies by now so that we do not have to go all the way down the starvation and violent revolution or disintegration path. However, a number of factors seem to be damping and blocking the effectiveness of democratic protest. The most obvious to me is the fact that no matter who we vote for (in Australia or Greece or anywhere else) we get a neoliberal government. Many national political systems (UK, US and Australia spring to mind) are one ideology states with a two party duopoly which supplies only the illusion of choice.
Today’s political parties remind me of those lollies called gobstoppers or jawbreakers. They come in bright colours, blue, red and so on but when you suck them they all turn grey and they all taste the same.
So, the deeper question to ask is “Why have we become one ideology states?”
The national public discourse is being controlled so only one story is being told. For every site like this one read by a few thousand people, the mainstream media pumps out propaganda (show, news, comment, advertisements: it’s all propaganda) absorbed and internalised by hundreds of millions and even billions now. For every economically and scientifically literate layperson there are 9 or even 99 who believe the most simplistic falsehoods and the most arrant anti-science nonsense pushed by the propaganda apparatus of capitalism.
At the root of it all is capitalism; the system that keeps on taking. The disappearance of Christmas in Greece is a good example. While crass materialism is to be deplored, real worthwhile material foods and goods are still the basis of life. Capitalism takes from the poor to give to the rich. Capitalism takes from the environment to produce unsustainable and very inequitably distributed wealth. The root of all the problems is this system. The outcomes are fully system conditioned. You cannot change these outcomes without fundamental root and branch change of the system.
However, I think the damage has gone too far. The current system has destroyed the environment to the point that no system, no matter how enlightened and equitable, can now sustain 7 billion people. Collapse and chaos seem to be the only possible outcome now. Country after country begins to follow this path. The Middle East and North Africe (MENA) is collapsing now.
“Collapse and chaos seem to be the only possible outcome now.”
Unfortunately, with the latest developments in computer science. Security and surveillance systems are already too advanced. The likely outcome for a developed country is a Facist, totalitarian state. A small cadre of elite politicians, economically powerful individuals and top command of large corporations will oversee public order. Relatively well rewarded judiciary and security personnel will willingly support the status quo.
We won’t have a chance……all communications will be monitored and analyzed using sophisticated AI algorithms to detect any dissent. There will be widespread use of survellience cameras and listening devices in public spaces. Even our homes. Sophisticated voice recognition software etc etc. Soon the storage and processing capacity of “the machine” will allow almost all our written, verbal and non verbal communications to be analyzed, targets identified and security personnel dispatched in almost real time.
The only question we need ask is this: What kind of life do the elites desire for us? Do they A) Want a minimum health, minimum education, whimpering, subservient slave class with all surplus labour terminated? Or do they B) Want to live within a larger more colorful and vibrant society. With wide diversity of human interaction, art, entertainment and passion.
I’m thinking the ignorant pigs want mostly A) with just a little bit of B) to spice up their weekends.
Cortina, there is much truth in what you say. The advanced states are moving to the totally controlled surveillance and security state. Less developed states will not be able to implement that strategy so the less developed states will collapse into chaos (warring factions, sectarian violence, warlords etc.)
Even advanced states will find in the long run that the energy and resource demands of running the total surveillance and security state are high and eventually unsupportable. The US continues to imprison a higher and higher proportion of its population. Clearly, this is an unsustainable trend in the long run. Incarceration is a very expensive business and entails all sorts of opportunity costs. You lose the productivity of labour from all the excessive incarcerations, you lose the productivity of labour of the guards, police and security agencies. All this labour is non-productive. You lose all the money, plant and equipment making and maintaining prisons. This is all a dead loss to the economy.
Eventually, the 99% can overwhelm te 1% and all their apparatus. Humans are still the most adaptable and flexible “machines” of all. Humans are all-terrain, mobile, intelligent and self-actuating “machines”.
President Obama/Council of Economic Advisers:
WE DEMOCRATS BLEW IT…..
The great mystery of the 2008 election is that the Democrats were handed a great gift-and they blew it…..it was a blunder with almost unspeakable adverse consequences…..
The great gift was both the opportunity, as well as the “legal authority”, to end unemployment in America-[and as well offer a template for ending unemployment to the rest of the OECD countries, or wherever the scourge of unemployment disrupts the social order-the unemployment rate was 13.2% in Cairo on 7/2/13….].
First, the “unspeakable adverse consequences”: When the Democrats failed to fix unemployment-particularly since this was a campaign promise in the 2008 election-the American people responded with a vengeance in the 2010 election-ushering in radical right wing extremists in statehouses, all across America, and including a glut of radical extremists in the House….
And given that 2010 was a census year-it gave these new radical majorities the ability to gerrymander districts and thus assure a plethora of radical nut cases for years to come-it even raises the question:
Can America survive this Democrat blunder?
The fact is, we have on the books-as I write, and also true in 2009–the legal “authorization” to limit our unemployment to “3%”-[15 USC § 3101]– i.e., at no time should our unemployment rate in America exceed 3%!
And yet, we had only a lone Democrat–Representative Conyers from Michigan-who understood the importance of listening to the American people-and provided legislation to act on our “authorization”, on the books, to fix our unemployment crisis in America, i.e., deficit-neutral, Pro-Market HR 870-
It raises the question: Why didn’t the Council of Economic Advisers pull together every resource to explore implementation of this “authorization”-[and why don’t they do it to this day]–rather than doing a “me too” to the failed Republican blather about job creation: HR 2847?
The lesson from HR 2847 [and The Jobs Act] is that: IT DOESN’T WORK!
According to the CBO-given our current path and trajectory-it will be 2017 before we get back to an even anemic 5.5% unemployment rate-with unemployment benefits long since expired-and if the Market fails, the unemployed are out of luck!
In short, the path we should be on is: FIX UNEMPLOYMENT AND THIS WILL FIX THE MARKET, RATHER THAN THE OTHER WAY AROUND…..
See: FULL EMPLOYMENT IS A PRO-MARKET CONCEPT, on Amazon/Kindle
Jim Green, Democrat opponent to Lamar Smith, Congress, 2000
@ Prof Mitchell: I cannot comment on the JOLTS data specifically.
But I am mystified that neither you, nor Steve Keen nor the MMT people such as Michael Hudson ever seem to question the underlying accuracy of any and all US labor data.
….
[BILL EDITED COMMENT BY DELETING REFERENCES TO SITES THAT I FIND NO INTEREST IN PROVIDING LINKS WHICH VARIOUSLY CLAIM THE “the US government lies about everything incl. labor data”]
….
I extend my scepticism to EU labor data as well. but that is another story.
Dear Arrhenius (at 2013/07/08 at 4:17)
There is a long history of accusations that governments deliberately fudge the data coming from their national statistics authorities for political and ideological reasons. There is no doubt that politics and ideology influences what is collected (for example, no agency collects data on surplus value).
But if you have worked or know about the processes that the US Bureau of Labor Statistics (or any of these agencies) go through to produce the data then you would find it hard to believe that these agencies receive directives to cover up the situation by producing survey evidence that is fraudulent.
I am suspicious of everything but I understand the work of these agencies and I believe within the limitations they are beset with they produce fair results.
Economists who understand the data know the statistics are limited – especially those such as the unemployment rate. We comment on that all the time.
best wishes
bill
Dear Prof Mitchell
you appear to be resting your case upon what is known as the Appeal to Authority, in this case the postulated bona fides and veracity of Western OECD government authorities.
These have been helping since 1979 to implement the neoliberal policies you rightly condemn.
You will also be aware of internal management directives to massage data at IMF and World Bank; even “The Economist” has addressed this topic now and again over the (many) years. It is thus not clear why such directives could not be issued within US Govt.
You might object that such manipulation would have seen the light of day. But Bradley Manning was one of 400,000 with authorised access to what he has revealed, the other 399,999 have kept quiet, Snowden is said to be one of 500,000.
That being so, covering up malfeasance in government -the threat of sacking or loss of pension is always useful – is surely the rule and not the exception.
Thus given that ex- US Treasury senior man Paul Craig Roberts has been known as the Father of Reagonomics, I find it more than odd that you chose to strip my previous mail of reference to his – in your view, iconoclastic- writings on faked US labor data. And to that of the experienced economist John Williams, with his mainstream vocational experience.
After all, with no disrespect to yourself, Roberts’ knowledge of US govt. data procedures is liable to at least equal yours.
Roberts was for years an Authority par excellence for post-1979 orthodox economists, even if you class yourself as heterodox. Hence an appeal by me to him should by virtue of “Appeal to Authority” be within your purview.
Concluding, as also in the case of persons refusing to address the civil engineering and avionics evidence underlying 9/11, it appears that you have adopted a position equivalent to: “If it Mustn’t Be True, then it Can’t be”. In the former arena this is known as “left-wing gatekeeping”.