I grew up in a society where collective will was at the forefront and it…
Mass unemployment – its all about demand
As I have said on enough occasions to earn the title of being a cracked record – the solution to mass unemployment is very simple – create enough jobs to satisfy the preferences for work of those who haven’t any. I attend a lot of meetings – here, there and everywhere – and listen to officials from governments and multilateral agencies say the same thing – “unemployment is a multifaceted, complex problem”. My response is always the same. No it isn’t. That sort of language – dissembling language – is just an excuse for saying that it doesn’t suit the dominant ideology to create the necessary jobs. Another simple fact is if the non-government sector cannot create the necessary jobs – well, ladies and gentlemen – there is only one other sector. Get over it. This blog reviews the latest release by the US Bureau of Labor Statistics of its – US JOLTS database – for December 2012. This data set sends some very clear and very simple messages about the causes of mass unemployment – and they all implicate the demand-side.
The other narrative that is spun at such meetings is that “unemployment is a deeply entrenched supply-side problem”. My response is always the same. No it isn’t. That response doesn’t mean I ignore or exclude supply-side issues as being part of the solution. But all the supply-side policies that work – do so when they are applied in the context of paid employment.
The mainstream continually invokes the imagery that somehow the demand and supply-sides of the labour market are independent of each other. That allows them to define neat equilibrium solutions which lead them to telling economics students that wage cuts and pernicious welfare-to-work remedies are required to cure mass unemployment.
I am reminded of those sort of meetings when certain data releases come out. Yesterday (February 12, 2013), the – US Bureau of Labor Statistics – released the latest data from their – US JOLTS database, the latest edition covers the period to December 2012.
I love this database because it in such a simple way provides incontrovertible evidence of how wrong the supply-side conception of mass unemployment is – all in a few time series.
In the new release accompanying the data release, the BLS note that:
There were 3.6 million job openings on the last business day of December, little changed from November … The hires rate (3.1 percent) and separations rate (3.0 percent) also were little changed in December.
Read: static.
The supply-side explanation propagated by the conservatives who will use any story to debate calls for government intervention centres on the claim that persistent unemployment is a structural problem. The story then makes the leap – if it is a structural problem then cutting aggregate spending will not impact on that problem.
One step further and the typical conservative or neo-liberal is back in Shangri La! – therefore, they tell us there is a need to impose fiscal austerity (except do not consider cutting any public spending that underpins their bottom line).
As part of this narrative they spend hours convincing us that federal income support for the unemployed destroys the, already weak, initiatives of the recipients and should be cut (or abandoned altogether).
They promote socio-pathological policies, which undermine the viability of the unemployed to live even the most modest material life, and dress these indecencies up as strategies to incentivise the jobless to do more to look for work.
The supply-side story starts with the textbook model of the labour market which claims that employment and the real wage are determined in the labour market at the intersection of the labour demand and the labour supply functions.
The equilibrium employment level is constructed as full employment because it suggests that every firm who wants to employ at that real wage can find workers who are willing to work and every worker who is willing to work at that real wage can find an employer willing to employ them.
Frictional unemployment is easily derived from this Classical labour market representation, as is voluntary unemployment.
Holding technology constant, all changes in employment (and hence unemployment) are driven by labour supply shifts. There have been many articles written by key mainstream economists (such as Milton Friedman) that argue that business cycles are driven by labour supply shifts.
The essence of all these supply shift stories is that quits are constructed as being countercyclical – that is, rise when the economy is in decline and vice-versa – despite all evidence to the contrary.
One such story that is still told is that the business cycle swings are characterised by swings in voluntary unemployment. So a downturn in employment (and a rise in unemployment) arises – allegedly – because workers develop a renewed preference for more leisure and less work and the supply of labour at each real wage level thus moves inwards (that is, workers are now less willing to supply the same hours of labour as before at the going real wage).
So they quit their jobs and head to the beach and pour the champagne.
The provision of unemployment benefits – so the story goes – increases the attractiveness of leisure. Why they get to lie on the beach, sipping their champagne and get paid to do it (courtesy of the income support). Who wouldn’t take that option?
Well most nearly everybody wouldn’t take that option but that is an inconvenient reality. Even the sociology of all this is wrong – given the evidence from countless studies that tell us how the unemployed have to endure alienation, shrinking social networks and a collapse in self-esteem.
The upturn in economic activity – so the story goes – is characterised by workers developing a new thirst for work and so the supply curve shifts out again – that is, they are willing to supply more hours of work than before at the same real wage levels. Apparently, they get sick of leisure and gain a new appetite for BMW cars, big watches, and ski-holidays with all the apres activities that accompany them.
And at the empirical level this theory predicts that quits will fall as employment
The simplest fact then, which would give support to this notion of supply-side shifts, is whether the quit rate is, indeed, counter-cyclical – as the theory predicts.
Lester Thurow in his marvellous book from 1983 – Dangerous Currents – knew different and challenged the mainstream view by asking:
… why do quits rise in booms and fall in recessions? If recessions are due to informational mistakes, quits should rise in recessions and fall in booms, just the reverse of what happens in the real world.
The reference to “informational mistakes” is another version of the mainstream supply-side story. The narrative goes that the central bank/treasury can temporarily buy a reduction in unemployment (below what the neo-liberals refer to as the natural rate – another myth) – by inflating the economy with spending.
As economic activity picks up both money wages and prices rise (typical story about too much money chasing too few goods). The trick is that they claim that the rate of increase in money wages is less than the rise in prices and so the real wage falls.
Firms react to the declining real wage by offering more employment – because they know that marginal labour productivity is lower (another myth).
But why do workers agree to supply more labour when the real wage is falling? After all the textbook labour market model tells us that the labour supply curve is upward sloping in terms of the real wage because workers will only supply more labour if the relative price of leisure (which is the real wage) rises.
Another trick to this story then is that the entire supply of labour shifts because workers think that the real wage has risen – they get beguiled by the rise in money wages into forming the view that they are better off per hour than before and so the quit rate falls and employment increases.
Hence, for a time (a short time), the economy can operate at unemployment levels lower than the natural rate.
How long can this go on for? Well, how long does it take for workers to go down to the shops and realise that everything is more expensive now and, in fact, they are worse off than before (because the real wage has fallen)?
Accordingly, once they learn the truth, the labour supply curve shifts back in and workers withdraw their labour en masse (the quit rate rises again) and employment and economic activity falls back to the “natural” level.
The lesson that is hammered hometo students that this all demonstrates how futile policy interventions that aim to lower the unemployment rate are. The only way the “natural” rate can be lowered (if at all) is for policies to be designed with reduce structural impediments in the labour market. What are they? For example, cut the subsidy to leisure (the unemployment benefit). Etc.
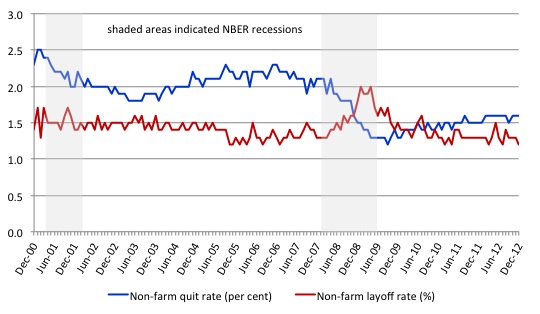
The US Bureau of Labour Market JOLTS database includes estimates of the quit rate. The following graph shows in a compelling way that the quit rate (non-farm quits as a percent of total non-farm employment) behaves in a cyclical fashion as we would expect – that is, it rises when times are good and falls when times are bad. Many studies have demonstrated this phenomenon for several countries where decent data is available.
The shaded areas indicate NBER designated recessions using their business cycle dating methodology.
Workers become very cautious when unemployment starts to rise and postpone any desired or planned job changes and opt for the security of their present job.
When there are more jobs being created and the hiring rate rises, workers then take more risks and the quit rate tends to rise.
The most recent data is also interesting. It is telling us that the US labour market is fairly static at present – in some sort of holding pattern.
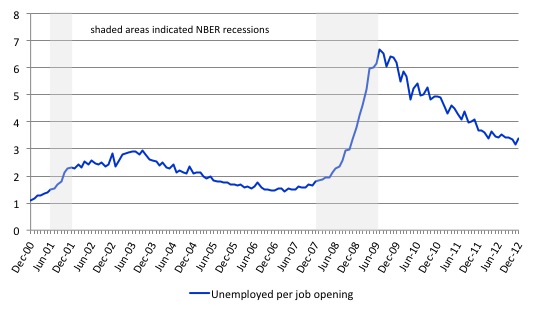
The following graph shows the total number of unemployed per job opening (non-farm and seasonally adjusted) and thus gives a measure of how strong the demand-side of the labour market (job openings) is relative to the number of people seeking work (the unemployed).
In 2010, the US Bureau of Labor Statistics described the data at that point in this way:
When the recession began in December 2007, there were 1.8 unemployed persons per job opening. The ratio rose to a high of 6.2 unemployed persons per open job, more than twice the highest ratio seen since the JOLTS series began … From the high of 6.2 unemployed persons per job opening in November 2009, the ratio fell to 5.0 in June 2010.
Since 2010, the ratio has been improving steadily as employment growth continues but it still has a long way to go before it reaches the pre-crisis levels where, at its lowest point (March 2007) there were 1.4 unemployed person per job opening.
At present the ratio is hovering around the low 3s but is – thankfully – continuing to fall.
Labour markets typically behave over the business cycle in an asymmetric manner as can be seen from the graph. The deterioration was sharp and rapid. The recovery is much slower and is all the more slow as the employment growth not only has to absorb new labour force entrants (arising from population growth) but also has to face the huge pool of unemployed that is caused by the recession.
One of the facts I repeat often is that the unemployed cannot search for jobs that are not there! This is exactly what happens when aggregate demand falls and job openings dry up.
There is still a long way to go for the US labour market because the ratio gets back to pre-crisis levels. It will require a substantial up-tick in employment growth and that should be the focus of the US government in the coming months.
It is hard to see the dysfunctional political system in the US having the wherewithal to deliver that need.
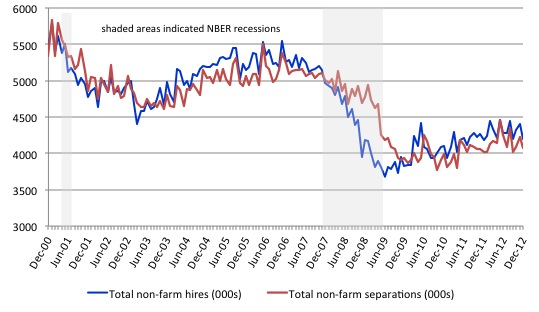
Another way of seeing how the job flows tell us about the direction of change is to compare layoffs with quits. The following graph shows the movements in hires and separations for the US economy as published by the BLS for the period from December 2000 to December 2013.
While labour markets are clearly dynamic in the sense that even in a downturn new jobs are being continually created and destroyed the rates of each dynamic change in a cyclical way. So while there were new jobs being created at the height of the downturn there was a severe shortfall of new jobs emerging as is shown in the graph.
Separations also fall for reasons noted above.
When the labour market is highly constrained by deficient aggregate demand the unemployment queue expands and the ordering of different demographic cohorts within the queue becomes significant. The workers who are more advantaged are able to transit in and out of jobs during a recession more easily than a low-skilled worker who may face prejudice and discrimination from employers.
The most recent data shows that while hiring and separations are showing that the recovery continues the improvement is modest. This is a scale effect. The rates are static.
The US labour market now locked into a situation where the tepid employment growth barely absorbs new entrants and the most disadvantaged workers are being trapped in long-term unemployment.
Accordingly, when there is an overall shortage of jobs, higher-skilled (more educated) workers tend to take jobs that were previously occupied by lower skilled workers. The low-skilled are then forced out into the unemployment queue. So there are two inefficiencies: (a) the skills-based underemployment; and (b) the unemployment.
Bumping down is one of the costs (inefficiencies) of recession – the part of the iceberg that lies below the water!
Please read my blogs – Full employment apparently equals 12.2 per cent labour wastage and More fiscal stimulus needed in the US – for more discussion on this point.
Further, the layoff and discharges rate also published in the BLS JOLTS database which reflects the demand-side of the labour market is also firmly counter-cyclical as we would expect. Firms layoff workers when there is deficient aggregate demand and hire again when sales pick-up. Again this is contrary to the orthodox logic.
The clear significance of this behaviour is that the orthodox explanation of unemployment is not supported by empirical reality.
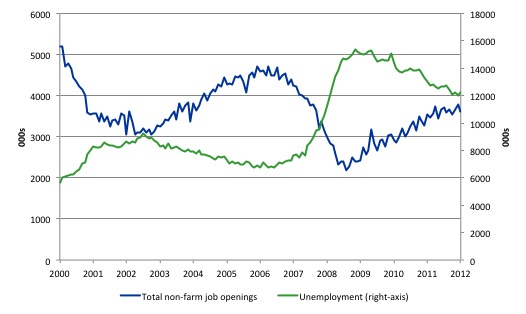
This graph shows job openings and unemployment from December 2000 to December 2012 (in 000s). Total unemployment (green line) is on the right-axis while total non-farm job openings (blue line) are on the left-axis. You can see that as the economy faltered job openings collapsed unemployment rose but not as much as would be predicted by the employment losses.
Why? Answer: Some workers gave up looking and left the labour force. As the job openings increased again in recent months, unemployment has been steady because the discouraged workers are now re-entering the labour force again.
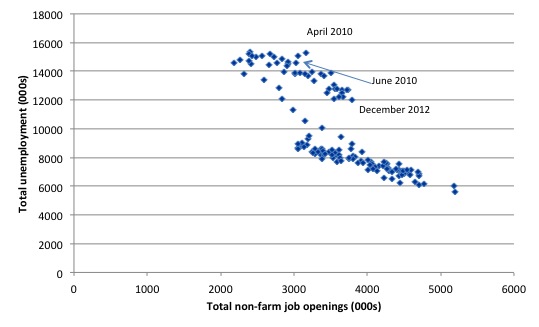
The following scatter graph allows you to see the shift in the job openings-unemployment relationship. As economic growth showed signs of resuming labour participation rates increased and this pushed unemployment up as employment growth resumed. Those cyclical adjustments always accompany the early stages of a recovery.
This is a reflection that the deficient demand not only increases unemployment in the downturn but also pushed people out of the labour force as they give up actively looking for work that is not there. These hidden unemployed workers re-enter the labour force as the probability of getting a job (in their mind) increases.
So this pattern is entirely normal.
Conclusion
I don’t have much time today as I have a lot of travel (typing this on the plane) and then a workshop later in Darwin.
Often aggregate data is not finely grained enough to allow us to get clear information that might lead us to support or reject a particular theoretical approach.
The JOLTS data is very useful because it addresses some of the most simple claims made by the mainstream approach to unemployment. And the evidence is clear. It is all downhill for that approach.
That is enough for today!
(c) Copyright 2013 Bill Mitchell. All Rights Reserved.
Mervyn King has delivered the usual inflation report nonsense:
“King again talks about the need for more supply side reforms and efforts to boost overseas demand for exports ”
Talk about broken record.
On 6 Feb, the FT describes an interview they did with Adair Turner who distinguished between different kinds of helicopter money – resting his distinction basically on public vs. private; yesterday, Martin Wolf was on about helicopter money, too. King continues to advocate what is fast becoming a retrograde position. Here are the FT links.
FT Editorial: http://www.ft.com/cms/s/0/30e2679c-6fa4-11e2-956b-00144feab49a.html
Wolf: http://www.ft.com/cms/s/0/9bcf0eea-6f98-11e2-b906-00144feab49a.html
As I understand it, BoE is legally permitted to do “helicopter drops” as fiscal adds that increase consolidated non-govt net financial assets in aggregate, but the Fed cannot do this in the same way due to legal restrictions, although “emergency powers” apparently covers a lot of ground. But the Fed would not be likely to do anything that would threaten its independence, and going all in with fiscal would definitely do more than raise some eyebrows in Congress. I don’t know anything about other countries in this regard. Clarification appreciated.
Neil Wilson,
How does King suggest we reconcile his domestic deflationary policies with possessing the world’s reserve currency? Tell the world to sod off?
The Right to Favourable Remunerated Work is included in the United Nations Universal Declaration of Human Rights as per:
Article 23.
(1) Everyone has the right to work, to free choice of employment, to just and favourable conditions of work and to protection against unemployment.
(2) Everyone, without any discrimination, has the right to equal pay for equal work.
(3) Everyone who works has the right to just and favourable remuneration ensuring for himself and his family an existence worthy of human dignity, and supplemented, if necessary, by other means of social protection.
(4) Everyone has the right to form and to join trade unions for the protection of his interests.
If one chooses a humanistic ethics following United Nations sponsored and developed concepts, then the first two criteria for political decision one takes are
– That universally inside the polity, the citizens of the state, Universal Human Rights are satisfied.
– That the Human Development Index – income, life expectancy, education – grows.
On Peter Martins site I read :”It’s not too far off the all-time best ratio of 2.5 unemployed chasing each vacant job.”
as a quote from 2010 on the Australian job market. Ie there is usually more than this number of people chasing jobs, and currently on today tonight a story on unemployed per job says darwin 0.4, sydney 2.5 and perth 3.1 per vacancy. Crikey has an article that says average is 4 seekers per vacancy – aus wide?
My point is we generally think of our unemployment rate around 5.x % to be as good as it gets in Australia, they call it full employment? Yet in USA with 7.5% unemployed and 3 seekers per job, having come down a long way – this suggests many are not serious about finding a job in Australia, they are happy to rely on permanent Government handouts. Like the USA many new jobs are lower paid and part time, but in Aus we can say leave it for the new migrant, after all the dole is not that much worse than a part time low skilled job. Time to say there is a limit on how long you can stay on the dole before making a contribution to the country.