I am travelling today to Tokyo and have little time to write here. But with…
Australian real GDP growth weakens and there is worse to come
When the March-quarter National Accounts data came out it showed very strong growth which seemed to run counter to the other indicators that were available at the relevant time. My blog – Australian national accounts – strong growth creates a puzzle – focused on the conflict between the poor employment growth and the strong GDP growth. Today – the Australian Bureau of Statistics released the – Australian National Accounts – for the June 2012 quarter and the results make much more sense. The Australian economy slowed in the June quarter and the growth performance was more consistent with the other indicators that we have at our disposable. The latest data available suggests that the slowdown in June has accelerated into the third-quarter but we will have to wait until December to verify that claim. Today’s data release also continues to demonstrate the growth impact of on-going budget deficits even if the Federal Government is doing what it can to undermine that contribution. Without the public sector contribution to real GDP growth, the overall outlook would look very weak.
The main features of today’s National Accounts release for the June 2012 quarter were (seasonally adjusted):
- Real GDP increased by 0.6 per cent after recording a 1.4 per cent increase in the March quarter (revised upward from 1.3 per cent).
- The main positive contributors to expenditure on GDP were Household final consumption expenditure (0.3 percentage points) , General government final consumption expenditure (0.3 percentage points), and Net exports (0.3 percentage points)
- The main negative factor was a contraction in inventories (0.3 percentage points) and a drain of 0.1 percentage points from falling dwelling investment.
- Our Terms of Trade (seasonally adjusted) fell by 0.6 per cent. This is on the top of a 4.3 per cent decline in the Terms of Trade last quarter, which confirms the view that the commodity price cycle has peaked and the Terms of Trade have been in decline for the last 6 months.
- Real net national income, which is a broader measure of change in national economic well-being rose by 0.7 per cent and that was partly assisted by the Federal Government’s carbon tax offset bonuses.
The ABC News story – GDP shows strong but slowing economic growth – quoted a bank economist as saying that:
From what we can identify, it seems consumption of services was less than what we are looking for. From our perspective we are not too bothered by that. The economy is still growing quite healthily and at the moment above trend …
It depends on how you express it. On an annualised basis – with the strong upwardly revised March quarter figure of 1.4 per cent – the economy is grew at 3.7 per cent up until the June quarter 2012, which is above trend of around 3.5 per cent.
But the June quarter result reveals a substantial slowing and the latest data, which will feed into the September quarter 2012 results (that is, describing what is going on now) suggests that the economy has slowed even below its June-quarter result. That indicates that the Australian economy is growing well below trend.
Remember that due to the long lag (around 12 weeks) that is involved in getting the national accounts data out the result represent a very rear-view of where the economy has been and when there is a turning point evident the results may not be reliable guide to what is to happen.
Overall growth picture
The following graph shows the quarterly percentage growth in real GDP over the last five years to the June-quarter 2012 (blue columns) and the ABS trend series (red line) superimposed. After the decline in trend growth was arrested by the fiscal stimulus in 2008-09 the decline in government support saw the dip in trend growth in 2010. Initially, growth in private investment helped drive the new rise in trend growth and that appears to have continued in the March 2012 quarter.
The average real GDP quarterly growth over the last year is 0.9
per cent (trend 0.9 per cent). Today’s data indicate that over the last year the Australian economy grew by a strong 3.6 per cent although that is somewhat influenced by the strong growth in the June 2011 quarter following the infrastructure funding to repair the damage from the natural disasters in early 2011 and the March-quarter result.
However, trend growth has been declining for the last three quarters of published data and as noted in the introduction the latest data is far from inspiring.
Real GDP growth and hours worked
One of the recent puzzles has been the sharp dislocation between what is happening in the labour market and what the National Accounts data has been telling us.
The Labour Force data for August 2012 comes out tomorrow and we will be able to see what has been happening over the last four weeks in the labour market.
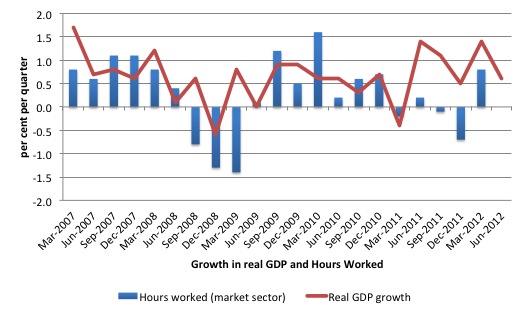
The following graph presents quarterly growth rates in trend GDP and hours worked using the National Accounts data for the last five years to the March quarter 2012.
You can see the major dislocation between the two measures that appeared in the middle of last year and persisted into the first-quarter 2012. Hours worked increased in the June quarter more in line with what we would expect.
Just in case you think the labour force data is suspect, the hours worked computed from that data is very similar to that computed from the National Accounts.

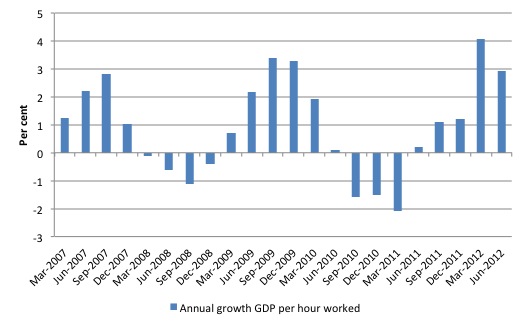
To see the above graph from a different perspective, the next graph shows the annual growth in GDP per hour worked (so a measure of labour productivity) from the March 2007 quarter to the June 2012 quarter. This also helps explain why employment growth was lagging when the real GDP growth was strong in the March quarter.
Growth in labour productivity means that for each output level less labour is required.
Contributions to growth
What components of expenditure added to and subtracted from real GDP growth in the March 2012 quarter?
The following bar graph shows the contributions to real GDP growth (in percentage points) for the main expenditure categories. It compares the March 2012 quarter contributions (grey bars) with the June 2012 quarter (blue bars).
First, note that without the government recurrent and investment spending of 0.5 percentage points, real GDP growth would have been close to zero.
Second, we must also factor in the carbon tax offset bonuses given to consumers as a political sop to neutralise the carbon tax (and largely neutralise the good that the carbon tax was designed to achieve). Household consumption contributed 0.3 percentage points of which some of that was the bouyancy resulting from the handouts. The most recent retail sales data (released last Monday) showed the spike in sales has now disappeared.
Interestingly, with all talk about the massive role that private investment has been playin gin real GDP growth, the June quarter result was poor (0.2 percentage points only).
The latest ABS data on investment intentions released last week confirmed that the coming quarters will see a slowing contribution to real GDP growth from private capital formation.
The good result is that net exports made a solid contribution to growth although once we take into account the net income transfers on the Current Account, the external sector will still be draining demand from the local economy.

Household saving ratio
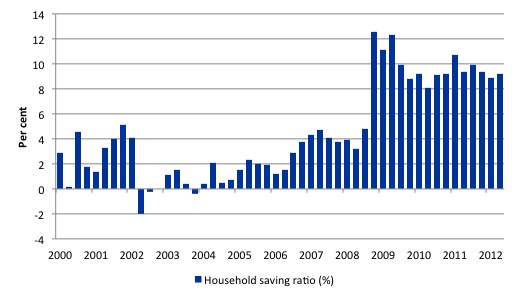
The following graph shows the household saving ratio (% of disposable income) from 2000 to the current period. The household sector is now behaving very differently since the GFC rendered its balance sheet very precarious. Prior to the crisis, households maintained very robust spending (including housing) by accumulating record levels of debt. As the crisis hit, it was only because the central bank reduced interest rates quickly, that there were not mass bankruptcies.
The household saving ratio is now steady around 9.2 per cent of disposable household income. It has averaged around 10 per cent since the crisis.
For the economy to continue to grow strongly while households are maintaining this higher levels of saving (from disposable income), public spending, private investment and/or net exports has to increase.
Clearly, the contribution from private investment is waning and the net exports contribution in the current quarter is not typical. It is lucky that despite the claims by the government that it is implementing an austere fiscal policy that the overwhelming majority of growth is coming from its consumption and spending decisions.
What this tells us is that the on-going budget deficit (despite the intentions of the government to sabotage it) is playing the role that it should in a monetary economy. It is supporting overal real GDP growth which is also ratifying the desires of the household sector to restore their pre-credit binge saving patterns.
Given that the household sector is now carrying record levels of debt as a result of the credit binge leading up to the crisis, we are unlikely to see a return to the low saving ratios that were evident in the period 2000 to 2005.
Which means that if private investment growth softens (which it surely will in coming quarters) and the government does realise its austerity ambitions, then households will only suffer lost national income but their saving desires will be thwarted.
Conclusion
Today’s National Accounts data has gone some way to resolve the puzzle from last quarter’s results. The employment growth data has been signalling that the labour market is weak while the national accounts data is telling us that we have been growing strongly. That gap in perception has been reduced with this data release.
Hours worked grew while real GDP slackened and the GDP per hours worked series is behaving consistently with that.
Today’s data should provide some cause for reflection for policy makers and others who are calling for major cuts in public net spending. As noted, the public sector contribution to growth was 0.5 percentage points. Without that contribution the overall growth result would have been very poor for this quarter.
The June quarter data combined with the official data we have available since tells me that the economy is still growing but well below trand and there will not be any significant dents in the high levels of labour underutilisation that are persisting (around 12.5 per cent).
With China now slowing and the Terms of Trade falling for another quarter, it is likely that the peak in commodity prices has passed and how that impacts on the upcoming investment plans is uncertain.
A fair bet is that intended investment will continue to weaken.
I wrote this sitting at London Heathrow waiting for another flight. Life is easier for a researcher these days!
That is enough for today!


Bill,
As always a great update.
One area which could boost GDP and employment over the next year is a resurgence in dwelling investment. Over the last several quarters dwelling approvals have been week as the RBA have left rates too high, trying to provide “room” for the CAPEX boom in mining etc. There is now room for the RBA to substantially lower rates (0. something), spurring dwelling investment which could offset some of the headwinds you mention.
I would very much like your thoghts on this matter.
“then households will [not] only suffer lost national income but their saving desires will be thwarted.”
This is one of the questions I have about the MMT approach – who wins in the battle of desires?
ISTM that the private sector has savings desires, and the government has budget desires, yet the government’s budget ‘leaks’ because of the presence of the automatic stabilisers.
So that seems to suggest that the private sector savings desires will win since those savings desires can cause government spending via a reduction in demand – triggering the auto stabiliser function.
Is it a matter of degree – that not all the savings desires will win because the auto-stabilisers are not strong enough?
@
Neil Wilson
I think it can go either way. Stabilizers can be reduced or abolished. In the U.S. we have one party which has enthusiastically announced its desire to eliminate them altogether, versus a party which has “reluctantly” decded they must be reduced. They’re figuring out how they can finally reduce deficits by spending cuts: undermine the stabilizers and the prboem goes away, along with an economy which works for anyone making less than $1 million a year.
Yes – does the loan create the deposit, or does the desire for a deposit create a loan?
No doubt when the Aust Government made an $8bn transfer to Households in 2009, part of the savings rate increased was a “desire” by government.
Have you been having a word with the ECB on your visit Bill ?
Mario Draghi expected to announce plan to buy unlimited quantities of government debt from troubled eurozone members