I started my undergraduate studies in economics in the late 1970s after starting out as…
Lies, damned lies, and statistics
Yesterday I promised to stay clear of analysing the US economy for a while given how much mis-information is flowing out of there. Today I break that promise to myself. Last week (July 7, 2011) the rabid US Republican Paul Ryan released a “House Budget Committee document” – The Debt Overhang and the U.S. Jobs Malaise – which drew on work produced by Stanford Professor John B. Taylor. You can sort of understand politicians who lie and embellish but when a text-book writing, senior economic professors misuses our art to misrepresent the situation you have to wonder. Whoever Mark Twain got that phrase “Lies, damned lies, and statistics” from they must have been reading Taylor’s blog in recent years.
Ryan’s document notes that:
Nothing is more critical to today’s economy than restoring real job and business growth. Yet for almost three years, the U.S. economy has remained mired in a slow-growth, high-unemployment trap. The so-called “recovery” feels more like a malaise than a rebound.
The ideology is embedded in this statement. Note the use of the qualifier “real” on jobs and the bias towards “business” rather than growth in general.
I would have said that nothing is more critical in today’s economy than restoring employment and real GDP growth. Then you can have a debate about what the composition of that employment and output should be as a separate discussion.
Ryan then asks:
The obvious question remains: “what is holding the economy back?”
In answering his question he cites the fact that recessions that originate from financial crises take longer to recover from. I have no problem with that view although I would say that the delay in adjustment is to be found in the private sector because there are private balance sheet issues typically to sort out which involve assets including housing. That process is inertia prone.
But there is no financial crisis that cannot be overcome with appropriate fiscal policy. Whether the crisis originates from ta financial crisis or a bout of negative expectations in the real sector doesn’t alter the fact that a real crisis arises because aggregate spending falls producers react by cutting output and employment, which multiplies throughout the spending system.
The specific nature of the origins of a crisis certainly has a bearing on how quickly private spending recovers which just means that public spending support has to be larger and maintained for longer in the case of a financial-turned-real crisis.
Recessions are about deficient aggregate demand. There is no mystery about that.
Ryan then claims that the real reason for the failure of the US economy to recover relates to:
… the enormous build-up of government debt that hastened the unsustainable course of U.S. Federal finances – has emerged as one of the main factors weighing down the economy.
While claiming that the fiscal intervention which the US government pursued “failed to deliver sustained economic growth and job creation” he concludes that “(t)he Keynesian playbook has not only been exhausted, its results have been discredited”.
I recall when I was doing my PhD in the UK during the 1980s – right in the centre of Maggie Thatcher’s Monetarist experimemt – how the monetarists would respond to the critics who pointed out that the economy was going backwards as they implemented the harsh policy regime that savaged pubic spending. Their standard response was that one could not judge their policies because they hadn’t been fully implemented. That is, the markets were not full deregulated and there was still “too much” government spending and taxation.
It was a nonsensical counter-factual. It was obvious that their assault on the public sector was damaging economic growth but then they just denied that the policy being implemented was true to the “theory”.
The coin has flipped. Now the conservatives are claiming that the “Keynesian” policies have failed because economic growth is still sluggish and unemployment remains extreme. Progressives should be saying that the on-going slump endorses the “Keynesian” emphasis on effective demand – which is still deficient. Why? Because the private sector is not spending and the public sector is not spending enough.
Ryan claims that :
The Keynesian economic policy hinges on the notion that the potential short-term benefit to economic activity from debt-financed government spending can outweigh the longer-term cost of higher government debt. Keynes famously discounted these costs by remarking that “in the long run, we are all dead.” There is a point, however, where the build-up in debt is so large that these longer-term fiscal concerns start to bleed into the present, impacting short-term economic activity.
As a matter of historical accuracy, the “in the long run, we are all dead” quotation, was not written in the General Theory (1936), the work which precipitated the “Keynesian” era of policy activism.
In fact, it was in the Tract on Monetary Reform, which was published by Macmillan twelve years earlier in 1924. At that time, Keynes was still an orthodox (Marshallian) economist who still held on to a belief that the Classical Quantity Theory of Money (QTM) was a viable explanation for inflation. At that time (in that publication) Keynes sounded like a modern day Monetarist-cum-inflation targetter, in that, he extolled the virtues of maintaining price stability as the principle goal of government although he was starting to articulate the value of public works programs to stabilise employment.
In Chapter 3 (The Theory of Money and the Foreign Exchanges) Keynes outlines the QTM and during that discussion said:
Now “in the long run” this is probably true … But this long run is a misleading guide to current affairs. In the long run we are all dead. Economists set themselves too easy, too useless a task if in tempestuous seasons they can only tell us that when the storm is long past the ocean is flat again.
By which he concluded that the growth in the money supply may not only impact on prices but also velocity (the turnover of the stock).
But more generally what exactly is the “longer-term cost of higher government debt”? No explanation is provided other than the hazy world of Ricardian Equivalence where people are scared of excessive tax burdens in the future so are saving to make sure they can pay their tax obligations.
As I have argued previously, once one enters this realm of reasoning you become lost in the land of make believe. Please read my blog – Ricardians in UK have a wonderful Xmas – for more discussion on this point. The theory of Ricardian Equivalence requires strict (impossible) assumptions to hold before it is logically consistent and has been demonstrated over the last 30 years to be empirically false.
The increase in public debt means that the private sector has more wealth stored in risk-free assets which at a time of extreme uncertainty is a good thing. Further, does Ryan really think that the debt-strapped private sector which is still trying to sort out the housing collapse (with more bad news certainly to come on that front) are bursting to spend and are just waiting for government to stop spending?
Does he really believe that all the firms that prosper from government contracts will suddenly invest as the public spending collapses and their client base evaporates?
Ryan also claims that the US is in danger of a debt crisis:
The extreme example is a sudden, full-blown debt crisis like the one that Greece is now experiencing.
The US government will never encounter a Greek-style crisis because it controls the central bank, issues its own currency and can spend whatever it wants without worrying about who will fund it.
Once a commentator conflates a sovereign currency-issuing nation with Greece you know they do not understand the finer points of monetary systems and how different ways of organising the currency have very different implications for the opportunity set available to government. In the EMU, that opportunity set is very restricted and the national governments do not have the capacity to deal with a large aggregate demand failure. In the US, the national government has all the financial capacity it needs to ensure real resources are being bid for and put to productive use.
The fact that a large proportion of available real resources in the US are lying idle (with the commensurate move into poverty) is evidence that the US government is not utilising its opportunity set in an appropriate manner.
So while Ryan is just another popularist ideologue who is appealing to the worst aspects of American life, some of the sources he uses to make his points are more culpable – in that they mis-use statistical and econometric tools and techniques to push a line that is not sustainable when more appropriate analysis is undertaken. These characters know that the “person-in-the-street” doesn’t know better and the lazy journalists and politicians will seize on anything “loud” to push their own lines without conducting appropriate due diligence.
Ryan uses a blog posting by Stanford economics professor John B. Taylor – Higher Investment Best Way to Reduce Unemployment, Recent Experience Shows – which was published in January 14, 2011. Taylor calls his blog Economics One, however if a first-year economics student submitted the text as an assignment I would fail it unless it was an essay demonstrating how not to use statistics and graphs.
I refrained from commenting on it at the time because it is so appalling. But now it is being touted in the public debate I considered I should put some text onto the public record pointing out the issues.
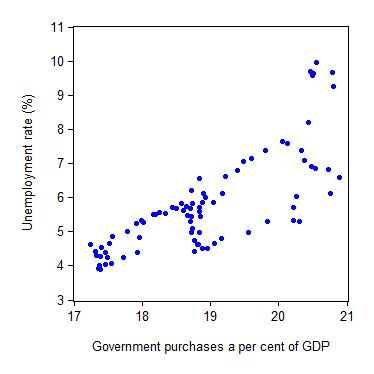
This is the first graph that Taylor provides:
There is no indication that lower government purchases increase unemployment; in fact we see the opposite, and a time-series regression analysis to detect timing shows that the correlation is not due to any reverse causation from high unemployment to more government purchases.
This is the replica of Taylor’s graph:
As anyone who has taken a first-year course in basic statistics knows, “correlation does not necessarily imply causation in any meaningful sense of the word.
The econometric graveyard is full of magnificent correlations, which are simply spurious or meaningless.” (quote from EViews 7 Technical Manual). EViews is a well-used econometric modelling software. Taylor’s graph were produced by that program given their “look”.
Among the standard time-series regression techniques “to detect timing” econometricians such as myself (and the mainstream in general) use what is known as Granger-causality analysis. For those not familiar with the term this description is taken from the EViews 7 technical manual says that:
The Granger … approach to the question of whether x causes y is to see how much of the current y can be explained by past values of y and then to see whether adding lagged values of x can improve the explanation. y is said to be Granger-caused by x if x helps in the prediction of y, or equivalently if the coefficients n the lagged x‘s are statistically significant. Note that two-way causation is frequently the case …
You might be interested in a paper I did in 1998 on this topic where I examined some of the spurious claims made about budget deficits, inflation and interest rates. You can read the working paper form for free (subsequently the paper was published in an academic journal but readership is restricted to subscribers) – here is the link to the paper – The Buffer Stock Employment Model in a Small Open Economy. It is a technical paper but now that you are experts in this sort of analysis you will be able to read it (-:
You can obtain annual and quarterly data from the excellent Interactive Data service from the US Bureau of Economic Analysis which publish the National Income and Product Accounts (NIPA). Specifically, I used the data in Table 1.1.5. Gross Domestic Product [Billions of dollars] Last Revised on: June 24, 2011 – Next Release Date July 29, 2011. The unemployment rate data comes from the US Bureau of Labor Statistics.
There is a debate among econometricians about the way in which these tests should be performed (in level form or difference form, for example). That debate is somewhat peripheral to the point here. But at least for the unemployment rate – it is already stationary because it is upper bounded (at 100 per cent) so it would go in as a levels variable anyway.
One of the problems with time-series econometrics is that the results sometimes are sensitive to lag structure of the models – that is, in English, how long back in the past you allow the variables to influence each other. It is standard to test these things using a variety of lags (I use 4, 8 and 12 given the data is quarterly and seasonally adjusted) so that you can make judgements about the sensitivity of your results to the lag structure.
Remember econometrics is an art not a science which always makes me feel better – I prefer to be an artist than a scientist.
Anyway, the results of some simple causality tests cannot conclusively eliminate the proposition that there is two-way causality between either expression of government spending scale (total or federal) and the unemployment rate – that is, reverse causality from the unemployment rate to the government spending ratio. The results are not definitive and are somewhat sensitive to the lags chosen.
What is the point here?
Building on yesterday’s blog (July 12, 2011) – The financial press mostly reinforces the lies – where it was clear that the rise in unemployment benefit payouts alone added significantly to total government outlays a proportion of GDP and that “Close to $2 of every $10 that went into Americans’ wallets last year were payments like jobless benefits, food stamps, Social Security and disability” we understand that in times of economic downturn government spending always goes up as a proportion of GDP even if it doesn’t rise much in absolute terms.
Even without doing the formal causality tests, it is obvious from examining the graphical evidence of movements in the government spending ratio, that the numerator (government spending) rises and the denominator (nominal GDP) falls.
Why would anyone be so stupid to impute that the higher government spending causes the high unemployment rates and that cutting government spending will reduce unemployment? I know that is the principle tenet of the “fiscal contraction expansion” crowd but it doesn’t bear scrutiny.
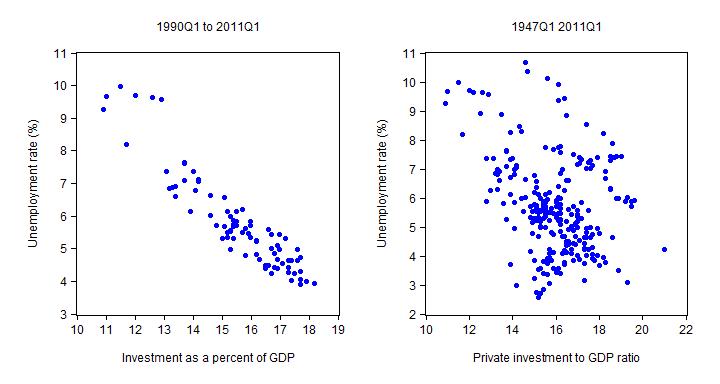
Taylor then produced his graph two which he says:
In sharp contrast, the data on spending shares show that the most effective way to reduce unemployment is to raise investment as a share of GDP. The second chart shows the relation between unemployment and fixed investment over the past two decades. Higher shares of investment are associated with lower unemployment.
I have reproduced his graph below (left-hand panel) and then in the right-hand panel I show the same relationship from the March quarter 1947 to the March quarter 2011. The relationship is a bit more complicated over the entire sample than in Taylor’s sample from 1990 to 2011. But the general point is clear – aggregate demand drives changes in the unemployment rate. Given consumption is relatively stable, then changes in the investment ratio provide a key dynamics to changes in aggregate demand.
It is obvious that unemployment is a problem of deficient aggregate demand rather than a supply-side issue relating to attitudes, skills etc. I am glad Taylor at least agrees with that. It is also clear that the investment ratio drives aggregate demand.
Here is another Working Paper that I wrote in 2001 with Joan Muysken – Aggregate demand should do the job – where we consider the role that aggregate spending – and the investment ratio in particular – plays in labour market outcomes.
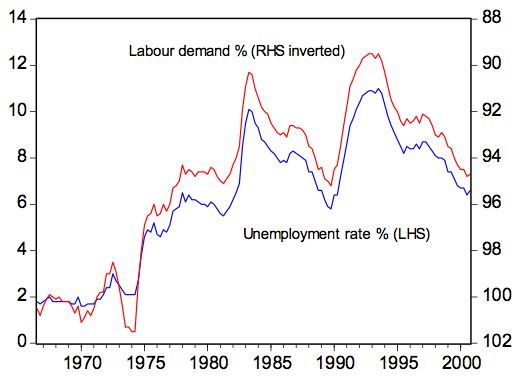
Here is a graph we produced in that paper for Australia from 1966 to 2001. It shows the unemployment rate on the left hand scale plotted against the sum of employment and vacancies (as a percentage of the labour force) as a measure of labour demand on the right hand scale (inverted). The correspondence between the two series is striking and a major part of the variation in the unemployment rate appears to be associated with the evolution of demand.
The relationship holds for the US and other economies. Indeed in a 2000 paper by Franco Modigliani (Modigliani, Franco (2000). “Europe’s Economic Problems”, Carpe Oeconomiam Papers in Economics, 3rd Monetary and Finance Lecture, Freiburg, April 6) there were similar graphs presented for France, Germany, and the United Kingdom, which shows that as job availability declines the unemployment rate rises, with the concomitant outcomes that the search process lengthens, as does the average duration of unemployment.
Modigliani (2000: 5) concluded, “Everywhere unemployment has risen because of a large shrinkage in the number of positions needed to satisfy existing demand.”
In the same paper, Modigliani, who introduced the term NAIRU to the economics profession in 1975 (Modigliani and Papademos, 1975) argued that:
Unemployment is primarily due to lack of aggregate demand. This is mainly the outcome of erroneous macroeconomic policies… [the decisions of Central Banks] … inspired by an obsessive fear of inflation, … coupled with a benign neglect for unemployment … have resulted in systematically over tight monetary policy decisions, apparently based on an objectionable use of the so-called NAIRU approach. The contractive effects of these policies have been reinforced by common, very tight fiscal policies (emphasis in original)
Another way of reflecting on Taylor’s claims is to pose the counter-factual – imagine if the private sector had to fund all the cyclical payments associated with an economic downturn – unemployment benefits, increased food stamps, increased spending in family court and other judicial tribunals (as families breakdown and crime rates rise), increased support for drug and alcohol abuse and increase mental and medical health issues?
Imagine if that was written into the constitution. Then the graphs would be very different.
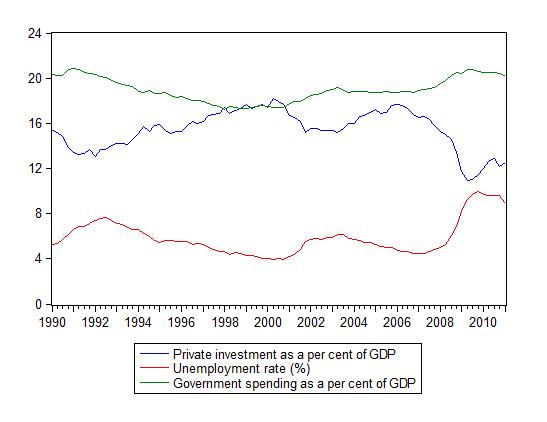
Finally, Taylor provided a graph showing the evolution of the investment ratio and the unemployment rate. I added a third variable – the total government spending ratio. He describes his graph in this way:
Either way you look at it, the relationship between unemployment and the investment share is remarkably close. It holds for both non-residential and residential investment, and is a subject of my current research. Of the four shares of GDP (the other two of course being consumption and net exports), the investment share shows by far the largest negative association with unemployment
I agree with that statement – as above – the dynamics of private investment drive the business cycle in a capitalist economy. That is no surprise at all. Government spending largely reacts to the swings in the business cycle. But the inclusion of the third time-series (government spending ratio) to graph lets you see things that Taylor would not have wanted to emphasise.
First, note in the current crisis the turning points in the series. The Investment ratio collapses (as does aggregate demand) and unemployment responds quickly (going up). Government spending as a per cent of GDP reacts in a lagged manner. In causality terms you cannot consider that government spending caused the unemployment. That lag relationship can also be seen at the early part of Taylor’s sample as well.
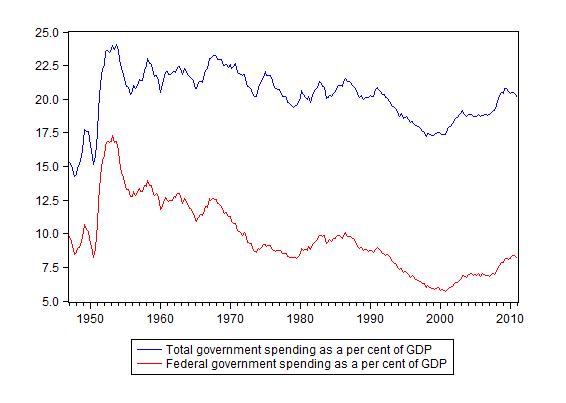
Second, there is no “explosion” in the public spending ratio.
To reinforce the second point I graphed the total government spending ratio and the federal government spending ratio from 1947 to 2011 to show you the trend. Cyclical events notwithstanding there does not appear to be a giant called government in the US taking over the economy and squeezing out private spending.
Conclusion
The point is that the government spending has an exogenous (discretionary) and endogenous (cyclical) component and the graphs above cannot decompose that. Knowing that a sensible analyst – one that was not bent on distorting the debate and providing fodder for fools like Paul Ryan – would never make the claims that Taylor made. I conclude he has lost his academic independence and credibility.
It is clear that a solution to unemployment is to stimulate private spending. The problem is that the neo-liberal period has pushed so much debt onto the private sector that the balance sheet adjustments necessary to reduce the debt exposure will take time. Holding out for a sudden reversal of the investment ratio is poor policy and just forces unemployment to remain higher for longer.
The correct thing to do – despite what Paul Ryan thinks – is for the government to expand its share of total spending even further and drive aggregate demand harder at present. It should start by introducing a Job Guarantee and spending on public infrastructure. There is no secret – unemployment is caused by a failure of aggregate demand.
When one or more components fail (private spending) then public spending has to fill the gap. I am sorry it is so simple.
That is enough for today!
I think Paul Ryan should sip a lot more of these SUPER expensive bottles of wine with his economist buddies John Cochrane and John Taylor. This is a real win-win-win. First it will help the French economy. Second no more lying with statistics because the authors are too drunk to find the button the launch EViews. Third Paul Ryan will be sooner or later broke and go out of business.
The good professor does well with his explanations about the economy. But, the sad part is that in the budget debate, unemployment doesn’t matter. The Republicans really don’t care about employment for the rest of us and the President has decided that he can win reelection with over nine percent unemployment. O seems to be so confident of reelection that he has even attacked SS. Just think about someone implying that over nine percent unemployment is alright as long as he can win the next election and then attacking spending for the elderly. What kind of person thinks that way?
I discovered this blog only a few months ago.
Since then you have taught me lots.
Thanks.
Bill,
What’s wrong with “Marshallian” economists? 🙂
How about a correlation between government spending and business cash balances? We might see the lack of crowding out effects. Throw in aggregate demand for good measure.
In response to his first graph saying higher unemployment equals higher gov’t spending (or vice versa), doesn’t that make sense? I mean, as you say, if the unemployment rate goes up, shouldn’t gov’t spending? So when take your numbers, you get high unemployment and then immediate gov’t spending to stop the job loss. But it takes a few months for those jobs numbers to go down and then when they do, the private sector picks up the slack and then gov’t stops spending. My point, you cannot say if you do A, you automatically get B.
I’m increase by your ability to state that “Remember econometrics is an art not a science which always makes me feel better – I prefer to be an artist than a scientist” and also make a definitive statement like “The US government will never encounter a Greek-style crisis because it controls the central bank, issues its own currency and can spend whatever it wants without worrying about who will fund it”. Can you elaborate on why you feel it’s impossible for the US to suffer a debt crisis given the current debate in Washington?
Troy, Note the phrase “Greek-style” in the sentence of Bill’s that you quote. He didn’t say there is no debt problem in the US. Both the US and Greece have a debt problem. But to compare the two is like comparing chalk to cheese, because the US issues its own currency and Greece does not. Without help from the rest of Europe, Greece has pretty well no option but to renege on its debts. The US is nowhere near in this position. For the US to renege on its debts would be complete lunacy, as Martin Wolf pointed out in today’s Financial Times. See:
http://www.ft.com/cms/s/0/979c10d8-acb8-11e0-a2f3-00144feabdc0.html#axzz1S1Ik56RL
@Ralph
My issue is that too many people are making a blanket statement that the US has nothing to worry about since it issues its own currency and debt. But the fact is that they US can default so arguing whether it will be Greek style, Argentinian style, or Zimbabwe style is bit like arguing what color the deck chairs where on the Titanic. And I feel the true lunacy is to dismiss the idea that somehow the US will never default and it is somehow out of the range of possibility.
@ Troy: no one is denying that the U.S can’t default, what we’re saying is that there is no ECONOMIC reason for that to happen. if it happens it will be a political (stupid) decision. that’s the difference. in greece that will be involuntary because they can’t issue their own currency. that makes the two defaults very very very very different.
Troy, as you seem to be aware it’s not about the ability to pay, it’s about the willingness to pay and even rating agencies say that, but why would Republicrats and Demican’s ‘trash’ their countries financial reputation by defaulting, isn’t that ‘un-American’ and maybe even treasonable?
As anyone who has taken a first-year course in basic statistics knows, “correlation does not necessarily imply causation in any meaningful sense of the word.”
“Correlations are not explanations and besides, they can be as spurious as the high correlation in Finland between foxes killed and divorces.” — Gunnar Myrdal
Love that quote.
The problem with any theory that still correlates GDP with economic growth is that our GDP growth has been debt driven for over 2 decades. Nobody, not even somebody with a phd in economics, has been able to convince me that this kind of growth can create a sustainable job market in the private sector.
“steve warshaw says:
Thursday, July 28, 2011 at 2:50
The problem with any theory that still correlates GDP with economic growth is that our GDP growth has been debt driven for over 2 decades. Nobody, not even somebody with a phd in economics, has been able to convince me that this kind of growth can create a sustainable job market in the private sector.”
I have plotted empirical data in “Replotting data from “Total Debt to GDP (%) | Global Finance”” at
http://pshakkottai.wordpress.com/2011/10/06/replotting-dat…global-finance/
which compares the economic conditions of various countries. India, Brazil, Japan and Italy have large deficit financing and have sustainable private sector jobs. U.K, USA and Spain have low deficits, high unemployment and struggling economies.
Partha