I haven't provided detailed commentary on the US labour market for a while now. To…
Australian labour market – flat
It is always time to celebrate when unemployment falls and participation rises it. But when unemployment is 591,000 and it only falls by 2,600 which means at the one decimal point level the unemployment rate remains constant you realise that employment growth is barely keeping pace with population growth and the labour market, still damaged by the crisis, is not nothing much is happening at all in the labour market. This is the conclusion I draw after today’s release by the Australian Bureau of Statistics (ABS) of the Labour Force data for June 2011. It was good to see full-time employment growing again after two months going the other direction but the overall scene is very subdued and far from the “bursting at the seams” rhetoric that we hear in the daily media. The headline discussion, however, should be the appalling state of the teenage labour market who continue to lose jobs. The Australian economy is nowhere near full employment and the slack remained about constant in June 2011.
The summary ABS Labour Force (seasonally adjusted) estimates for June 2011 are:
- Employment increased by 23,400 (0.2 per cent) with full-time employment rising by 59,000 and part-time employment falling by 35,600.
- Unemployment declined by 2,600 (0.4 per cent) to 591,000.
- The official unemployment rate remained unchanged at 4.9 per cent.
- The participation rate was at 65.6 per cent up by 0.1 points on revised figures for last month.
- Aggregate monthly hours worked increased 8.8 million hours (0.X per cent) – that is, very modestly.
- The quarterly labour underutilisation estimates last published in May 2011 show that the ABS broad labour underutilisation rate was 12.2 per cent. This figure might have fallen fractionally in June because of the rise in full-time work. But the impact will be very small if any.
The ABC news report today (July 7, 2011 carried the headline – Full-time job surge leaves unemployment rate steady. They quoted some bank economist who said:
Unemployment is still below that crucial 5 per cent mark.
There is nothing crucial about an unemployment rate of 5 per cent. This is just the Treasury’s fictional NAIRU level which carries no empirical support. It is a made up figure that the conservative media and bank economists claim is full employment.
Remember the broad labour underutilisation rate in Australia remains around 12.2 per cent which translates into well over 1.4 million people of working age who haven’t got enough work and want more.
Please read my blog – The dreaded NAIRU is still about! – for more discussion on this point.
The Sydney Morning Herald headline was – The Surprise jump in full-time jobs – whereas last month the related story carried the headline – Full-time jobs sink again. The fact is that the Australian labour market has not yet fixed on a strong growth path.
The SMH “surprise” for this month relates to the expectations of the “bank economists” who were more pessimistic than usual after being burnt badly by over-optimistic forecasts over the last year – basically because they have been believing the beat-up from the mining sector and journalists that the mining boom is going to over power the economy.
We are still waiting for that.
The SMH quoted one “bank” economist as saying that the rise in full-time jobs in June was:
… a correction after two months of falls … It tells you the labour market is in reasonably good shape. It’s tight but it’s not tightening any further … The pace of employment generation has clearly moderated and it’s not enough to get the unemployment rate any lower.
Make sense of that if you can. Correction to what? The behaviour of full-time employment has shown no clear trend for months now.
Further how can employment growth that is not strong enough to get the unemployment rate any lower (not to mention the huge pool of underemployed) describe a labour market that is “in reasonably good shape”?
As an aside I just love the way the conservative press dream up “takes” on bad outcomes. The Australian economy is basically slowing in regions where the vast majority of the population lives (East coast) while the terms of trade are driving strong growth in the mining areas. The spillover from mining to the rest of us is weak at present.
So News Limited Economics Editor Michael Stutchbury claims in an article this morning (July 7, 2011) – Two-speed economy puts lid on interest rate hikes that:
HERE’S another good thing about the two-speed economy: interest rates won’t have to rise as much even amid the biggest mining and energy investment boom in Australia’s history.
The rate hike pencilled in for next month was virtually erased by Glenn Stevens on Tuesday, after the Reserve Bank board considered the softness of the non-mining economy.
So it is a good thing that the labour market is stuck with high levels of labour underutilisation because it stops the RBA from driving rates up in pursuit of a non-existent inflation problem in Australia. That is how biased the economic analysis is in the conservative press.
Employment growth insipid – trending down
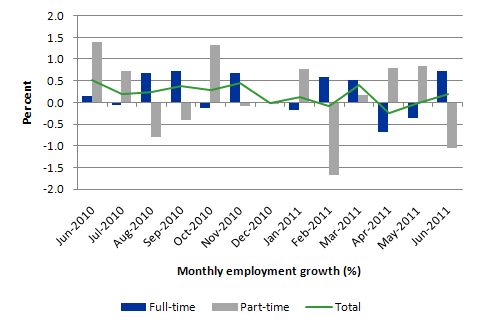
The June data shows that employment growth (0.2 per cent) is still muted with considerable variation in the full-time/part-time performance and regular crossings of the zero line for the last several months. After contracting for the last two months, full-time employment rebounded in June but a poor part-time outcome (loss of 35,600 net jobs) meant that total employment barely kept pace with the underlying population growth.
Trend employment growth remains subdued after dropping sharply around November 2010 as the fiscal stimulus was withdrawn.
The following table shows the number of jobs gained or lost (net) in the last six months. The conclusion – a very modest addition of employment in net terms although dominated by full-time employment growth.
| Full-time (000s) | Part-time (000s) | Total (000s) | |
| December 2010 to June 2011 | 50.3 | -4.7 | 45.6 |
The following graph shows the month by month growth in full-time (blue columns), part-time (grey columns) and total employment (green line) for the 12 months to June 2011 using seasonally adjusted data. It is clear that the picture has been mixed over the last 12 months with employment growth averaging 0.2 points per month (full-time 0.2 points; part-time 0.2 points).
While full-time and part-time employment growth are fluctuating around the zero line, total employment growth is still well below the growth that was boosted by the fiscal-stimulus in the middle of 2010.
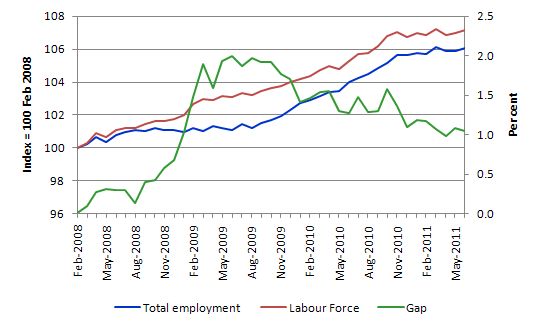
To put the recent data in perspective, the following graph shows the movement in the labour force and total employment since the low-point unemployment rate month in the last cycle (February 2008) to June 2011. The two series are indexed to 100 at that month. The green line (right-axis) is the gap (plotted against the right-axis) between the two aggregates and measures the change in the unemployment rate since the low-point of the last cycle (when it stood at 4 per cent).
The Gap series gives you a good impression of the asymmetry in unemployment rate responses even when the economy experiences a mild downturn (such as the case in Australia). The unemployment rate jumps quickly but declines slowly.
It also highlights the fact that the recovery is still not strong enough to bring the unemployment rate back down to its pre-crisis low. You can see clearly that the unemployment rate fell in late 2009 and very little improvement has been made in the course of this year.
The Australian labour market continues to be stuck in a period of sluggish growth and fluctuating participation rates.
Teenage labour market – continues to decline
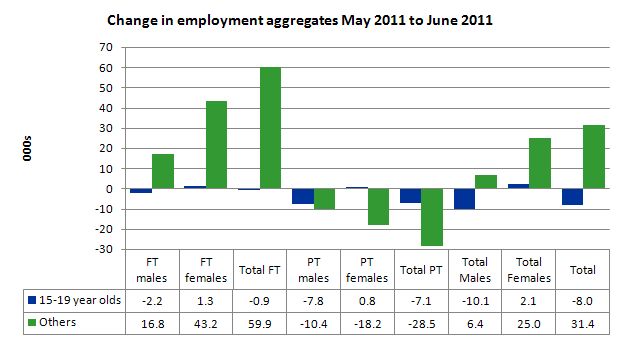
The detail the Government and the media continually overlook is that the teenage labour market remains in an appalling state. In June 2011 both full-time and part-time employment fell.
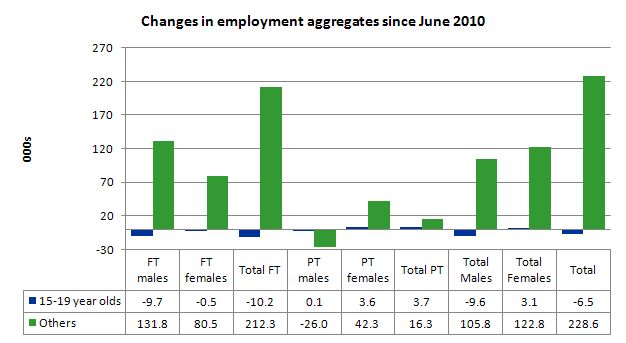
While employment for non-teenagers rose by 31,400 teenage employment contracted by a further 8 thousand. Over the last twelve months teenagers have lost 6,500 jobs (net).
It is clear that the Australian labour market continues to fail our 15-19 year olds. At a time when we keep emphasising the future challenges facing the nation in terms of an ageing population and rising dependency ratios the economy still fails to provide enough work (and on-the-job experience) for our teenagers who are our future workforce.
The following graph shows the distribution of net employment creation in the last month by full-time/part-time status and age/gender category (15-19 year olds and the rest).
To put this month’s figures in perspective though, the following graph shows the change in aggregates over the last 12 months. In this so-called period of recovery, teenagers are going backwards.
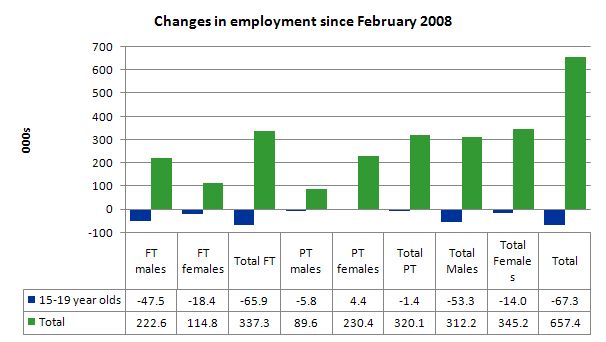
To further emphasise the plight of our teenagers I compiled the following graph that extends the time period from the February 2008, which was the month when the unemployment rate was at its low point in the last cycle, to the present month (June 2011). So it includes the period of downturn and then the “recovery” period. Note the change in vertical scale compared to the previous two graphs. That tells you something!
The results are stunning really. Teenagers have lost 65.9 thousand full-time jobs and 67.3 thousand jobs overall in that time. The comparison with the rest of the employed labour force is staggering.
There is nothing good that you can say about any of that. It makes a mockery of those (like the bank economists and our politicians) who claim we are close to full employment. An economy that excludes its active teenagers from any employment growth at all is not one that is using its existing capacity to its potential.
The longer-run consequences of this teenage “lock out” will be very damaging.
In the May 2011 quarter broad labour underutilisation data released last month by the ABS, the underemployment rate for 15-24 year olds was 13.1 per cent (up from 12.9 per cent in the February quarter). Total labour underutilisation for 15-24 year olds was 24.2 per cent (only marginally below the 24.6 per cent in February).
This is an economy that the Treasurer says is booming and in need of fiscal austerity but in which – 24.2 per cent of our 15-24 year olds (who are seeking work) are idle (sum of unemployment and underemployment).
Unemployment
The unemployment rate remained unchanged in June at 4.9 per cent although unemployment in total only fell by 2,600 which tells you that the employment growth barely kept pace with the underlying population growth.
Overall, the labour market still has significant excess capacity available in most areas.
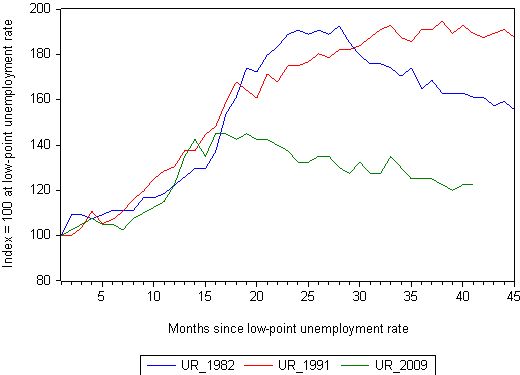
The following graph updates my 3-recessions graph which depicts how quickly the unemployment rose in Australia during each of the three major recessions in recent history: 1982, 1991 and 2009 (the latter to capture the 2008-2010 episode). The unemployment rate was indexed at 100 at its lowest rate before the recession in each case (June 1981; November 1989; February 2008, respectively) and then indexed to that base for each of the months as the recession unfolded.
I have plotted the 3 episodes for 45 months after the low-point unemployment rate was reached (although the current episode has only endured for 40 months). For 1991, the end-point shown is the peak unemployment which was achieved some 38 months after the downturn began although the recovery was painfully slow. While the 1982 recession was severe the economy and the labour market was recovering by the 26th month. The pace of recovery for the 1982 once it began was faster than the recovery in the current period.
It is significant that the current situation while significantly less severe than the previous recessions is dragging on which is a reflection of the lack of private spending growth and declining public spending growth.
The graph provides a graphical depiction of the speed at which the recession unfolded (which tells you something about each episode) and the length of time that the labour market deteriorated (expressed in terms of the unemployment rate).
From the start of the downturn to the 41-month point (to June 2011), the official unemployment rate has risen from a base index value of 100 to a value 122.5 – peaking at 145 after 21 months. At the same stage in 1991 the rise was 189 (and falling) and in 1982 – 161 (and falling in spurts).
The trend in unemployment at present is stuck at its current level as employment growth barely keeps pace with population growth.
Note that these are index numbers and only tell us about the speed of decay rather than levels of unemployment. Clearly the 4.9 per cent at this stage of the downturn is lower that the unemployment rate was in the previous recessions at a comparable point in the cycle although we have to consider the broader measures of labour underutilisation (which include underemployment) before we draw any clear conclusions.
Each quarter the ABS publish their broader measures of labour underutilisation. The next quarterly update will be in August 2011
Aggregate participation rate rises – a nudge
The participation rate was rose by 0.1 percentage points in June after being revised down by 0.1 points last month.
The fact that unemployment barely fell indicates that employment growth is barely keeping pace with the underlying population growth.
Hours worked basically static in June
Total monthly hours worked rose in June by 8.8 million hours or 0.5 per cent – that is, very subdued.
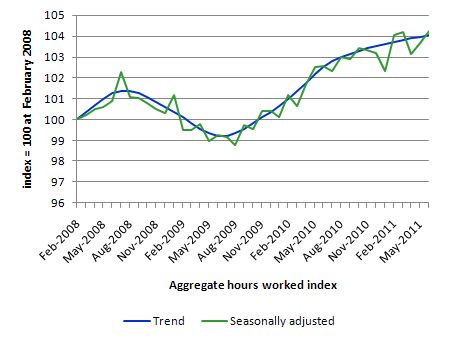
The following graph shows the trend and seasonally adjusted aggregate hours worked indexed to 100 at the peak in February 2008 (which was the low-point unemployment rate in the previous cycle). Working hours are not trending strongly upwards.
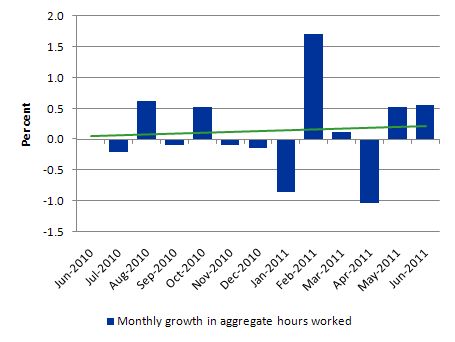
The next graph shows the monthly growth (in per cent) over the last 12 months. The green linear line is a simple regression trend and it is suggesting monthly growth rates are just positive
Once again the data doesn’t support the notion of a fully employed labour market that is bursting against the inflation barrier.
Conclusion
The June Labour Force data shows that the Australian economic recovery is very subdued and failing to generate sufficient employment growth to eat into the huge pool of wasted labour. Employment growth is barely keeping up with population growth.
The economy is locking in a very high labour underutilisation rate – currently about 12.2 per cent (sum of unemployment and underemployment).
There is still a lot of slack left to be mopped up and the teenage employment problem is manifest and should be a policy priority.
The fact that the Treasurer has expressed satisfaction with the performance outlined in today’s data indicates he does not deserve that position.
It would be better for the Government to admit that they need to maintain a strong fiscal stimulus and abandon their budget surplus ambitions which are totally at odds with the direction of the economy at present.
That is enough for today!
Very good post, I always come to your blog to read your analysis when the labour figures are released. Your well informed views back up with data, helps offset the poorly and often misleading views in the Murdoch, Fairfax and sadly to say conservative leading ABC.
Bill,
I understand the ABS Labour Force estimates are revised at some point after this initial publication – does this ever make any significant difference to what is being reported?
Also, what are your thoughts on the accuracy of the ABS figures? Roy Morgan, for example, have much higher unemployment estimates, and insist theirs are more accurate (as they would, I suppose). Do you think real un- and underemployment are worse than the ABS estimates?
Thanks for another great post.
Ditto Paul’s comments. An excellent and thorough analysis. I’ve been following labour data closely the past twelve months as I’ve grave concerns regarding Aus’ private debt – particularly mortgage debt – whilst employment remains robust we’ll be OK; any significant decline, then I expect things to unravel rather quickly. We are in a vulnerable situation, lacking a competent government to make appropriate responses when necessary; I hope my misgivings are misplaced.
Dear Bill, can you please tell us your view on Internships?