Today (January 22, 2026), the Australian Bureau of Statistics (ABS) released the latest labour force…
Australian labour market – sliding backwards
Despite the up-beat rhetoric of the government and the mainstream media about how strong the Australian economy is as a result of our alleged “once-in-a-hundred-years” mining boom and their constant assertions that we are at full employment and so a budget surplus has to be pursued with vigour and at all costs to prevent an inflation break-out, the labour market has been struggling. Today, the Australian Bureau of Statistics (ABS) of the Labour Force data for July 2011 shows the labour market has gone backwards. Employment was down marginally with only net part-time employment growing and unemployment rose to 611,600 (up 18,000). The unemployment rate jumped from 4.9 per cent to 5.1 per cent. The overall scene is very subdued and far from the “bursting at the seams” rhetoric that we hear in the daily media. The headline discussion, however, should be the appalling state of the teenage labour market who continue to lose jobs. The Australian economy is nowhere near full employment and thing worsened in July 2011.
The summary ABS Labour Force (seasonally adjusted) estimates for July 2011 are:
- Employment fell marginally (0.0 per cent) with full-time employment falling by 22,200 and part-time employment increasing by 22,100. Net change 100 jobs.
- Unemployment rose by 18,000 (3.0 per cent) to 611,600 due to employment growth failing to match underlying population growth.
- The official unemployment rate remained rose to 5.1 per cent from 4.9 per cent.
- The participation rate remained constant at 65.6 per cent so that all the labour force growth was due underlying growth in the working age population.
- Aggregate monthly hours worked increased 3.6 million hours (0.2 per cent) – that is, hardly at all.
- The quarterly labour underutilisation estimates last published in May 2011 show that the ABS broad labour underutilisation rate was 12.2 per cent. This estimate will have risen in July because of the rise in part-time work and the fall in full-time work.
The news earlier in the week regarding the labour market was bad. The ANZ Jobs Advertisements data for July 2011 showed that:
Total job advertisements on the internet and in newspapers decreased by 0.7% in July to be 8.3% higher than a year earlier … The monthly trend in total job advertisements began slowing in January and has turned negative from April this year.
So the demand side of the labour market is softening quickly after floating on the fiscal stimulus this time last year.
The ABC news report today (August 11, 2011 carried the headline – Unemployment rises to 5.1 per cent.
The report said:
The unemployment rate had been 4.9 per cent in June, seasonally adjusted, and the break above 5 per cent is seen by some analysts as significant, as many consider it a rough benchmark for what economists label ‘full employment’.
The 5-per cent unemployment equals full employment myth is a very rough benchmark indeed – so rough that it is meaningless and just reflects the ideological persuasion of the mainstream of my profession. They ceased to have a sensible definition of full employment (meaning enough jobs and working hours to match the preferences of the labour force) about 35 years ago.
There is nothing crucial about an unemployment rate of 5 per cent. This is just the Treasury’s fictional NAIRU level which carries no empirical support. It is a made up figure that the conservative media and bank economists claim is full employment.
Remember the broad labour underutilisation rate in Australia remains around 12.2 per cent which translates into well over 1.4 million people of working age who haven’t got enough work and want more.
Please read my blog – The dreaded NAIRU is still about! – for more discussion on this point.
Today’s estimates once again caught the “bank economists” out – they had been “expecting an overall jobs gain of 10,000, leaving unemployment steady at 4.9 per cent”. No surprise there. A reasonable rule of thumb is that the bank economists will be wrong every month – not just around the edges but in understanding the basics of what is happening.
The ABC quoted one bank economist who in recent months has been forecasting interest rate rises because of her view that the labour market was going gang-busters (despite the evidence to the contrary). It appears that the penny has dropped but try to work through the jargon. Can’t she just say – things are bad and unemployment is rising.
Reasonably soft all round, including the details. The key really is the unemployment rate, the fact that it has ticked up, we need to watch now whether it is the start of an upward trend … I think that the softness in the leading indicators tells us that employment generation going forward is not going to be enough to keep the unemployment rate steady. So there is a risk that the unemployment rate may be seeing the lows, at least for the near term, and it starts to hover a bit higher.
The Sydney Morning Herald headline was – Jobless rate jumps in July .
It seems that the reporter is surprised every month. Last month the headline was “Surprise jump in full-time employment”. This month’s surprise was in its claim that that “Australia’s unemployment rate unexpectedly rose to 5.1 per cent as the economy shed jobs last month with employers growing more cautious about hiring full-time staff”.
They also note that “Only two weeks ago, some analysts had been tipping the RBA would soon have to lift rates to keep a lid on inflation”. There was never a fear of inflation in this sort of labour market.
The news reports in recent weeks have been full of leading companies shedding labour and closing plants.
The reason the SMH is constantly being “surprised” is because they listen to the “bank economists” too much. Everyone is getting seduced by the beat-up from the mining sector that the mining boom is going to over power the economy.
We are still waiting for that. The labour market is going backwards while it waits.
And consider what the Treasurer has been saying this week. Yesterday, on ABC Radio National’s Breakfast Program the following conversation transpired:
ABC INTERVIEWER: You’ve warned of plunging tax revenue because of the global downturn. On that basis, how can you categorically claim that you’ll get the Budget back into surplus for 2012-13?
TREASURER: Well, what I’m saying is that we do expect to come back to surplus but these events have made that much harder. The events on global markets do impact here, we are not immune, and of course that does have an impact upon tax revenues, but we’ve outlined our fiscal credentials. We’ve said very clearly that our aim is to bring our Budget back to surplus in 2012-13. And that’s what we aim to do.
ABC INTERVIEWER: Can I get an unequivocal statement on that then this morning; that the Budget will be brought back to surplus for 2012-13?
TREASURER: What I’m saying to you, Virginia, is that we will bring the Budget back to surplus in 2012-13. We are not immune from the events that we are seeing on global markets. They do impact on revenue, they do have an impact on our economy. We have put in place a fiscal strategy …
ABC INTERVIEWER: So is that a little get-out-of jail card at the end there about us not being immune when you say that you will bring it back… I’m hearing it two ways. I’m hearing we will bring it to surplus 2012-13, but
TREASURER: This is a silly game, Virginia. The fact is that we’ve got a fiscal strategy, we’re sticking to our fiscal strategy …
He has said the same thing every day for some months – like an automatum he refuses to acknowledge they withdrew the fiscal stimulus too early, the mining boom is not a strong enough boom to drive trend growth and the private domestic sector is not wanting to spend much at present.
Taken together this is why the labour market is now contracting.
And just in case you think I am being “party political” here in criticising the government consider what the Opposition Treasury Spokesperson said to the press yesterday ((Source):
The shadow treasurer, Joe Hockey, said if the global situation worsened, the opposition would cut the government no slack for delaying the return to surplus because unemployment was low and there were record high terms of trade.
It is difficult to comment on idiocy at that level.
The same SMH report (August 10, 2011) said that in response to the “dwindling revenue” as a result of the very sluggish growth, the Federal government has cut a spending initiative aimed at providing a “national disability insurance scheme”. The SMH says that:
The scheme – to be announced this morning in Melbourne – was to begin as a series of start-up projects in several states but no significant funding was expected until after 2012-13, the year the budget is due to return to surplus. These have been dropped.
So when revenue falls as a result of the automatic stabilisers only a very irresponsible government would cut spending to keep their surplus ambitions on track. The first thing a responsible government needs to learn is that budget outcomes are largely outside of their control – being driven largely by spending decisions in the private and external sectors.
The best thing a government can learn is that it is the state of the real economy and its labour market that matters and the budget outcome should be whatever it takes to ensure there is full employment and price stability.
Targetting a surplus at a time of high unemployment and underemployment with growth slow if not contracting is fiscal vandalism.
Employment stops growing
The July data shows that employment growth (0.0 per cent) was static (bias towards falling). There has been considerable fluctuations in the full-time/part-time performance and regular crossings of the zero line over the last several months.
Full-time employment has contracted in three of the last four months and overall is failing to keep pace with underlying population growth.
Trend employment growth remains subdued after dropping sharply around November 2010 as the fiscal stimulus was withdrawn.
The following table provides an accounting summary of the labour market performance over the last six months. WAP is working age population (above 15 year olds). The first three columns show the number of jobs gained or lost (net) in the last six months. The conclusion – a very modest addition of employment in net terms although dominated by full-time employment growth.
The WAP has risen by 132 thousand in the same period while the labour force has only risen by 34.5 thousand as a result of the participation rate actually declining.
If the participation rate had not have declined the rise in unemployment would have been severe.
Accounting Table – January 2011 to July 2011

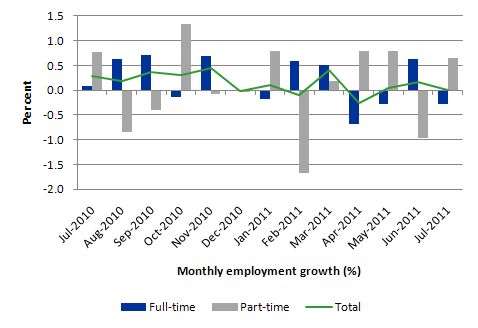
The following graph shows the month by month growth in full-time (blue columns), part-time (grey columns) and total employment (green line) for the 12 months to July 2011 using seasonally adjusted data. It is clear that the picture has been mixed over the last 12 months with employment growth averaging 0.2 points per month (full-time 0.2 points; part-time 0.1 points).
While full-time and part-time employment growth are fluctuating around the zero line, total employment growth is still well below the growth that was boosted by the fiscal-stimulus in the middle of 2010.
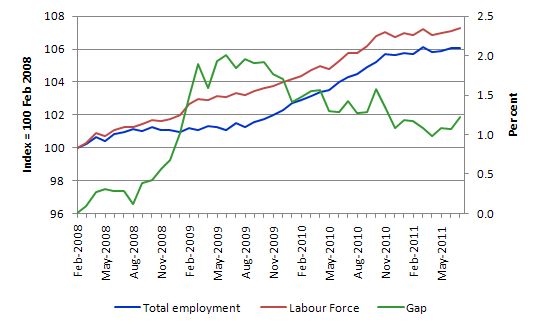
To put the recent data in perspective, the following graph shows the movement in the labour force and total employment since the low-point unemployment rate month in the last cycle (February 2008) to July 2011. The two series are indexed to 100 at that month. The green line (right-axis) is the gap (plotted against the right-axis) between the two aggregates and measures the change in the unemployment rate since the low-point of the last cycle (when it stood at 4 per cent).
The Gap series gives you a good impression of the asymmetry in unemployment rate responses even when the economy experiences a mild downturn (such as the case in Australia). The unemployment rate jumps quickly but declines slowly.
It also highlights the fact that the recovery is still not strong enough to bring the unemployment rate back down to its pre-crisis low. You can see clearly that the unemployment rate fell in late 2009 and very little improvement has been made in the course of this year.
The Australian labour market continues to be stuck in a period of sluggish growth and fluctuating participation rates.
Teenage labour market – continues to decline
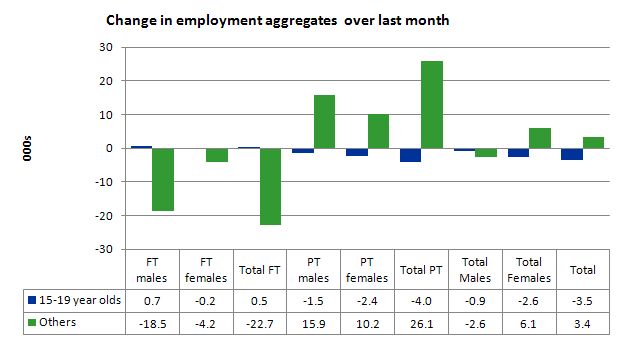
The teenage labour market has fallen further behind in July 2011. The government and media continually overlook the fact that the teenage labour market is in an appalling state. In July 2011, full-time employment rose by 500 jobs while part-time employment fell by 4 thousand, the next effect being a loss of 3.5 thousand jobs.
So all the jobs lost in July overall were in the teenage labour market.
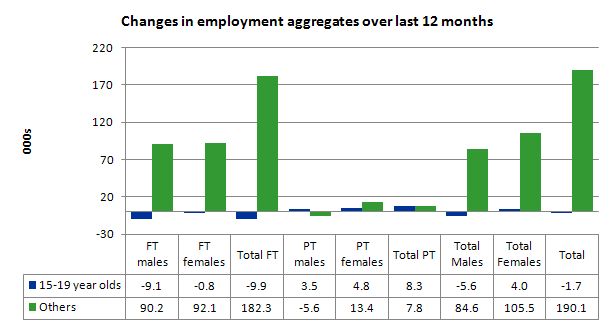
Over the last twelve months teenagers have lost 1,700 jobs (net) while the rest of the labour force has gained 190 thousand jobs (net).
It is clear that the Australian labour market continues to fail our 15-19 year olds. At a time when we keep emphasising the future challenges facing the nation in terms of an ageing population and rising dependency ratios the economy still fails to provide enough work (and on-the-job experience) for our teenagers who are our future workforce.
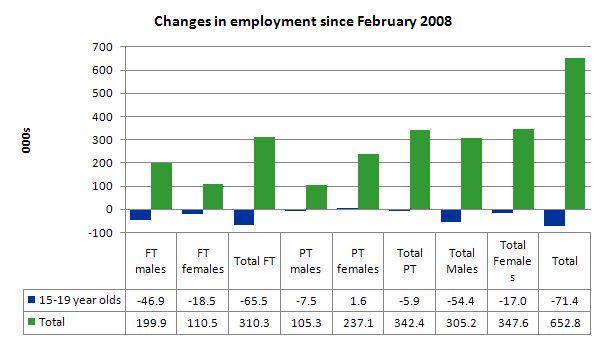
The following graph shows the distribution of net employment creation in the last month by full-time/part-time status and age/gender category (15-19 year olds and the rest).
To put this month’s figures in perspective though, the following graph shows the change in aggregates over the last 12 months. In this so-called period of recovery, teenagers are going backwards.
To further emphasise the plight of our teenagers I compiled the following graph that extends the time period from the February 2008, which was the month when the unemployment rate was at its low point in the last cycle, to the present month (July 2011). So it includes the period of downturn and then the “recovery” period. Note the change in vertical scale compared to the previous two graphs. That tells you something!
The results are stunning really. Teenagers have lost 65.5 thousand full-time jobs, 5.9 thousand part-time jobs totalling 71.4 thousand jobs overall in that time. The comparison with the rest of the employed labour force is staggering.
There is nothing good that you can say about any of that. It makes a mockery of those (like the bank economists and our politicians) who claim we are close to full employment. An economy that excludes its active teenagers from any employment growth at all is not one that is using its existing capacity to its potential.
The longer-run consequences of this teenage “lock out” will be very damaging.
In the May 2011 quarter broad labour underutilisation data released last month by the ABS, the underemployment rate for 15-24 year olds was 13.1 per cent (up from 12.9 per cent in the February quarter). Total labour underutilisation for 15-24 year olds was 24.2 per cent (only marginally below the 24.6 per cent in February).
This is an economy that the Treasurer says is booming and in need of fiscal austerity but in which – 24.2 per cent of our 15-24 year olds (who are seeking work) are idle (sum of unemployment and underemployment).
Unemployment
The unemployment rate rose sharply by 0.2 percentage points in July to 5.1 per cent. The reason is simple. With participation rates constant all the labour force growth is being driven by underlying growth in the working age population (above 15 year olds). The rising unemployment has resulted from the failure of the demand side of the economy (employment growth) to match that labour force growth which is a sign of a weakening economy.
Overall, the labour market still has significant excess capacity available in most areas.
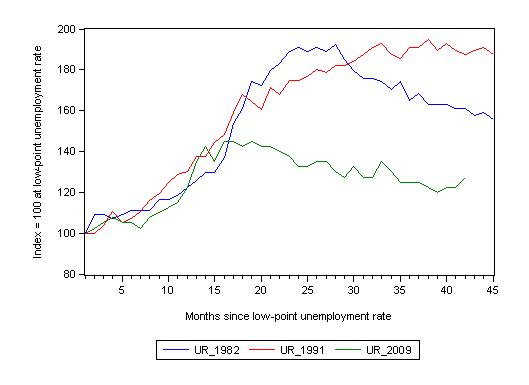
The following graph updates my 3-recessions graph which depicts how quickly the unemployment rose in Australia during each of the three major recessions in recent history: 1982, 1991 and 2009 (the latter to capture the 2008-2010 episode). The unemployment rate was indexed at 100 at its lowest rate before the recession in each case (July 1981; November 1989; February 2008, respectively) and then indexed to that base for each of the months as the recession unfolded.
I have plotted the 3 episodes for 45 months after the low-point unemployment rate was reached (although the current episode has only endured for 42 months). For 1991, the end-point shown is the peak unemployment which was achieved some 38 months after the downturn began although the recovery was painfully slow. While the 1982 recession was severe the economy and the labour market was recovering by the 26th month. The pace of recovery for the 1982 once it began was faster than the recovery in the current period.
It is significant that the current situation while significantly less severe than the previous recessions is dragging on which is a reflection of the lack of private spending growth and declining public spending growth.
The graph provides a graphical depiction of the speed at which the recession unfolded (which tells you something about each episode) and the length of time that the labour market deteriorated (expressed in terms of the unemployment rate).
From the start of the downturn to the 42-month point (to July 2011), the official unemployment rate has risen from a base index value of 100 to a value 127.5 – peaking at 145 after 21 months. At the same stage in 1991 the rise was 187 (and falling) and in 1982 – 161 (and falling in spurts).
The trend in unemployment at present is rising as employment growth fails to keeps pace with underlying population growth.
Note that these are index numbers and only tell us about the speed of decay rather than levels of unemployment. Clearly the 4.9 per cent at this stage of the downturn is lower that the unemployment rate was in the previous recessions at a comparable point in the cycle although we have to consider the broader measures of labour underutilisation (which include underemployment) before we draw any clear conclusions.
Each quarter the ABS publish their broader measures of labour underutilisation. The next quarterly update will be in August 2011
Aggregate participation rate remains constant
The participation rate remained unchanged in July which means that the rise in unemployment is purely down to employment growth failing to keep pace with the underlying population growth.
Hours worked basically static in July
Total monthly hours worked rose in July by 3.6 million hours or 0.5 per cent – that is, very subdued. The trend is now flat.
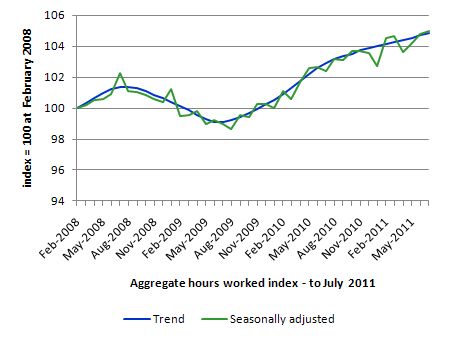
The following graph shows the trend and seasonally adjusted aggregate hours worked indexed to 100 at the peak in February 2008 (which was the low-point unemployment rate in the previous cycle). The rising trend which marked the early recovery courtesy of the fiscal stimulus has not flattened.
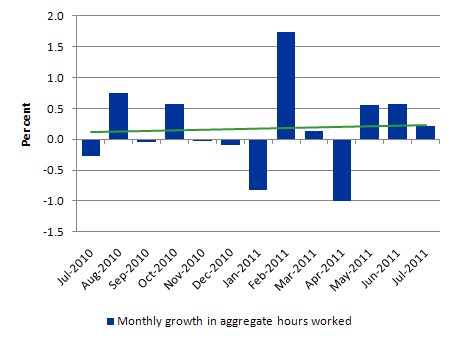
The next graph shows the monthly growth (in per cent) over the last 12 months. The green linear line is a simple regression trend and it is suggesting monthly growth rates are struggling.
Once again the data doesn’t support the notion of a fully employed labour market that is bursting against the inflation barrier.
Conclusion
The July Labour Force data shows that the Australian economic recovery is now faltering after several months of very subdued. The labour market is now failing to generate sufficient employment growth to even keep pace with underlying population growth and as a consequence unemployment is rising again. Today’s data is consistent with a range of indicators.
The economy is now building on an already high labour underutilisation rate – currently about 12.2 per cent (sum of unemployment and underemployment).
There is still a lot of slack left to be mopped up and the teenage employment problem is manifest and should be a policy priority.
The fact that the Treasurer continues to argue that they will deliver a budget surplus in the next 2 years shows how far removed from reality he has become. He has been trapped by the political process into this one line response to everything without realising that the slow growth will prevent him from delivering a surplus irrespective of what he does by way of fiscal cuts. He is getting very poor advice.
It would be better for the Government to admit that they need to maintain a strong fiscal stimulus and abandon their budget surplus ambitions which are totally at odds with the direction of the economy at present.
Total digression – Deficit terrorists not only ignorant but disgusting
Take a look at this Business Insider article – The 15 Countries That Are Buried Under The Most Debt. This publication is one of the leading attack dog against public deficits.
The “buried” headline was accompanied by the following picture:
Someone needs to have a word to the editor and production team at that publication about good taste and empathy.
That is enough for today!

Very fitting. The Business Insider slide show is followed by the alert: “Niall Ferguson’s Complete And Definitive Guide To The Sovereign Debt Crisis”. You only have to read 3 paragraphs to realize this is a complete waste of time.
Business Insider? A complete misnomer.
I enjoy your articles Bill.
Is anyone going to come clean about the real unemployment rate in Australia? A quick survey through my well-heeled local shopping strip today showed that I was the only customer and shop assistants were standing around, even Australia Post, Telstra were quieter. I expect lots of retail layoffs this month, especially from discretionary retail
“Business Insider? A complete misnomer.”
Not really a misnomer. The term “Business Insider” connotes corruption and illegal activities in my mind.
Krugman is addressing MMT again, claiming that monetization lead to inflation in France in 1920, seems highly unlikely to me but I don’t know history of that, please whoever feels competent, chime in.
http://krugman.blogs.nytimes.com/2011/08/11/franc-thoughts-on-long-run-fiscal-issues/
Haha… any site that runs Niall Ferguson’s articles should immediately be scrutinised closely. An historian friend of mine calls him the ‘court historian of the neo-liberal elite’.
If you want some massive Ferguson related fun, check this out:
http://thinkprogress.org/yglesias/2010/07/26/198015/niall-ferguson-debates-himself/
He’s quite literally a one-man show, albeit a rather confused one!
No comments in the press about the min wage?
So where have these teen jobs been lost?
Are they just lost forever? Or a has a different “set of demographics” moved into their job market?
Ed Balls, opposition for HM Treasury in Britain is now challenging the chancellor of the exchequer about the brewing depression. He is bashing austerity.
The state of the teenage jobs market has been apalling for some time but whats even worse is that many youth are at unis
because there isnt enough jobs for them and they are hidden from the unemployment figures.
As a commenter JRbach notes well in another blog
“I wish there were heroes in the legal profession to take on the government re their abdication of the RBA Charter for full employment:
‘It is the duty of the Reserve Bank Board, within the limits of its powers, to ensure that the monetary and banking policy of the Bank is directed to the greatest advantage of the people of Australia and that the powers of the Bank … are exercised in such a manner as, in the opinion of the Reserve Bank Board, will best contribute to:
a. the stability of the currency of Australia;
b. the maintenance of full employment in Australia; and
c. the economic prosperity and welfare of the people of Australia.’
Full employment used to mean 2% until they snuck in the mean-spirited, erroneous and unsubstantiated logic of the NAIRU (see The dreaded NAIRU is still about! linked within Bill Mitchell’s blog above).”
Totally agree and Im weary of hearing about the “mining boom”, the “threat of inflation” and returning the budget to surplus in double fast time (like automatons from both sides of politics), whilst the jobs market barely rates a mention. We owe our youth better economic management than this.
Interesting. Are you sure that part of this change is not due to childhood being extended, delaying entry to the workforce?
It may also be that teens are being replaced by 457 visa workers?