The Reserve Bank of Australia (RBA) increased the policy rate by 0.25 points on Tuesday…
Australia CPI data – benign inflation outcome
The Australian Bureau of Statistics released the Consumer Price Index, Australia data for the March 2011 quarter today and it revealed a sharp spike in the headline inflation rate (up 1.6 per cent for the quarter) but a very benign underlying inflation story. Overall, the impacts of the natural disasters (floods and cyclones) are driving food prices up and world oil price movements are causing local petrol prices to rise. These impacts are likely to be transitory. It is interesting that there is considerable disagreement among bank economists about what the data release means. Many are joining my chorus and suggesting that the transitory nature of the inflation influences will not compel the Reserve Bank to push up interest rates. At present, the data tells us that there is no inflationary outbreak evident and other data suggests that the economy is slowing.
The lunchtime ABC News carried the headline – Food, petrol prices drive up inflation – which was more or less accurate.
It was always predictable that food prices would rise sharply in the March quarter as a result of the floods. This impact will work its way through the system as soon as the crops come back. The RBA is clearly smart enough to differentiate between core and actual inflation – more about which later.
The point I continually emphasis in media interviews is that we still have at least 12.5 per cent of our willing labour resources idle (either unemployed or underemployed). That is a lot of slack to be absorbed.
Yes, the mining sector is going well on the back of very strong world primary commodity prices as the Chinese redefine who is going to have access to energy and other resources in the future (see this blog for more on that – Be careful what we wish for …).
But the east coast economies – the large population centres – are not growing strongly. All the evidence indicates that now as the fiscal stimulus dissipates. And now the floods have significantly curtailed economic activity in those states. So the better policy option now is to ensure that the idle labour actually gets to participate in the investment boom (from mining) and the flood reconstruction efforts where a host of low-skilled labour resources will be required.
The benign inflation environment at present does not indicate the need for an interest rate rise.
Trends in inflation
The headline inflation rate increased by 1.6 per cent in the March quarter translating into an annualised increase of 3.3 per cent for the year to March which is up from the December quarter of 2.8 per cent.
Does this matter?
The Consumer Price Index (CPI) is designed to reflect a broad basket of goods and services (the “regimen”) which are representative of the cost of living. You can learn more about the CPI regimen HERE.
The ABS say that:
The CPI is a temporal price index for consumption goods and services acquired by Australian resident households. It is an important economic indicator, providing a general measure of price change … The principal purpose of the Australian CPI is to measure inflation faced by consumers to support macroeconomic policy decision making. This is achieved by providing a measure of household consumer inflation by the acquisitions approach.
There are various ways of assessing the general movement in prices depending on the purpose that the measure is being used for. The document I linked to above details some of the approaches. One of these approaches – the “acquisitions approach” – attempts to measure “household consumer inflation” and defines the basket of goods and services as “consisting of all consumer goods and services actually acquired by households during the base period.” The ABS use “market prices for goods and services” (including taxes etc) and make no imputations for “non-monetary transactions” (such as imputed rents). They also exclude “interest rate payments”.
So when the CPI increases by 1.6 per cent in a quarter it is significant. We experienced three consecutive quarters in 2008 (March, June, and September) where the quarterly rate of increase was above 1 per cent but the recession tempered this spurt – which was mostly driven by oil prices and food shortages arising from drought.
While the cost of living has risen then what implications does this have for the current macroeconomic policy settings. The RBA’s formal inflation targeting rule aims to keep annual inflation rate (measured by the consumer price index) between 2 and 3 per cent over the medium term. Their so-called “forward-looking” agenda is not clear – what time period etc – so it is difficult to be precise in relating the ABS data to the RBA thinking.
What we do know is that they do not rely on the “headline” inflation rate. Instead, they use two measures of underlying inflation which attempt to net out the most volatile price movements. As you will appreciate from today’s data release – the surge in inflation is all down to volatility (although I will come back to that later).
To understand the difference between the headline rate and other non-volatile measures of inflation, you might like to read the March 2010 RBA Bulletin which contains an interesting article – Measures of Underlying Inflation. That article explains the different inflation measures the RBA considers and the logic behind them.
The concept of underlying inflation is an attempt to separate the trend (“the persistent component of inflation) from the short-term fluctuations in prices. The main source of short-term “noise” comes from “fluctuations in commodity markets and agricultural conditions, policy changes, or seasonal or infrequent price resetting”.
The RBA uses several different measures of underlying inflation which are generally categorised as “exclusion-based measures” and “trimmed-mean measures”.
So, you can exclude “a particular set of volatile items – namely fruit, vegetables and automotive fuel” to get a better picture of the “persistent inflation pressures in the economy”. The main weaknesses with this method is that there can be “large temporary movements in components of the CPI that are not excluded” and volatile components can still be trending up (as in energy prices) or down.
The alternative trimmed-mean measures are popular among central bankers. The authors say:
The trimmed-mean rate of inflation is defined as the average rate of inflation after “trimming” away a certain percentage of the distribution of price changes at both ends of that distribution. These measures are calculated by ordering the seasonally adjusted price changes for all CPI components in any period from lowest to highest, trimming away those that lie at the two outer edges of the distribution of price changes for that period, and then calculating an average inflation rate from the remaining set of price changes.
So you get some measure of central tendency not by exclusion but by giving lower weighting to volatile elements. Two trimmed measures are used by the RBA: (a) “the 15 per cent trimmed mean (which trims away the 15 per cent of items with both the smallest and largest price changes)”; and (b) “the weighted median (which is the price change at the 50th percentile by weight of the distribution of price changes)”.
While the literature suggests that trimmed-mean estimates have “a higher signal-to-noise ratio than the CPI or some exclusion-based measures” they also “can be affected by the presence of expenditure items with very large weights in the CPI basket”.
The authors say that in the RBA’s forecasting models used “to explain inflation use some measure of underlying inflation (often 15 per cent trimmed-mean inflation) as the dependent variable”.
The special measures that the RBA uses as part of its deliberations each month about interest rate rises – the trimmed mean and the weighted median – also showed moderating price pressures.
So what has been happening with these different measures?
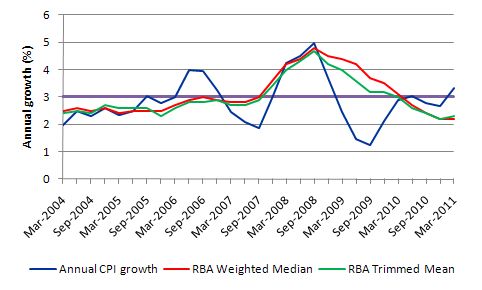
The annual growth in the weighted median was steady at 2.2 per cent in the March quarter having been at 3.1 per cent in the March 2010 quarter. The trimmed mean rose modestly from 2.2 to 2.3 per cent the same period.
What that means is that there is no underlying price spike. The factors driving the headline rate (which I analyse next) are all volatile and ephemeral (food prices and petrol).
The underlying measures are benign and situated close to the lower band of the RBAs targetting range. This also indicates that there is no wage pressures on the inflation rate at present. Real unit labour costs have actually been falling.
My conclusion – there is no case that can be made for an interest rate hike in the foreseeable future. Whether the RBA follows this logic is another matter.
The following graph shows the three main inflation series published by the ABS – the annual percentage change in the all items CPI (blue line); the annual changes in the weighted median (red line) and the trimmed mean (green line). The horizontal purple line (at 3 per cent) denotes the upper bound of the RBA’s target range.
Remember the trimmed measures (weighted median and trimmed mean) are designed to depict tendency or trend and attempt to overcome misleading interpretations of trend derived from the actual series. They are all heading downwards.
My interpretation is that underlying inflation trend is steady.
What is driving inflation in Australia?
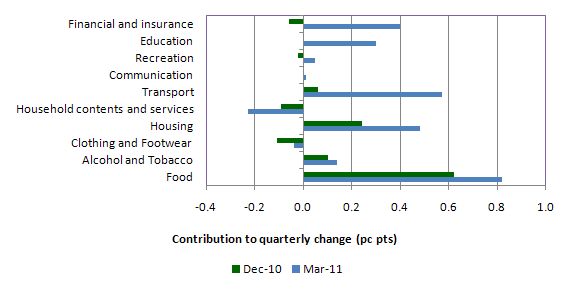
The following bar chart compares the contributions to the quarterly change in the CPI for the December 2010 and March 2011 quarters by component.
The ABS reports that for the March quarter, the most significant price rises were for “automotive fuel (+8.8%), vegetables (+16.0%), deposit and loan facilities (+4.6%), fruit (+14.5%) and pharmaceuticals (+12.5%)”.
In the last quarter’s commentary – There is no inflationary outbreak evident – the economy is slowing – I wrote that “we can see the start of the weather-related impacts on food prices here. That will get worse as the full losses to productive capacity in the farms arising from the floods is revealed.”
Those impacts have now consolidated in the March quarter and will dissipate as the productive capacity of the farms arising from the floods is restored to more normal levels. I heard a radio program this morning indicating that in certain sectors of agriculture the rains have brought record crop and pasture yields.
The other major contributor is petrol and these price movements are largely beyond the influence of the Australian economy. The problem is that each time there has been a surge in oil prices the world economy has recessed soon after. There is evidence that the OPEC oil barons are now more sensitive to running oil dependent economies into the ground – “killing the goose that lays the golden egg” – and may increase supply.
But there are two additional trends to consider. The non-OPEC oil producers will reach peak in the near future and the national composition of demand for oil (and energy in general) is shifting with the rise of China and India. While it is likely that the current surge in oil prices is ephemeral, the long-term trend in energy prices generally is up.
Please read my blog – Be careful what we wish for … – for more discussion on this point.
At present, there is no evidence that demand pull factors emanating from within Australia are driving the inflation trend.
The ABS reports that the “most significant offsetting price falls were for furniture (-6.2%), audio, visual and computing equipment (-7.2%), milk (-6.2%), overseas holiday travel and accommodation (-1.6%) and motor vehicles (-0.5%)”. It is clear that the rising Australian dollar is now starting to feed through to imported prices and that is pushing local prices down and holding the overall inflation rate down.
But the important point is that there is no evidence that growth in nominal aggregate demand is outstripping productive capacity overall.
Regional trends
The other point of interest in the current debate is whether there are price pressures are building up as a consequence of the much-vaunted mining boom. Many economists are claiming that that inflation will seep out of Western Australia where a significant proportion of the mining activity is located. Perth is the capital city of Western Australia so you would expect to see evidence of rising inflation there if the claim had any merit.
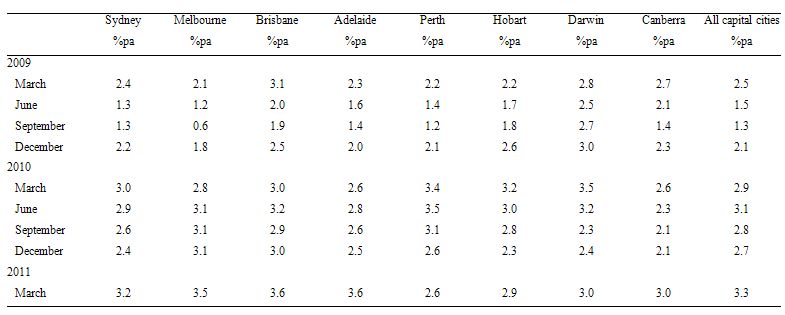
The following Table shows the annual inflation data for the Australian capital cities since March 2009. The data is from the ABS. The impact of the crisis in 2009 is clear as is the early recovery period in the first two quarters of 2010 when price inflation in the capital cities returned to normal levels (with some disparities).
Inflation has been falling in Perth over the last year. Brisbane another capital in a mining state overall has fairly stable inflation notwithstanding the huge flood damage that they have endured in the early part of 2011. Inflation has risen only modestly there in March 2011 quarter. But that has nothing to do with the economy overheating.
Darwin is another mining capital city (Northern Territory) and it is also currently enjoying good commodity prices and strong demand. But its inflation rate is low and relatively stable.
Conclusion
The inflation rate rose in the March quarter mainly due to transitory factors such as natural disasters and external factors (petrol prices). Only the energy price issue is of concern. The farms damaged by the floods etc will be back into production before long and then the supply boost will see food prices fall sharply.
I gave an interview for tonight’s ABC PM current affairs program just now and indicated that I would consider it irresponsible if the RBA hiked interest rates as a consequence of today’s figures.
The link to that story is – Natural disasters cause inflation to surge – for transcript and mp3 audio.
It is clear that underlying inflation is benign and the economy overall is slowing. There are at least 1.2 millions workers still idle in one way or another at present and key sectors are struggling (retail, construction, manufacturing etc).
Part of the problem is that the underlying labour market dynamics are not well understood by the neo-liberals and their models thus lead them into making erroneous predictions all the time – such that we are close to full employment when in fact there is an official labour underutilisation rate of 12 per cent at present.
That is enough for today!


This Post Has 0 Comments