Today (January 22, 2026), the Australian Bureau of Statistics (ABS) released the latest labour force…
Labour market – just marking time
Today the ABS released the Labour Force data for June 2010 which show that the unemployment rate is stable at 5.1 per cent (last month was revised down to 5.1 per cent) with virtually no change in the number of jobless. While employment growth is remains positive it is just keeping pace with the growth in the labour force. Further, the recent trend towards full-time employment growth has moderated and part-time growth dominated this month’s employment gains. As a result, aggregate hours worked fell in June which suggests that underemployment will have risen slightly. But a positive note is the reversal in the falling participation rate. While the bank economists have hailed today’s figures as indicative of an economy “near full capacity”, the reality is that the data is consistent with a broad array of statistics showing the Australian economy is slowing as the effects of the fiscal stimulus dissipate and and private spending remains subdued.
The summary ABS Labour Force results for June 2010 are (seasonally adjusted):
- Employment increased 45,900 (+0.4 per cent) with full-time employment increasing by 18,400 and part-time employment increasing by 27,500. This is reversing the trend in recent months and the shift to part-time work is showing up in declining hours worked.
- Unemployment decreased 200 to 598,400.
- The official unemployment rate remained constant at 5.1 per cent.
- The participation rate rose by 0.1 percentage points to 65.2 per cent. Participation is still well down from its most recent peak (April 2008) of 65.6 per cent. So the approximate number of workers that have dropped out of the labour force because of diminishing job prospects (that is, the rise in hidden unemployed) is 80 thousand persons (about 0.7 percent).
- Aggregate monthly hours worked decreased 6.4 million hours(-0.4 per cent) and are now around the July 2008 peak from the last cycle.
- Underemployment figure do not come out until August (as they are quarterly) but with part-time employment growth dominating and aggregate hours falling it is almost certain that underemployment rose in the last month. Given official unemployment remained constant this would suggest that total labour underutilisation has nudged up a little in June 2010.
This is how today’s data was reported on the ABC news – Jobs surge leaves unemployment steady. So you get the impression that there has been a proliferation of new jobs. The report said:
Australia’s unemployment rate has remained steady at 5.1 per cent despite the creation of almost 46,000 jobs in June … with 18,400 of those being full-time positions … One reason the unemployment rate remained steady despite the unexpectedly large hiring surge was an increase in the proportion of people looking for work – the participation rate climbed from 65.1 to 65.2 per cent.
That, combined with Australia’s growing population, means there needs to be jobs created each month to keep up with the expanding workforce if the unemployment rate is to remain steady.
The majority of jobs created were part-time and given that aggregate working hours also fell last month it is clear that while unemployment is stable, underemployment will have risen. Full-time employment growth is slowing and overall net job creation is just keeping pace with the labour force.
While participation did increase by 0.1 per cent last month it is still down on the previous peak and so employment growth will have to quicken in the coming months just to keep pace with the labour force growth.
There are always some bank economists who are prepared to talk up what are fairly ordinary results. The ABC reported some bank economist who claimed today’s data would fuel another interest rate rise:
It was a very solid outcome. Unemployment at 5.1 per cent, this is obviously going to be of some concern to the RBA … Their central case is that the boost in the terms of trade is adding to demand and they are going to be concerned about pressures in the economy. The door is still open for a rate hike at the August meeting.
The RBA should be concerned about an official unemployment rate of 5.1 per cent. It is the tip of the iceberg with participation rates still well down on the previous cyclical peak; working hours falling; most of the jobs growth being part-time; and underemployment still around 8 per cent (and rising).
Whereas the out-of-touch bank economist considers that we are close to full employment, the reality is that we have at least 13 per cent of our available labour resources not working enough (at least 6.5 per cent of them not working at all – unemployed or hidden unemployed).
The fact that we are now constructing that parlous situation as being close to full employment shows how far our judgements we have been skewed by the neo-liberal indoctrination.
At present we are wasting (foregoing) millions of dollars of output and income per day that we will never get back by keeping these huge buffer stocks of unwanted labour.
A lot of people rail against Job Guarantee type schemes and suggest they are just make work programs with little inherent productivity. Even if those allegations were close to the mark, they would still be better than having all this labour power idle – doing nothing.
Employment growth positive but just keeping pace
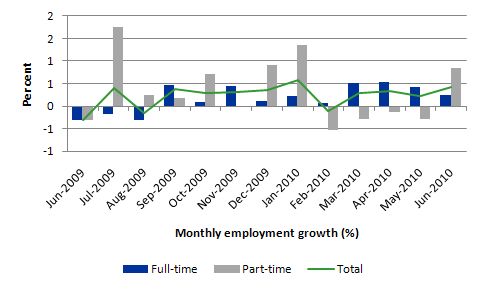
The following graph shows the month by month growth in full-time (blue columns), part-time (grey columns) and total employment (green line) over the last 12 months to June 2010 using seasonally adjusted data The overall picture is mildly positive. The sample period covers the latter parts of the downturn (June 2009 to August 2009) as full time employment growth was negative and part-time growth was mostly positive, which kept a lid on the overall employment losses although the slack showed up in lost hours of work, which was a notable feature of the downturn.
By September 2009, the effects of the fiscal stimulus package introduced in February 2009 were now evident and employment growth started to pick up quickly with growth in full-time employment signalling renewed optimism. In the more recent period, full-time employment growth continues to be positive but is slowing and the trend of declining part-time employment has now ended.
While employment growth remains positive it has slowed in the last month. It is clear that the impacts of the fiscal stimulus, which drove GDP growth in the March quarter (see Australia GDP growth flat-lining) are now dissipating and private spending is not yet strong enough to really push the labour market to the next level of recovery.
So the picture is not one of strength. If the full-time growth is now declining and the labour market is increasingly adding part-time jobs then we can expect any declines in official unemployment (as employment growth strengthens) to be offset to some extent by rising underemployment. As noted below, aggregate hours worked fell in June which is a sure sign that underemployment is rising.
In summary, employment growth is just keeping pace with the labour force growth and so no dent is being made in the accumulated pool of unemployment. Under these conditions, long-term unemployment steadily rises and cohorts move through the duration categories.
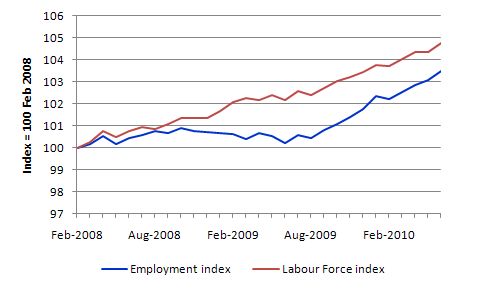
The following graph shows the movement in the labour force and total employment since the low-point unemployment rate month in the last cycle (February 2008). The two series are indexed to 100 at that month. You can see that in the last month, employment and the labour foce are running parallel (growth rates match).
So the data is telling us that there is not yet any robust labour market recovery underway. Australia just missed an official recession courtesy of the fiscal stimulus but is now exhibiting fairly sluggish but positive growth. There is definitely as a case to be made for continued fiscal support for aggregate demand.
No employment growth for teenagers
The following Table shows the distribution of net employment creation since December 2009 by full-time/part-time status and age category (15-19 year olds and the rest). Despite the employment growth since the beginning of this year, teenagers overall have experienced declining employment. The jobs market has shrunk for them overall.
Morever, while male teenagers have enjoyed the benefits of the overal employment growth (more than proportional to their labour force size), female teenagers have gone backwards.
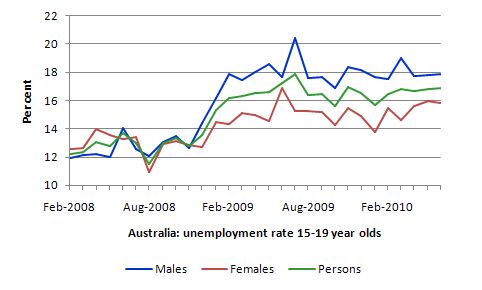
As a result, there has been very little movement at all in teenage unemployment rates since the recovery began. The step-jump that occurred in November 2008, just before the first fiscal stimulus became effective, has not been reversed despite overall growth in the labour market. So while this is not a jobless recovery overall, it is for the teenagers.
If we consider their exposure to underemployment and the fact that total labour underutilisation rates are around 26 per cent for our teenagers (sum of unemployment and underemployment) then you wonder how the bank economists can keep saying the Australian economy is close to full employment.
Unemployment
The ABS revised last month’s unemployment rate down to 5.1 per cent and it remained stuck on that figure in June 2010. Employment growth is not strong enough to offset the modest labour force growth.
With fiscal and monetary policy tightening over the last few months, one wonders how Tightening aggregate policy under these circumstances amounts to vandalism or worse.
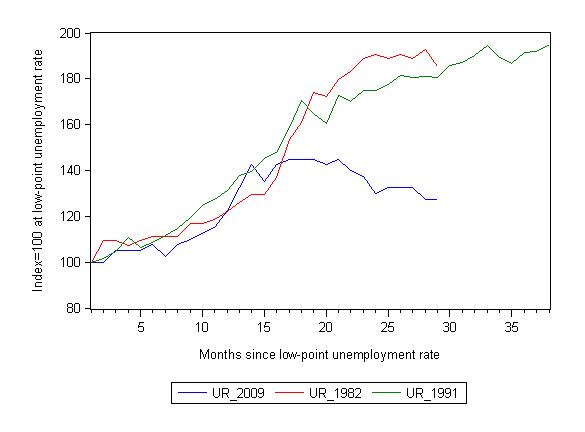
The following graph updates my 3-recessions graph which depicts how quickly the unemployment rose in Australia during each of the three major recessions in recent history: 1982, 1991 and now 2009 (the latter to capture the 2008-2010 episode). The unemployment rate was indexed at 100 at its lowest rate before the recession in each case (June 1981; November 1989; February 2008, respectively) and then indexed to that base for each of the months as the recession unfolded. For 1991, the end-point shown is the peak unemployment which was achieved some 38 months after the downturn began.
For the other series, I have just charted the evolution for the 29-months in the current cycle (to June 2010 – the length of the current deterioration since February 2008). So it gives us a view of the way the 1982 recovery began too.
The graph provides a graphical depiction of the speed at which the recession unfolded (which tells you something about each episode) and the length of time that the labour market deteriorated (expressed in terms of the unemployment rate).
From the start of the downturn to the 29-month point (to June 2010 – the length of the current deterioration since February 2008), the official unemployment rate has risen from a base index value of 100 to a value 127.5 – peaking at 145 after 17 months. At the same stage in 1991 the rise was 80.6 per cent (and growing) and in 1982 85.2. The 1982 recession which was fairly severe ended at the 26-month point and the economy began a painful recovery after that month.
So the current downturn has been a very different type of episode relative to our previous experiences. But the fact remains that the promising employment growth from early 2009 (see graph above) which lasted while the fiscal stimulus was impacting significantly on employment growth is not gone and the retrenchment of the unemployment rate is temporarily stalled. That is bad news.
Note that these are index numbers and only tell us about the speed of decay rather than levels of unemployment. Clearly the 5.1 per cent at this stage of the downturn is lower that the unemployment rate was in the previous recessions at a comparable point in the cycle although we have to consider the broader measures of labour underutilisation (which include underemployment) before we draw any clear conclusions.
The underemployment data is quarterly and will come out again in August. But the reality is that underemployment is a much more serious issue than it was in the 1991 and 1982 recessions and so the proportional difference between total labour underutilisation now is much less than the proportional difference between the official unemployment rates.
Hours worked – declined
While total hours worked in April fell by 12.2 million hours (-0.8 per cent) which was on top of a fall in March of 8.5 million hours (-0.5 per cent), there was a sharp rebound in May with aggregate monthly hours worked increasing by 42.5 million hours(+2.8 per cent). Overall, the recent trend was towards rising working hours as full-time employment growth dominated and part-time growth was negative.
However, in June part-time employment growth is dominated and full-time employment growth continued to slow. The result is that aggregate monthly hours worked fell by 6.4 million hours (-0.4 per cent).
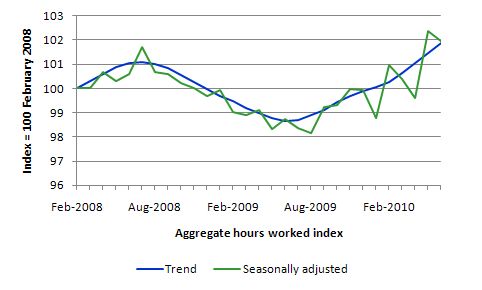
The following graph is taken from the the ABS data and shows the trend and seasonally adjusted aggregate hours worked indexed to 100 at the peak in February 2008 (which was the low-point unemployment rate in the previous cycle).
You can see a very flat V-shaped recovery with a positive trend. The national economy overall is now around the previous peak of July 2008 but doesn’t appear to be able to go beyond that at the moment, with the correction in June being negative.
State by State
In a previous blog I considered the claim that is being driven in the media that the recovery phase is being driven by the mining sector and a two-speed economy is emerging. So the “mining” states (Western Australia, Queensland and Northern Territory) are leaving the old manufacturing areas (NSW and Victoria) behind. The evidence is not yet convincing although in the last month the mining states of Queensland and WA have revealed increasingly better outcomes..
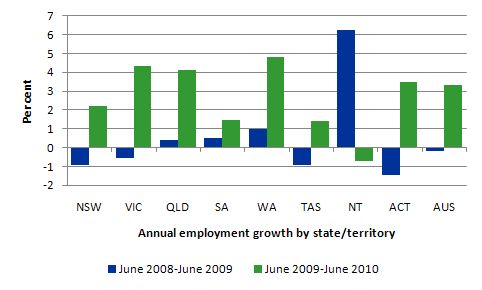
The following graph shows the percentage employment growth for the states and territories for each of the last two years (to June). There is nothing special about the periods chosen – just to correspond with the latest observation.
You can see that the strongest employment growth is in Western Australia, Queensland and Victoria. The relatively strong employment growth in the ACT, given it is a public sector economy (seat of government and main government departments are there) reflects the benefits of the fiscal stimulus and the modest expansion of government.
Remember not to get tricked by scale. The ACT is a much smaller labour market in absolute terms than NSW and Victoria.
In the most populous states (NSW, VIC and QLD). NSW and Victoria are the manufacturing strongholds and have very little exposure to the mining industry. Queensland has some exposure to the mining industry clearly but also is probably benefiting from domestic-sourced tourism as our exchange rate appreciation makes holidaying abroad more expensive.
So overall, while this analysis is crude, the data is not consistent with the “two-speed economy” hypothesis. However, the strong employment growth in Western Australia and Queensland is clearly consistent with the recognition that the mining sector is contributing to the overall growth of the Australian economy.
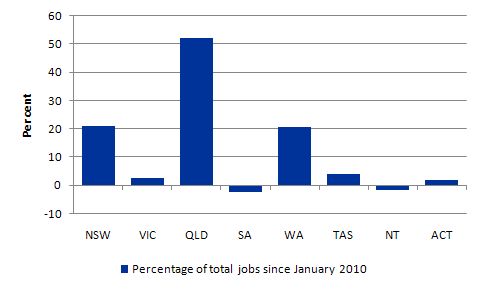
The following graph shows the proportions of total net jobs created since the beginning of 2010 by state and territory. Queensland has dominated accounting for over 52 per cent of the total net jobs created. 42 per cent of the total net jobs created since the beginning of 2010 are attributed (evenly) to NSW and WA. The mining rich Northern Territory has gone backwards this year.
Conclusion
While the business economists are claiming that the labour market is close to full employment the labour market data continues to tell me that there is a lot of slack left in the labour market.
While full-time employment is still growing that rate of expansion is slowing. Part-time employment growth is reemerging and with it a decline in the aggregate hours worked. So underemployment will be rising as official unemployment is steady.
Overall, employment growth is barely keeping pace with population growth and so long-term unemployment will be rising.
Given today’s data and related data releases over the last few weeks, I am still of the view that a further fiscal expansion is required – and should be directly targeted at public sector job creation and the provision of skills development within a paid-work context. That would be a great boost to low inflation growth.
Digression: ECB consistent to the end
Here is a good story from Europe – ECB chides Romania on bankers’ pay cut – which appeared on July 5, 2010 in the Financial Times. The story tells us that:
The European Central Bank, which has championed fiscal austerity across the continent, has scolded Romania’s government for forcing a 25 per cent pay cut on employees of the country’s central bank.
In a strongly-worded statement, the ECB on Monday warned that Romania’s actions violated European Union treaties allowing monetary authorities to operate freely and without political interference. It presaged a similar showdown with Hungary’s government, which plans to cut its central bank governor’s pay.
So the now dominant ECB – which is wielding fiscal power over all the member states – despite not being elected by anyone is now wanting to avoid tasting their own medicine.
But spare a thought for Romania. It “unveiled an austerity package in May that would cut the pay of all public sector workers – including employees of the national bank – by one quarter. The measures are essential if Romania is to meet a 6.8 per cent deficit target agreed with the International Monetary Fund.” The IMF would have to have its finger in a pie like that.
What a beautiful combination – the ECB and the IMF.
That is enough for today!

Bill,
This is somewhat off topic, but do you know this article?:
Bell, S. 2000. “Do Taxes and Bonds Finance Government Spending?” Journal of Economic Issues 34.3: 603-620.
Is it an accurate statement of modern monetary theory?
Regards
Dear Andrew at 2010/07/08 at 17:47
Yes I know the article by Stephanie Bell now Kelton (since married).
It was an excellent article summarising the ideas that were being developed within our group at the time.
best wishes
bill
Bill,
Don’t be so hard on the EU. All that unemployment apparantly gave them time to advance their soccer skills 🙂
Bill,
I’ve downloaded the paper referred to by Andrew.
Its fascinating.
Is there an equivalent study for the UK financial system please?
Maybe we have an exact analogue (as we must have the same problems).
Many thanks
Richard
Dear Richard
The principles apply to all fiat currency nations. The specific institutional arrangements differ a little but they are superficial differences.
best wishes
bill
Bill
Many thanks for your reply, its much appreciated
I’m still reading back through your blogs; what a fantastic resource.
Trouble is, in the UK, no-one in power is reading your blog.
Mention MMT and Chartalism, in particular, and everyone seems to switch off
Government Spending without borrowing the money by selling bonds – that’s PRINTING MONEY. The problem seems to be that people won’t think. They don’t realise how much their future depends on this. If your shafted, and you never really realise it, where you ever shafted? How do you get anyone to realise the current system is broken, failing to deliver to the population what it should get? Even the population is deceived.
Maybe some form of hybrid stage between economic classical ideas and yours will be necessary for the transition [this is one area where I have real difficulty in articulating MMT, the transition from where we are now, to where we could be] from our current system to the one you are advocating. One country, like the UK, implementing MMT will be slaughtered in the markets- how can that be avoided? Could this be a subject for a future blog, or maybe its covered and I’ve not found it yet
Best of luck down under, maybe Australia will get there first. If I’d visited first when I was 21 rather than 51, I would probably have emigrated – shame, I’ve only been to Adelaide, but I loved it.
Good luck in your efforts to spread your ideas -I’ve a lot to learn yet, but I’m getting there
Regards
Richard
Bill
This is really a PS to my previous post
I’m beginning to wonder if the UK, in all its trade agreements with the EU, has been hog-tied so that it cannot easily follow anything other than neo-classical ideas. If so, we need to leave the EU!
Regards
Richard
Dear Richard
The UK is already implementing MMT – badly.
MMT is not some future design – it describes how fiat currency systems work. The policy options are then clear and they become political choices.
best wishes
bill
Richard, see Warren Mosler, The Seven Innocent Deadly Frauds of Economic Policy and Soft Currency Economics for the basics. This should get you up to speed quickly for presenting MMT principles to others, while you are reading the archive here. Warren is talking chiefly in terms of the US, but the principles apply to the UK as well.
Richard said: “Government Spending without borrowing the money by selling bonds – that’s PRINTING MONEY.”
Actually, I believe debt is a type of money. I believe it should be that’s printing currency if 1 to 1 convertibility is guaranteed.
Bill and others above
I’ve been in bed for the last few hours
Thanks to all for your helpful replies and helping me with my economic education
I’ll read your suggestions
Regards
Richard
Shouldn’t most teenagers be full-time students?