The recent extreme weather in the northern hemisphere, the twin monster tropical storms in Japan,…
Australian labour force data – employment growth absorbs rising participation without increasing the unemployment rate
Last month’s labour force data for Australia revealed a sluggish labour market, seemingly on the cusp of contraction as other indicators were pointing in that direction. The Australian Bureau of Statistics (ABS) released the latest labour force data today (May 15, 2025) – Labour Force, Australia – for April 2025, which revealed that employment growth was strong enough to absorb a 0.3 point rise in participation without increasing the unemployment rate. The broad labour underutilisation rate (sum of unemployment and underemployment) did, however, rise 0.2 points to 10.1 per cent on the back of a rise in underemployment. The fact that 10.1 per cent of available labour are not being used indicates that folly of those who claim Australia is close to full employment. There is substantial scope for more job creation given the slack that is present.
The summary seasonally-adjusted statistics for April 2025 are:
- Employment rose 89,000 (0.6 per cent) – full-time employment rose by 59.5 thousand (0.6 per cent) and part-time employment rose by 29.5 thousand (0.6 per cent).
- Unemployment rose by 6,300 (1.0 per cent) to 621,100.
- The unemployment rate was steady on 4.1 per cent.
- The participation rate rose by 0.3 points 67.1 per cent.
- The Employment-population ratio rose 0.3 points to 64.4 per cent.
- Monthly hours worked rose 1 million (0 per cent).
- Underemployment rose 0.1 point (28.4 thousand) to 6 per cent (920.5 thousand).
- The Broad Labour Underutilisation rate (the sum of unemployment and underemployment) rose 0.2 points to 10.1 per cent.
- Overall, there are 1541.6 thousand people either unemployed or underemployed.
The ABS press release – Unemployment rate steady at 4.1% in April – noted that:
With employment increasing by 89,000 people and the number of unemployed increasing by 6,000 people, the unemployment rate remained steady at 4.1 per cent for April …
The rise in employment was larger for females, up 65,000 (0.9 per cent), while male employment was up 24,000 (0.3 per cent). Female employment growth was mainly in full-time workers, which rose 42,000 (1.1 per cent) in April. Female part-time workers rose by 23,000 (0.8 per cent) …
The strong growth in employment led to a rise in the employment-to-population ratio of 0.3 percentage points to 64.4 per cent in April, just below the record high of 64.5 per cent seen in January.
The addition of 6,000 unemployed people meant the labour force grew by 95,000 people and the participation rate rose by 0.3 percentage points to 67.1 per cent …
The underemployment rate rose by 0.1 percentage points to 6.0 per cent in April 2025 … The underutilisation rate, which combines the unemployment and underemployment rates, rose by 0.2 percentage points to 10.1 per cent.
Summary
1. The sluggishness from the last month gave way to stronger employment growth, a rise in participation and no significant increase in unemployment.
2. The employment-population ratio rose as employment growth outstripped a relatively strong growth in underlying population and the participation rate (which significantly added to the labour force).
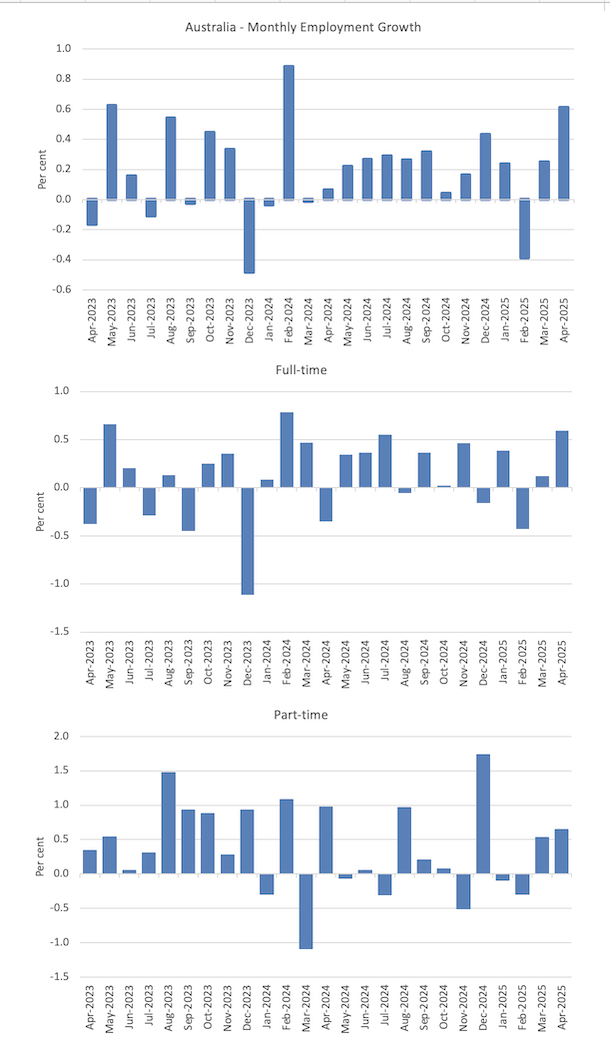
Employment growth much stronger
- Employment rose 89,000 (0.6 per cent).
- Full-time employment rose by 59.5 thousand (0.6 per cent).
- Part-time employment rose by 29.5 thousand (0.6 per cent).
The following graph shows the growth in total, full-time, and part-time employment for the last 24 months.
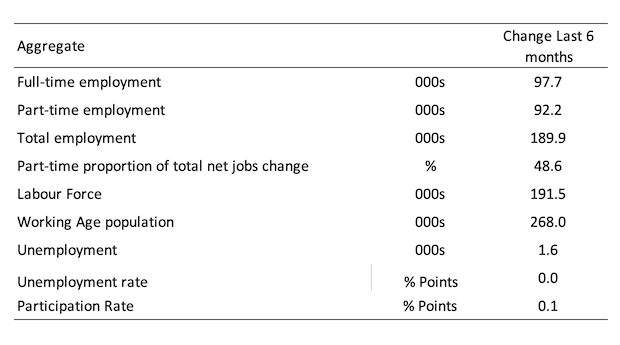
The following table shows the shifts over the last 6 months which helps to see the underlying trend.
Employment has just kept pace with the increase in the labour force over this period, which is why the change in unemployment is close to zero (1,600).
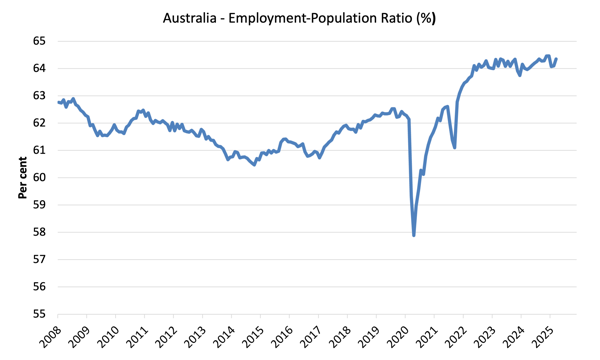
The Employment-to-Population ratio provides a measure of the state of the labour market that is independent of the supply shifts in the labour market (driven by the shifts in the participation rate).
The underlying working age population grows steadily while the labour force shifts with both underlying population growth and the participation swings.
The following graph shows the Employment-Population ratio rose 0.3 points in April 2025 and is 0.1 point below its maximum.
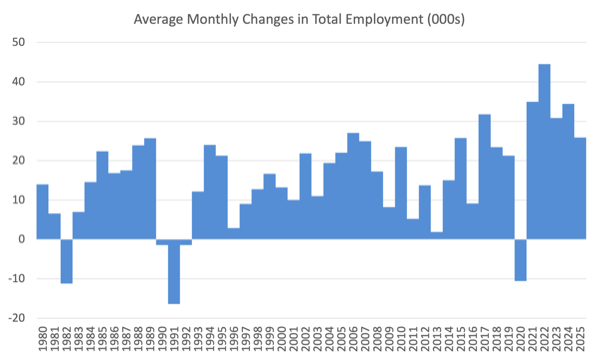
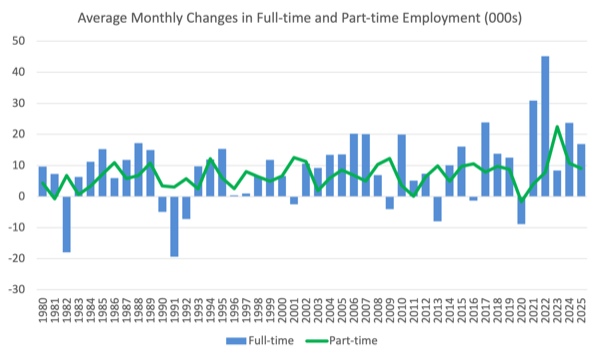
The next graphs show the average monthly change in total employment (first graph) and full- and part-time employment (second graph).
For total employment the monthly average changes were:
- 2022 – 44.5 thousand
- 2023 – 30.8 thousand
- 2024 – 34.4 thousand
- 2025 so far – 25.9 thousand
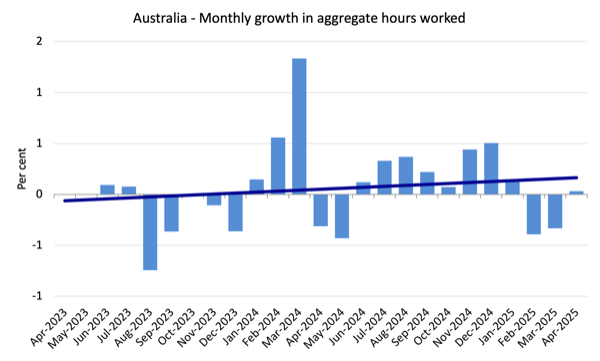
Monthly hours worked – barely changes
Monthly hours worked rose by 0.6 million hours (0.03 per cent) in April after two consecutive months of decline.
The following graph shows the growth in monthly hours worked for the last 24 months, with the straight line being a simple linear regression to indicate trend.
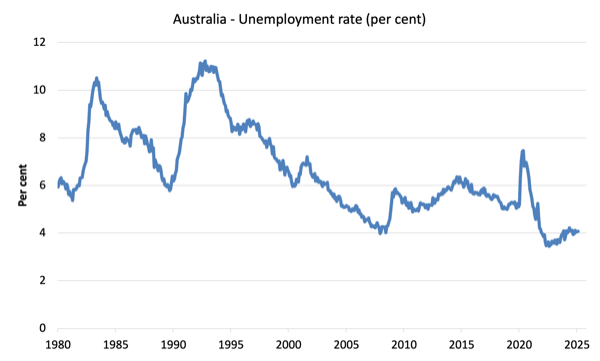
Unemployment rose by 6,300 in April
With total employment rising by 89,000 and the labour force rising by 95.3 thousand, official unemployment rose by around 6,300.
The unemployment rate rose by 0.02 points but when rounded remained at 4.1 per cent.
The following graph shows the evolution of the official unemployment rate since 1980.
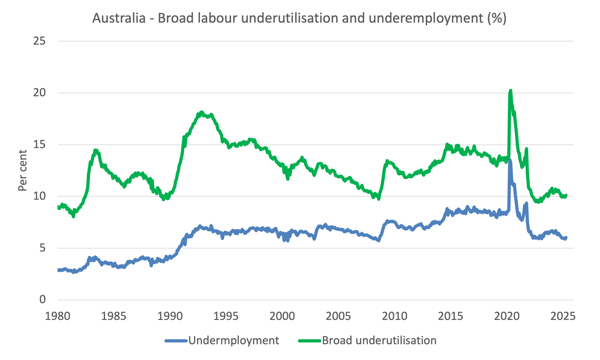
Broad labour underutilisation – 10.1 per cent in April
- Underemployment rose 0.1 point (28.4 thousand) to 6 per cent (920.5 thousand).
- The Broad Labour Underutilisation rate (the sum of unemployment and underemployment) rose 0.2 points to 10.1 per cent.
- Overall, there are 1541.6 thousand people either unemployed or underemployed.
The following graph shows the evolution of underemployment and the Broad labour underutilisation rate since 1980.
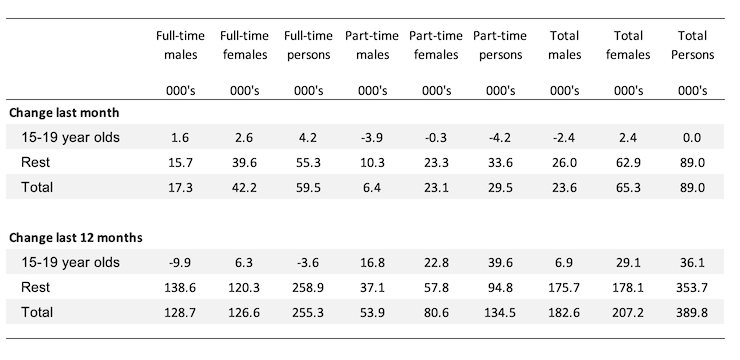
Teenage labour market – zero employment growth
- Total teenage (15-19) employment rose by 0 thousand (0.0 per cent) in April 2025.
- Full-time employment rose by 2.4 thousand (2.2 per cent).
- Part-time employment fell by 2.4 thousand (-0.6 per cent).
The following table summarises the shifts in the teenage labour market for the month and over the last 12 months.
To put these changes into a scale perspective (that is, relative to size of the teenage labour force) the following graph shows the shifts in the Employment-Population ratio for teenagers.
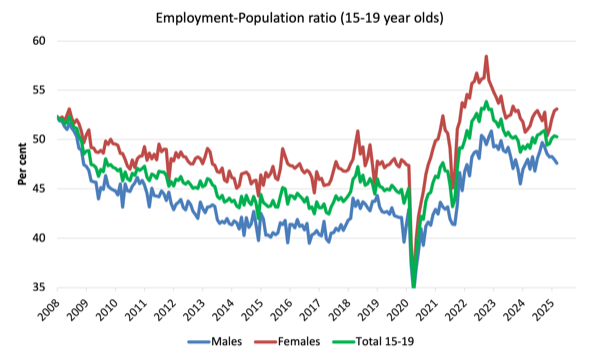
The Teenage Employment-Population ratios and their monthly changes in April 2025were:
- Males: 47.6 per cent -0.4 points
- Females: 53.1 per cent +0.2 points
- Total: 50.3 per cent -0.1 point
Conclusion
My standard warning to take care in interpreting monthly labour force changes – they can fluctuate for a number of reasons and it is imprudent to jump to conclusions on the back of a single month’s data.
- was strong enough to absorb a 0.3 point rise in participation without increasing the unemployment rate.
- Overall, the labour market is not showing signs of a significant downturn yet.
- The broad labour underutilisation rate (sum of unemployment and underemployment) did, however, rise 0.2 points to 10.1 per cent on the back of a rise in underemployment.
- The fact that 10.1 per cent of available labour are not being used indicates that folly of those who claim Australia is close to full employment. There is substantial scope for more job creation given the slack that is present.
That is enough for today!
(c) Copyright 2025 William Mitchell. All Rights Reserved.
This Post Has 0 Comments