Today (June 3, 2026), the Australian Bureau of Statistics (ABS) released the latest - Australian…
Australian National Accounts – 3 months ago the economy was barely moving – it will be worse now
Today (September 4, 2024), the Australian Bureau of Statistics released the latest – Australian National Accounts: National Income, Expenditure and Product, June 2024 – which shows that the Australian economy grew by just 0.2 per cent in the June-quarter 2024 and by just 1 per cent over the 12 months (down from 1.5 per cent). If we extend the June-quarter result out over the year then GDP will grow by 0.8 per cent, well below the rate required to keep unemployment from rising. GDP per capita fell for the sixth consecutive quarter and was 1.5 per cent down over the year. This is a rough measure of how far material living standards have declined but if we factor the unequal distribution of income, which is getting worse, then the last 12 months have been very harsh for the bottom end of the distribution. Household consumption expenditure contracted by 0.2 per cent – a sign that the economy is heading into recession. There is now a very real possibility that Australia will enter recession in the coming year unless there is a change of policy direction. Both fiscal and monetary policy are squeezing household expenditure and the contribution of direct government spending, while positive, will not be sufficient to fill the expanding non-government spending gap. At the current growth rate, unemployment will rise. And that will be a deliberate act from our policy makers.
The main features of the National Accounts release for the June-quarter 2024 were (seasonally adjusted):
- Real GDP increased by 0.2 per cent for the quarter (0.2 per cent last quarter). The annual growth rate was 1.0 per cent (down from 1.5) but the annualised December-quarter rate would only be 0.8 per cent
- GDP per capita fell by 0.4 per cent for the quarter, the fifth consecutive quarter of contraction. Over the year, the measure was down 1.5 per cent – signalling declining average income.
- Australia’s Terms of Trade (seasonally adjusted) fell by 3 per cent for the quarter and were down by 3.8 per cent over the 12 month period.
- Real net national disposable income, which is a broader measure of change in national economic well-being, fell by 0.9 per cent for the quarter and 0.3 per cent over the 12 months, which means that Australians are worse off (on average) than they were at that point 12 months ago. Averages are deceiving when the underlying distribution is highly skewed.
- The Household saving ratio (from disposable income) was stable on 0.6 per cent as households are being squeezed by excessive tight fiscal policy and the higher interest rates.
Overall growth picture – growth continues at much slower rate
The ABS – Media Release – said that:
Australian gross domestic product (GDP) rose 0.2 per cent (seasonally adjusted, chain volume measures) in the June quarter 2024 …
GDP growth was weak in March, with the economy experiencing its lowest through the year growth since December 2020. GDP per capita fell for the fifth consecutive quarter, falling 0.4 per cent in March and 1.3 per cent through the year …
GDP per capita was down for the sixth consecutive quarter, falling 0.4 per cent …
Household spending fell 0.2 per cent detracting 0.1 percentage points from GDP growth …
Government spending rose by 1.4 per cent …
Total investment fell 0.1 per cent in the June quarter …
The household saving ratio was unchanged at 0.6 per cent in the June quarter.
The short story:
1. The weakness in domestic demand that we saw increasing towards the end of 2023 has continued to worsen only contributing 0.2 points to GDP growth.
2. That contribution was made up by household spending which detracted 0.1 points, government spending which added 0.3 points, investment spending – zero contribution and net exports which contributed 0.2 points (rising exports, falling imports). The change in inventories detracted 0.3 points as firms stopped building stocks in a slow market.
3. GDP growth is now so low that unemployment will start rising more quickly than before. The rough rule of thumb developed by Arthur Okun, which says that GDP growth has to equal the sum of labour productivity and labour force growth for the unemployment rate to remain constant, would imply that unemployment will rise sharply in the coming year at the current GDP growth rate.
Productivity growth is now running at around 0.1 per cent over the year and the labour force is growing at around 1.5 per cent, which means at the current GDP growth rate, there is a 0.4 per cent shortfall, which will show up as a rising unemployment rate.
4. Household consumption spending is now contracting which reflects the interest rate squeeze and the tight fiscal settings.
5. Per capita GDP has been in decline for 6-quarters which means on average each person is becoming poorer but because the impact of this slowdown is disproportionately endured by lower income families, the situation is very dire for some. Some researchers now think this measure is a more reliable indicator of recession than the overall GDP figure.
6. Government consumption expenditure saved the economy from moving into negative growth territory.
7. However, given the decline in non-government spending growth, the current fiscal settings are way too restrictive and when combined with the tight monetary settings, it is clear that the Government, overall, is deliberately sabotaging the material well-being of millions of Australians under the veil of ‘fighting inflation’, which would have returned to pre-COVID levels anyway, without the austerity.
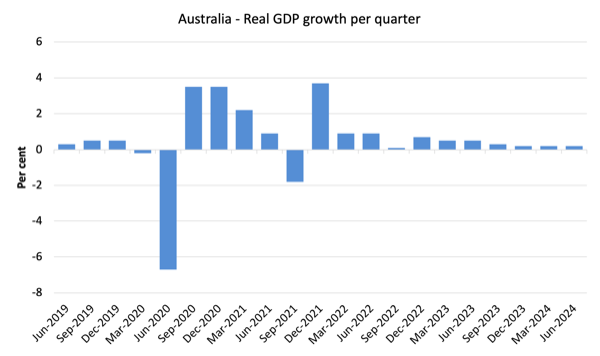
The first graph shows the quarterly growth over the last five years.
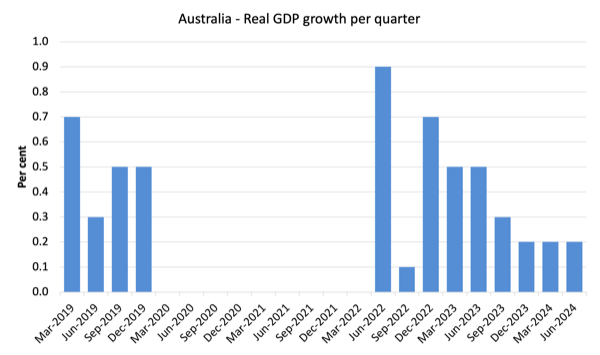
Here is the same graph with the extreme observations during the worst part of the COVID restrictions and government income support taken out.
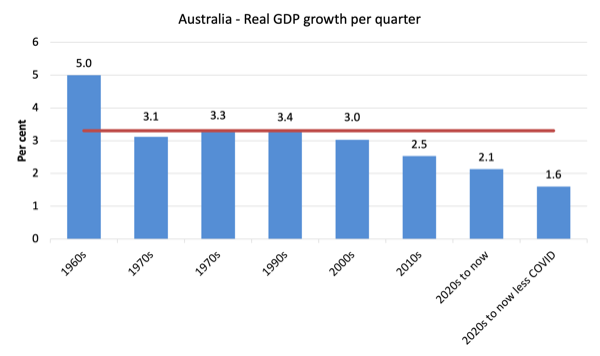
To put this into historical context, the next graph shows the decade average annual real GDP growth rate since the 1960s (the horizontal red line is the average for the entire period (3.26 per cent) from the December-quarter 1960 to the December-quarter 2008).
The 2020-to-now average has been dominated by the pandemic.
But as the previous graph shows, the period after the major health restrictions were lifted has generated lower growth, than if we include the period when the restrictions were in place.
If we take the observations between the June-quarter 2020 and the June-quarter 2022, then the average since 2020 has been 1.6 per cent per annum.
It is also obvious how far below historical trends the growth performance of the last 2 decades have been as the fiscal surplus obsession has intensified on both sides of politics.
Even with a massive household credit binge and a once-in-a-hundred-years mining boom that was pushed by stratospheric movements in our terms of trade, our real GDP growth has declined substantially below the long-term performance.
The 1960s was the last decade where government maintained true full employment.
A GDP per capita recession – deepening
GDP per capita fell for the sixth consecutive quarter, which means that total output averaged out over the entire population contracted for the last 15 months of 2023.
Some consider this to be a deepening recession although what the average actually means is questionable.
With the highly skewed income distribution towards the top end, what we can say if the average is declining, those at the bottom are doing it very tough indeed.
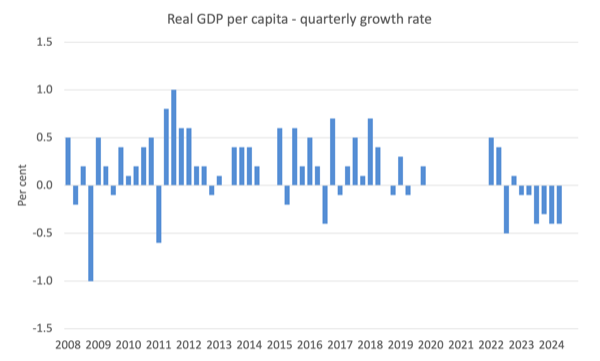
The following graph of real GDP per capita (which omits the pandemic restriction quarters between June-quarter 2020 and December-quarter 2021) tells the story.
Analysis of Expenditure Components
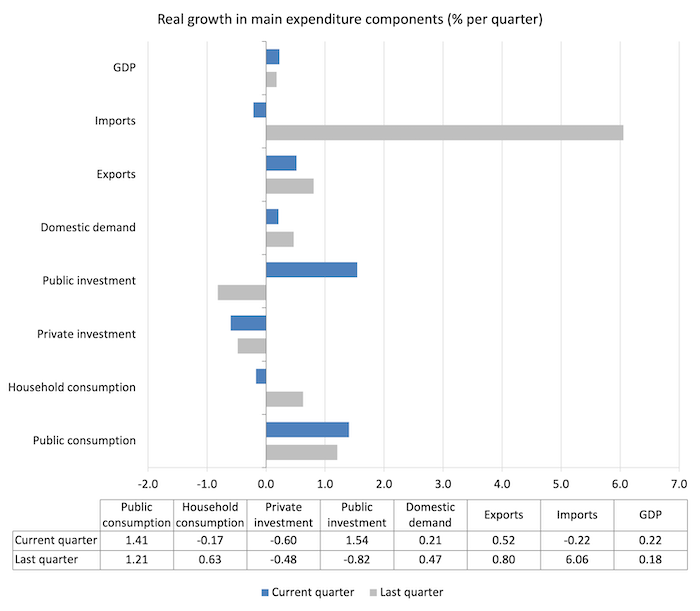
The following graph shows the quarterly percentage growth for the major expenditure components in real terms for the March-quarter 2024 (grey bars) and the June-quarter 2024 (blue bars).
Overall: Australia is just above the water line as a result of government consumption expenditure – but with government still obsessed with surpluses the trend is towards recession and higher unemployment.
Contributions to growth
What components of expenditure added to and subtracted from the change in real GDP growth in the June-quarter 2024?
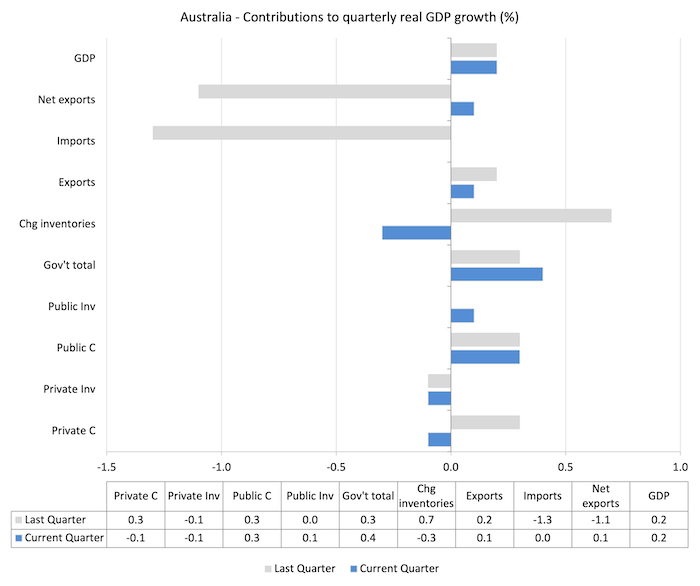
The following bar graph shows the contributions to real GDP growth (in percentage points) for the main expenditure categories. It compares the June-quarter 2024 contributions (blue bars) with the previous quarter (gray bars).
The standout is the contribution of the government sector – both recurrent expenditure (0.3 points) and capital expenditure (0.1 point).
Without that it is likely household consumption growth would have contracted even more than it did and the economy would have entered a GDP-recession.
Material living standards declined in June-quarter and for the year overall
The ABS tell us that:
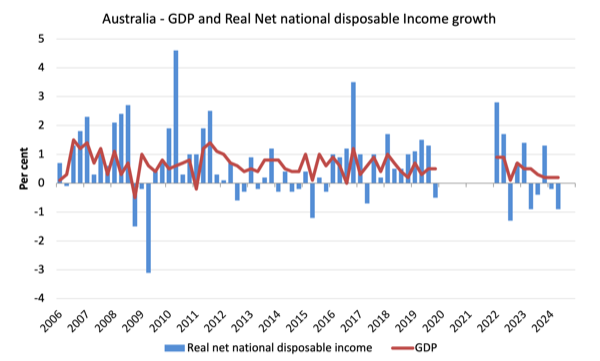
A broader measure of change in national economic well-being is Real net national disposable income. This measure adjusts the volume measure of GDP for the Terms of trade effect, Real net incomes from overseas and Consumption of fixed capital.
While real GDP growth (that is, total output produced in volume terms) rose by 0.2 per cent in the June-quarter, real net national disposable income growth fell by 0.9 per cent.
How do we explain that?
Answer: The terms of trade fell by 3 per cent in the June-quarter and by 3.8 per cent for the last 12 months.
Household saving ratio was subdued but steady at 0.6 per cent
The ABS noted that:
The household saving to income ratio remained at 0.6%, as growth in gross disposable income outpaced growth in nominal household consumption …
The RBA has been trying to wipe out the household saving buffers as it hiked interest rates hoping that this would reduce the likelihood of recession.
Of course, that process has attacked the lower-end of the wealth and income distribution, given the rising interest rates have poured millions into those with interest-rate sensitive financial assets.
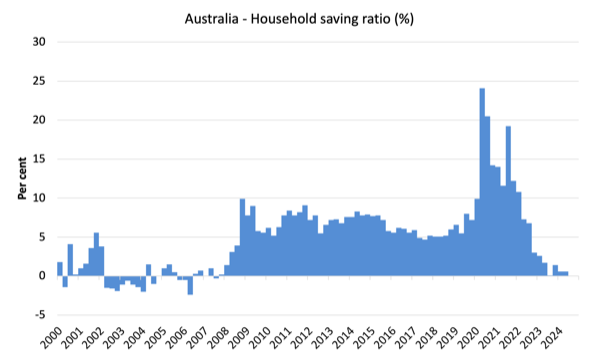
The following graph shows the household saving ratio (% of disposable income) from the December-quarter 2000 to the current period.
It shows the period leading up to the GFC, where the credit binge was in full swing and the saving ratio was negative to the rise during the GFC and then the most recent rise.
The current position is that households are being squeezed by a combination of rising living costs, elevated interest rates and low wages growth, which is forcing households to reduce their savings rate to maintain expenditure on essentials.
The next graph shows the saving ratio since 1960, which illustrates the way in which the neoliberal period has squeezed household saving.
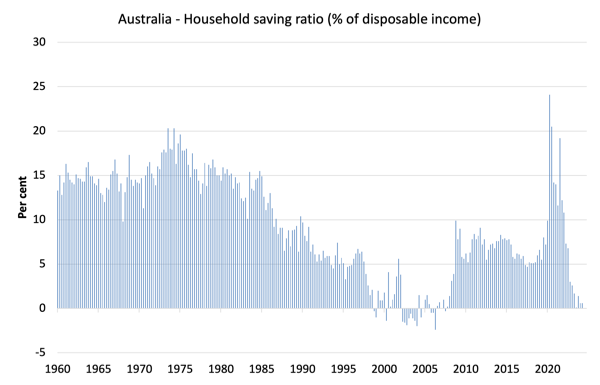
Going back to the pre-GFC period, the household saving ratio was negative and consumption growth was maintained by increasing debt – which is an unsustainable strategy given that household debt so high.
Households are now cutting back on consumption spending and that will ultimately drive the economy into recession unless the government support continues at increasing levels.
The following table shows the impact of the neoliberal era on household saving. These patterns are replicated around the world and expose our economies to the threat of financial crises much more than in pre-neoliberal decades.
The result for the current decade (2020-) is the average from June 2020.
| Decade | Average Household Saving Ratio (% of disposable income) |
| 1960s | 14.4 |
| 1970s | 16.2 |
| 1980s | 11.9 |
| 1990s | 5.0 |
| 2000s | 1.4 |
| 2010s | 6.7 |
| 2020s on | 8.9 |
| Since RBA hikes | 2.1 |
Real GDP growth rose but hours worked rose more – with productivity growth declining
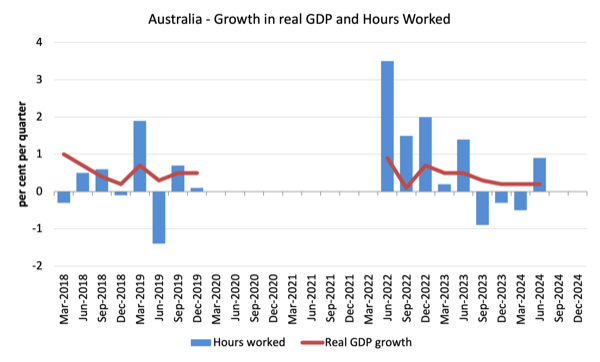
Real GDP rose 0.2 points in the quarter, while working hours rose by 0.9 per cent.
Which means that GDP per hour worked fell by 0.83 points for the quarter – that is, an increase in labour productivity.
However over the last 12 months, productivity growth averaged 0.42 per cent on the back of declining hours.
The following graph presents quarterly growth rates in real GDP and hours worked using the National Accounts data for the last five years to the June-quarter 2024.
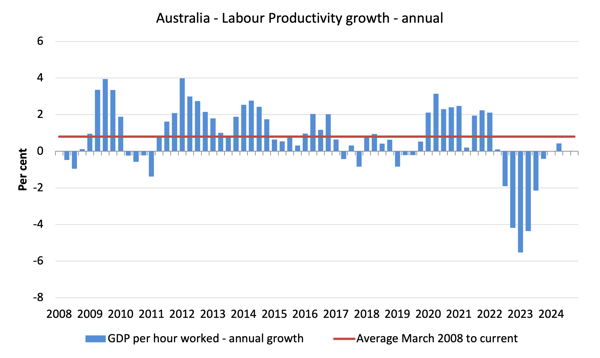
To see the above graph from a different perspective, the next graph shows the annual growth in GDP per hour worked (labour productivity) from the June-quarter 2008 quarter to the June-quarter 2024.
The horizontal red line is the average annual growth since June-quarter 2008 (0.8 per cent), which itself is an understated measure of the long-term trend growth of around 1.5 per cent per annum.
The relatively strong growth in labour productivity in 2012 and the mostly above average growth in 2013 and 2014 helps explain why employment growth was lagging given the real GDP growth. Growth in labour productivity means that for each output level less labour is required.
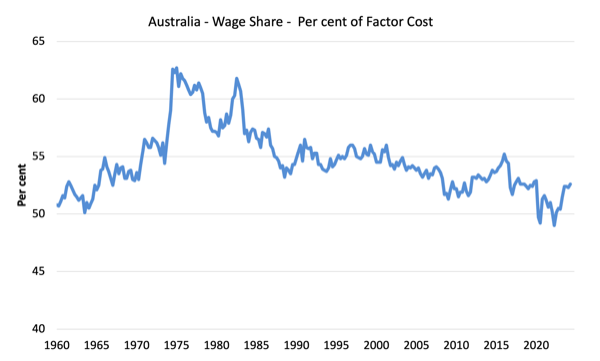
The distribution of national income – wage share rises slightly
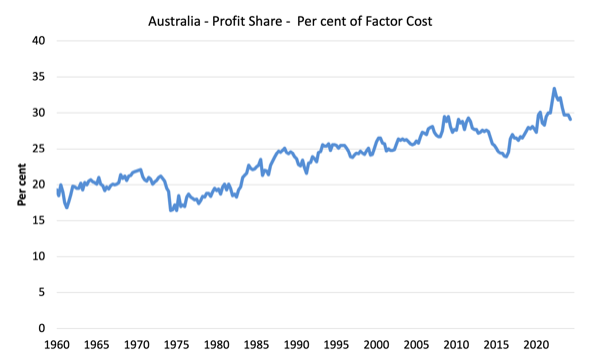
The wage share in national income rose to 52.6 per cent (up 0.3 points) while the profit share fell to 29.1 per cent (down 0.6 points).
The first graph shows the wage share in national income while the second shows the profit share.
The declining share of wages historically is a product of neoliberalism and will ultimately have to be reversed if Australia is to enjoy sustainable rises in standards of living without record levels of household debt being relied on for consumption growth.
Conclusion
Remember that the National Accounts data is three months old – a rear-vision view – of what has passed and to use it to predict future trends is not straightforward.
So in the June-quarter (March to the end of June), the Australian economy has slowed to 0.2 per cent – annualised at below 1 per cent.
Given the trends, it is likely that the September-quarter (where we are currently) will show negative growth.
The major reason that the June-quarter didn’t record a contraction overall was the contribution of government spending – mostly recurrent government spending due to transfers to ease the cost-of-living-pressures.
The largest component of national expenditure – household consumption spending – contracted and will worsen in the months to come.
Overall fiscal policy and monetary policy are squeezing household expenditure and the contribution of direct government spending, while positive, will not be sufficient to fill the expanding non-government spending gap.
At the current growth rate, unemployment will rise.
And that will be a deliberate act from our policy makers.
That is enough for today!
(c) Copyright 2024 William Mitchell. All Rights Reserved.
The more people I see that get educated from MMT, the brighter and more hopeful I see what the future will become.
.