Over the last several years, I have been indicating that I think we are in…
Australian labour market – mixed signals but probably still in a weakening phase
Last month’s Labour Force data release for April 2024, revealed that the Australian labour market was starting to weaken in the face of the fiscal squeeze (the government announced a second successive annual fiscal surplus on Tuesday) and the 11 interest rate hikes since May 2022. Today (May 16, 2024), the Australian Bureau of Statistics released the latest – Labour Force, Australia – for April 2024, which shows that there are mixed signals which make it hard to say categorically where things are or where they are going. Total employment growth was positive and the participation rate increased, which usually signals a strengthening labour market. But full-time employment fell and monthly hours worked were static. Further both the unemployment rate and the underemployment rate rose, which indicates weakness, notwithstanding the fact that the participation rate increase accounted for some of the rise in unemployment. Moreover, there is now 10.8 per cent of the working age population (1.58 million people) who are available and willing but cannot find enough work – either unemployed or underemployed and that proportion is increasing. Australia is not near full employment despite the claims by the mainstream commentators and it is hard to characterise this as a ‘tight’ labour market.
In the ABS Media Release – Unemployment rate rises to 4.1% in April, along with higher participation – the ABS noted that:
The seasonally adjusted unemployment rate rose by 0.2 percentage points to 4.1 per cent in April, up from a revised 3.9 per cent in March …
With employment rising by around 38,000 people and the number of unemployed growing by 30,000 people, the unemployment rate rose to 4.1 per cent and the participation rate increased to 66.7 per cent. …
The 30,000 people increase in unemployment reflected more people without jobs available and looking for work, and also more people than usual indicating that they had a job that they were waiting to start in …
The employment-to-population ratio remained steady at 64.0 per cent in April, indicating that recent employment growth is broadly keeping pace with population growth.
General conclusion:
1. A mixed bag – employment growth returned although full-time employment fell and hours of work was steady.
2. Participation rose which meant that employment growth had to contend with the underlying population growth in addition to the higher proportion of working age people wanting jobs.
3. Unemployment continued to rise.
4. Moreover, underemployment rose and the broad underutilisation rate rose 0.4 points to 10.7 per cent – which is an indicator of weakness.
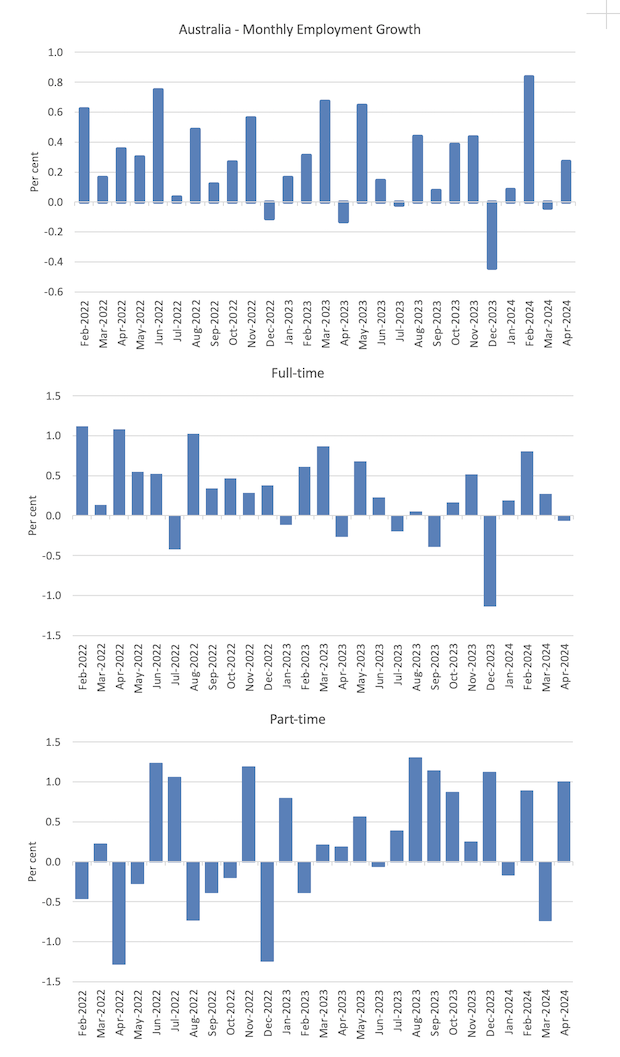
Employment rose 38,500 (0.3 per cent) in April 2024
1. full-time employment fell by 6.1 thousand and part-time employment increased by 44.6 thousand.
2. The employment-population ratio remained steady at 64.0 per cent – a reliable indicator that the labour market was marking time.
The following graph show the month by month growth in total, full-time, and part-time employment for the 24 months to April 2024 using seasonally adjusted data.
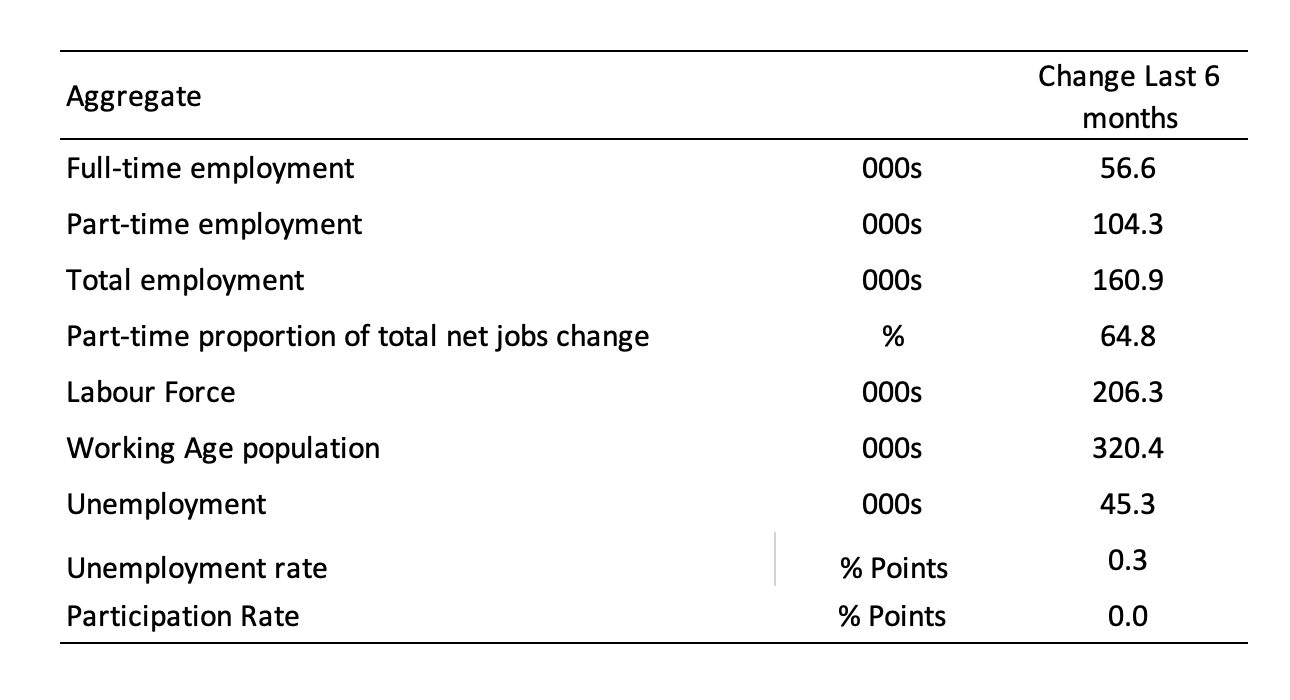
The following table provides an accounting summary of the labour market performance over the last six months to provide a longer perspective that cuts through the monthly variability and provides a better assessment of the trends.
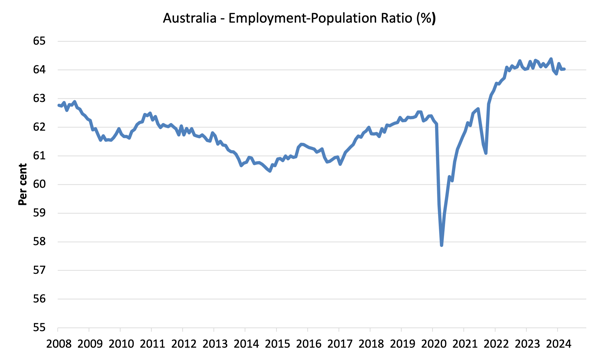
Given the variation in the labour force estimates, it is sometimes useful to examine the Employment-to-Population ratio (%) because the underlying population estimates (denominator) are less cyclical and subject to variation than the labour force estimates. This is an alternative measure of the robustness of activity to the unemployment rate, which is sensitive to those labour force swings.
The following graph shows the Employment-to-Population ratio, since April 2008 (that is, since the GFC).
The employment-to-population ratio is still demonstrating stability with minor fluctuations around the current level.
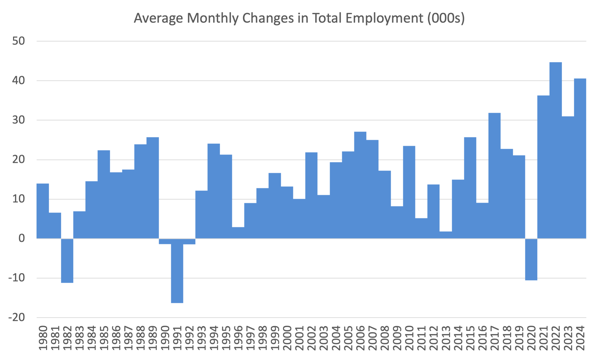
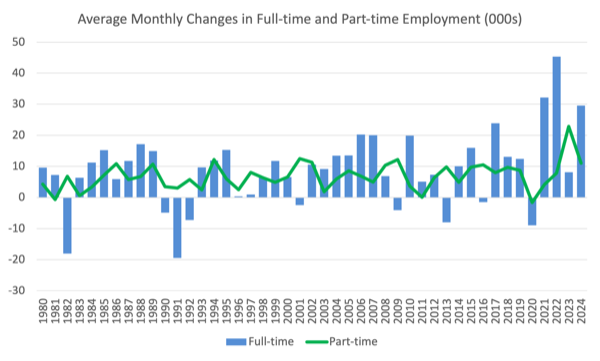
For perspective, the following graph shows the average monthly employment change for the calendar years from 1980 to 2024.
1. The average employment change over 2020 was -10.6 thousand which rose to 36.3 thousand in 2021 as the lockdowns eased.
2. For 2022, the average monthly change was 44.7 thousand, and for 2023, the average change was 31 thousand.
3. So far in 2024, the average monthly change is 40.6 thousand.
The following graph shows the average monthly changes in Full-time and Part-time employment in thousands since 1980.
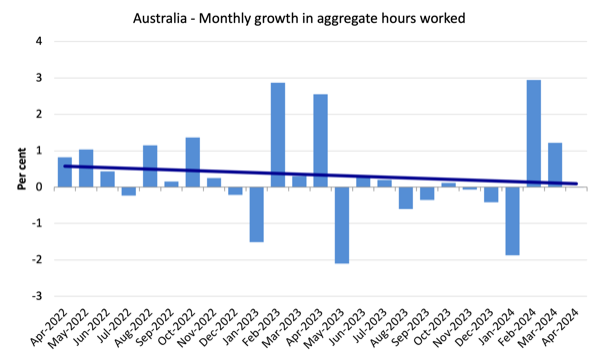
Aggregate monthly hours were unchanged in April 2024
There was no change in hours worked.
The following graph shows the monthly growth (in per cent) over the last 48 months (with the pandemic restriction period omitted).
The dark linear line is a simple regression trend of the monthly change.
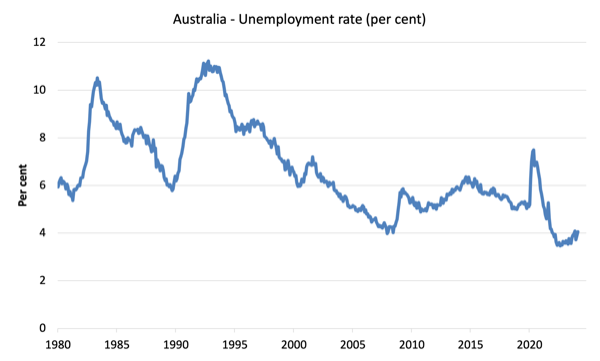
Unemployment rose 30,300 to 604,200 persons in April 2024
Usually a rise in unemployment associated with positive employment growth and a rising participation rate is seen as an indicator of a labour market on the improve.
The rising participation is usually suggestive of increased confidence as employment opportunities grow and the hidden unemployed decide to come back into to the job search process.
At the moment, it is too early to tell whether that is the case or not this time.
As I noted above, we have mixed signals.
The following graph shows the national unemployment rate from April 1980 to April 2024. The longer time-series helps frame some perspective to what is happening at present.
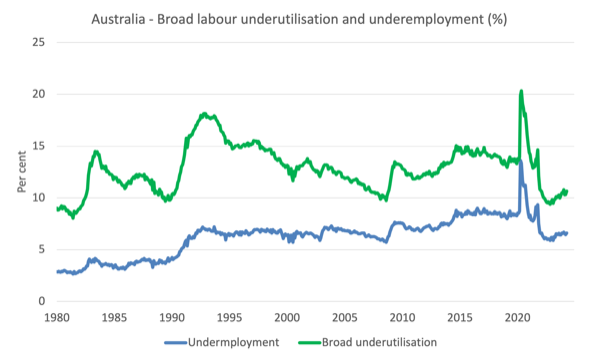
Broad labour underutilisation rose 0.4 points at 10.7 per cent in April 2024
1. Underemployment rate rose 0.1 point to 6.6 per cent (+27.2 thousand).
2. Overall there are 984.5 thousand underemployed workers.
3. The total labour underutilisation rate (unemployment plus underemployment) rose 0.4 points at 10.7 per cent.
4. There were a total of 1588.7 thousand workers either unemployed or underemployed.
The fact that there is 10.7 per cent of workers who are both available and willing to work that are without work in one way or another (unemployed or underemployed) makes a mockery of claims by economic commentators and policy officials that Australia is near full employment or that this is a tight labour market.
The following graph plots the seasonally-adjusted underemployment rate in Australia from April 1980 to the April 2024 (blue line) and the broad underutilisation rate over the same period (green line).
The difference between the two lines is the unemployment rate.
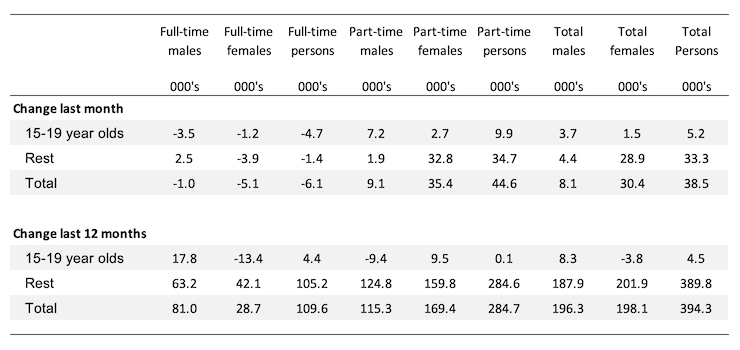
Teenage labour market sheds full-time jobs in April 2024
Overall teenage employment rose by 5.2 thousand but full-time employment fell by 4.7 thousand while part-time employment fell 9.9 thousand.
The following Table shows the distribution of net employment creation in the last month and the last 12 months by full-time/part-time status and age/gender category (15-19 year olds and the rest).
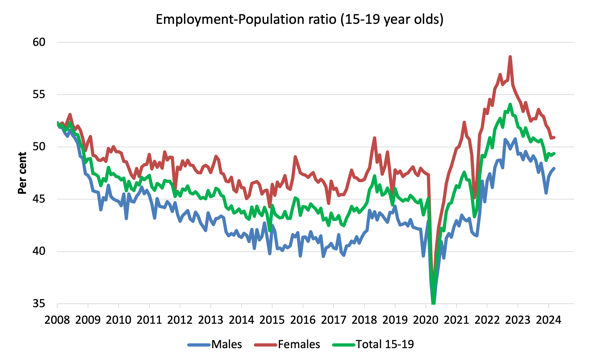
To put the teenage employment situation in a scale context (relative to their size in the population) the following graph shows the Employment-Population ratios for males, females and total 15-19 year olds since July 2008.
You can interpret this graph as depicting the change in employment relative to the underlying population of each cohort.
In terms of the recent dynamics:
1. The male ratio rose 0.3 points over the month.
2. The female ratio rose 0.1 point over the month.
3. The overall teenage employment-population ratio rose 0.2 points over the month.
Conclusion
My standard monthly warning: we always have to be careful interpreting month to month movements given the way the Labour Force Survey is constructed and implemented.
My overall assessment is:
1. There are mixed signals which make it hard to say categorically where things are or where they are going.
2. Total employment growth was positive and the participation rate increased, which usually signals a strengthening labour market.
3. But full-time employment fell and monthly hours worked were static.
4. Further both the unemployment rate and the underemployment rate rose, which indicates weakness, notwithstanding the fact that the participation rate increase accounted for some of the rise in unemployment.
5. Moreover, there is now 10.8 per cent of the working age population (1.58 million people) who are available and willing but cannot find enough work – either unemployed or underemployed and that proportion is increasing.
7. Australia is not near full employment despite the claims by the mainstream commentators and it is hard to characterise this as a ‘tight’ labour market.
Advance orders for my new book are now available
I am in the final stages of completing my new book, which is co-authored by Warren Mosler.
The book will be titled: Modern Monetary Theory: Bill and Warren’s Excellent Adventure.

The description of the contents is:
In this book, William Mitchell and Warren Mosler, original proponents of what’s come to be known as Modern Monetary Theory (MMT), discuss their perspectives about how MMT has evolved over the last 30 years,
In a delightful, entertaining, and informative way, Bill and Warren reminisce about how, from vastly different backgrounds, they came together to develop MMT. They consider the history and personalities of the MMT community, including anecdotal discussions of various academics who took up MMT and who have gone off in their own directions that depart from MMT’s core logic.
A very much needed book that provides the reader with a fundamental understanding of the original logic behind ‘The MMT Money Story’ including the role of coercive taxation, the source of unemployment, the source of the price level, and the imperative of the Job Guarantee as the essence of a progressive society – the essence of Bill and Warren’s excellent adventure.
The introduction is written by British academic Phil Armstrong.
You can find more information about the book from the publishers page – HERE.
It will be published on July 15, 2024 but you can pre-order a copy to make sure you are part of the first print run by E-mailing: info@lolabooks.eu
The special pre-order price will be a cheap €14.00 (VAT included).
That is enough for today!
(c) Copyright 2024 William Mitchell. All Rights Reserved.
This Post Has 0 Comments