The recent extreme weather in the northern hemisphere, the twin monster tropical storms in Japan,…
Australian labour market – unemployment drops sharply – good news
Today (March 21, 2024), the Australian Bureau of Statistics released the latest – Labour Force, Australia – for February 2024, which shows that the weakening we observed over the holiday period has reversed and was probably due to variations in flow behaviour over the break that has become evident since the pandemic. As I noted in the January analysis, the changing holiday behaviour that has become evident (many people now working zero hours in January) makes it difficult to be definitive about the February result, which is excellent. Employment growth was strong as those zero-hour workers resumed work and the net job creation easily outstripped the rising participation rate. The drop in unemployment is a boost as is the drop in underemployment. However, there is still 10.3 per cent of the available and willing working age population who are being wasted in one way or another – either unemployed or underemployed and that proportion is increasing. Australia is not near full employment despite the claims by the mainstream commentators and it is hard to characterise this as a ‘tight’ labour market. The return to a 3.7 per cent unemployment – the level that was very stable in the period since mid-to-late 2022 makes a mockery of economists who think that interest rate hikes would always push up unemployment. And with unemployment and inflation falling, the current unemployment rate cannot be below some NAIRU, which also makes a mockery of the the RBA’s stated research and policy logic. The reality is that inflation has fallen as the supply factors abate and the interest rate hikes were totally unnecessary.
The summary ABS Labour Force (seasonally adjusted) estimates for February 2024 are:
- Employment rose 116,500 (0.8 per cent) – full-time employment increased by 78.2 thousand and part-time employment increased by 38.3 thousand. Part-time share of total was 30.6 per cent.
- Unemployment fell 52,000 to 548,300 persons.
- The official unemployment rate decreased to 3.7 per cent (-0.4 points).
- The participation rate rose 0.1 point at 66.7 per cent.
- The employment-population ratio rose 0.3 points to 64.2 per cent.
- Aggregate monthly hours rose by 53 million (+2.8 per cent).
- Underemployment rate fell 0.1 point to 6.6 per cent (-12.5 thousand). Overall there are 974.5 thousand underemployed workers. The total labour underutilisation rate (unemployment plus underemployment) fell 0.5 points to 10.3 per cent. There were a total of 1522.7 thousand workers either unemployed or underemployed.
In the ABS Media Release – Unemployment rate falls to 3.7% as more people start work – the ABS noted that:
The seasonally adjusted unemployment rate fell by 0.4 percentage points to 3.7 per cent in February …
With employment growing by around 116,000 people, and the number of unemployed falling by 52,000 people, the unemployment rate fell to 3.7 per cent. This was around where it had been six months earlier …
The large increase in employment in February followed larger-than-usual numbers of people in December and January who had a job that they were waiting to start or to return to. This translated into a larger-than-usual flow of people into employment in February and even more so than February last year.
Conclusion: The result is good and it has been difficult trying to get a definitive assessment of what is going on because since the pandemic, the pattern of holiday leave has changed and so the December and January figures have departed from their normal flow behaviour.
In January, there was a large number working zero hours who indicated in the survey that they would resume work in February.
That seems to have happened with a massive boost to employment evident, which has led to the unemployment rate falling sharply and the employment-to-population rate rising accordingly.
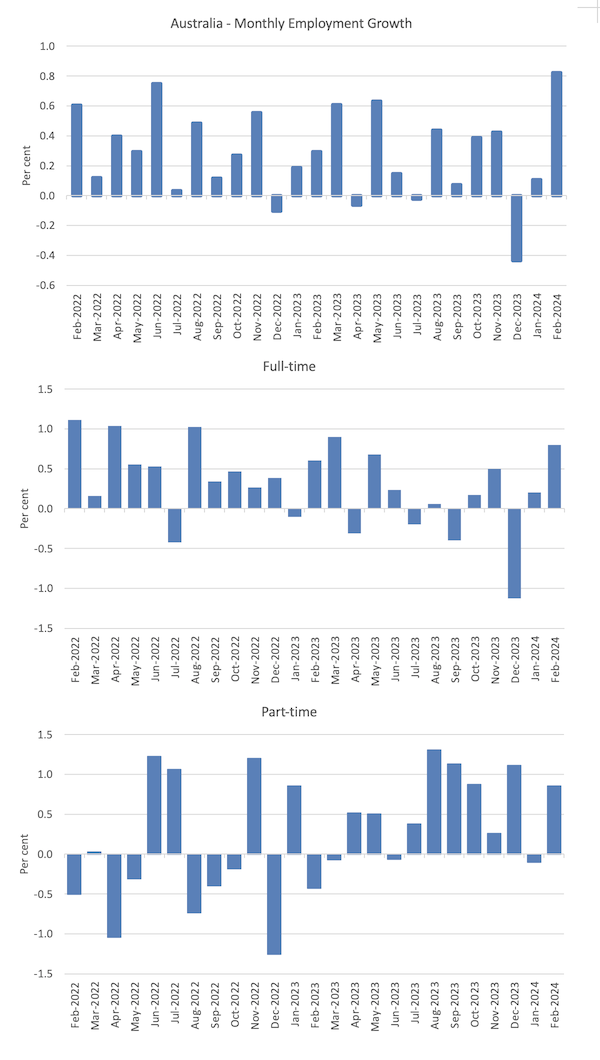
Employment rose 116,500 (0.8 per cent) in February 2024
1. Full-time employment increased by 78.2 thousand (0.8 per cent) and part-time employment increased by 38.3 thousand (0.9 per cent).
2. The employment-population ratio rose 0.3 points to 64.2 per cent.
The following graph show the month by month growth in total, full-time, and part-time employment for the 24 months to February 2024 using seasonally adjusted data.
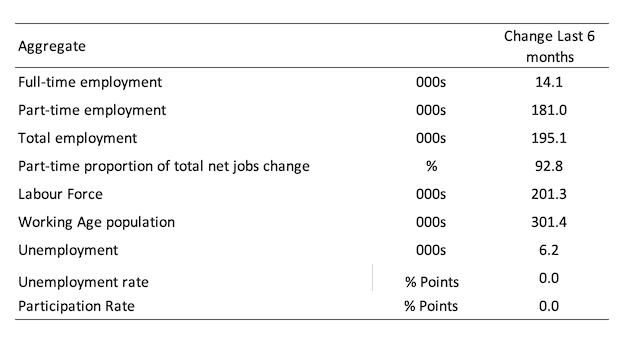
The following table provides an accounting summary of the labour market performance over the last six months to provide a longer perspective that cuts through the monthly variability and provides a better assessment of the trends.
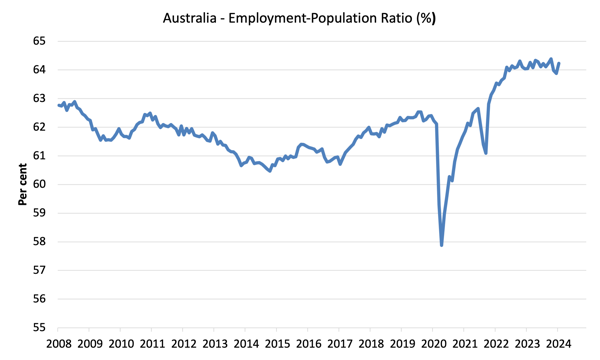
Given the variation in the labour force estimates, it is sometimes useful to examine the Employment-to-Population ratio (%) because the underlying population estimates (denominator) are less cyclical and subject to variation than the labour force estimates. This is an alternative measure of the robustness of activity to the unemployment rate, which is sensitive to those labour force swings.
The following graph shows the Employment-to-Population ratio, since February 2008 (that is, since the GFC).
The employment-to-population ratio is still demonstrating stability with minor fluctuations around the current level.
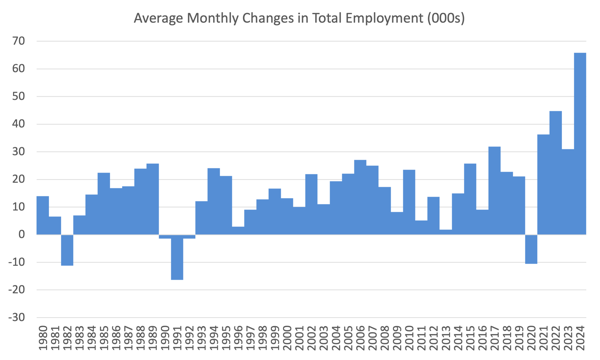
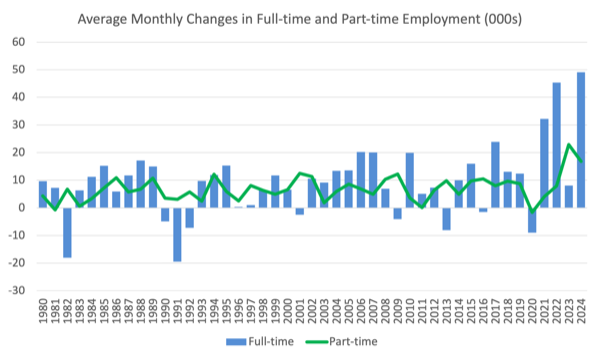
For perspective, the following graph shows the average monthly employment change for the calendar years from 1980 to 2023.
1. The average employment change over 2020 was -8.9 thousand which rose to 36.6 thousand in 2021 as the lockdowns eased.
2. For 2022, the average monthly change was 44 thousand, and for 2023, the average change was 31 thousand.
3. So far in 2024, the change is 65.9 thousand.
The following graph shows the average monthly changes in Full-time and Part-time employment in thousands since 1980.
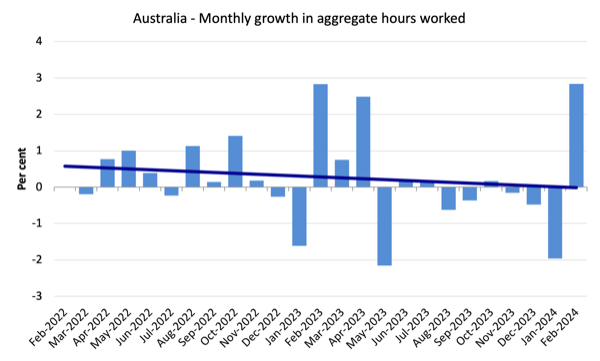
Aggregate monthly hours rose by 53 million (+2.8 per cent) in February 2024
The strong February result reverse the drop in January which was the result of changes in behaviour as to when holiday leave is taken – more people are now working zero hours in January than before and that reversed in February.
The following graph shows the monthly growth (in per cent) over the last 48 months (with the pandemic restriction period omitted).
The dark linear line is a simple regression trend of the monthly change.
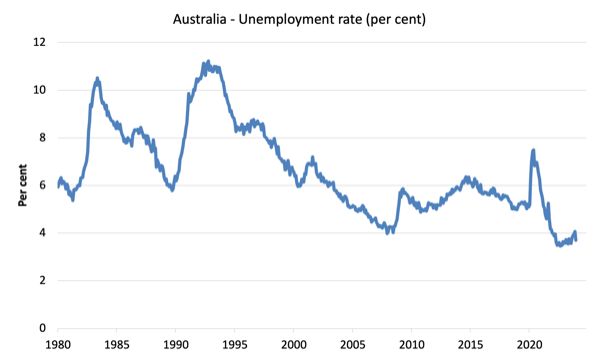
Unemployment fell 52,000 to 548,300 persons in February 2024
The strong employment growth more than outstripped the rising participation rate and as a result official unemployment fell sharply.
The following graph shows the national unemployment rate from February 1980 to February 2024. The longer time-series helps frame some perspective to what is happening at present.
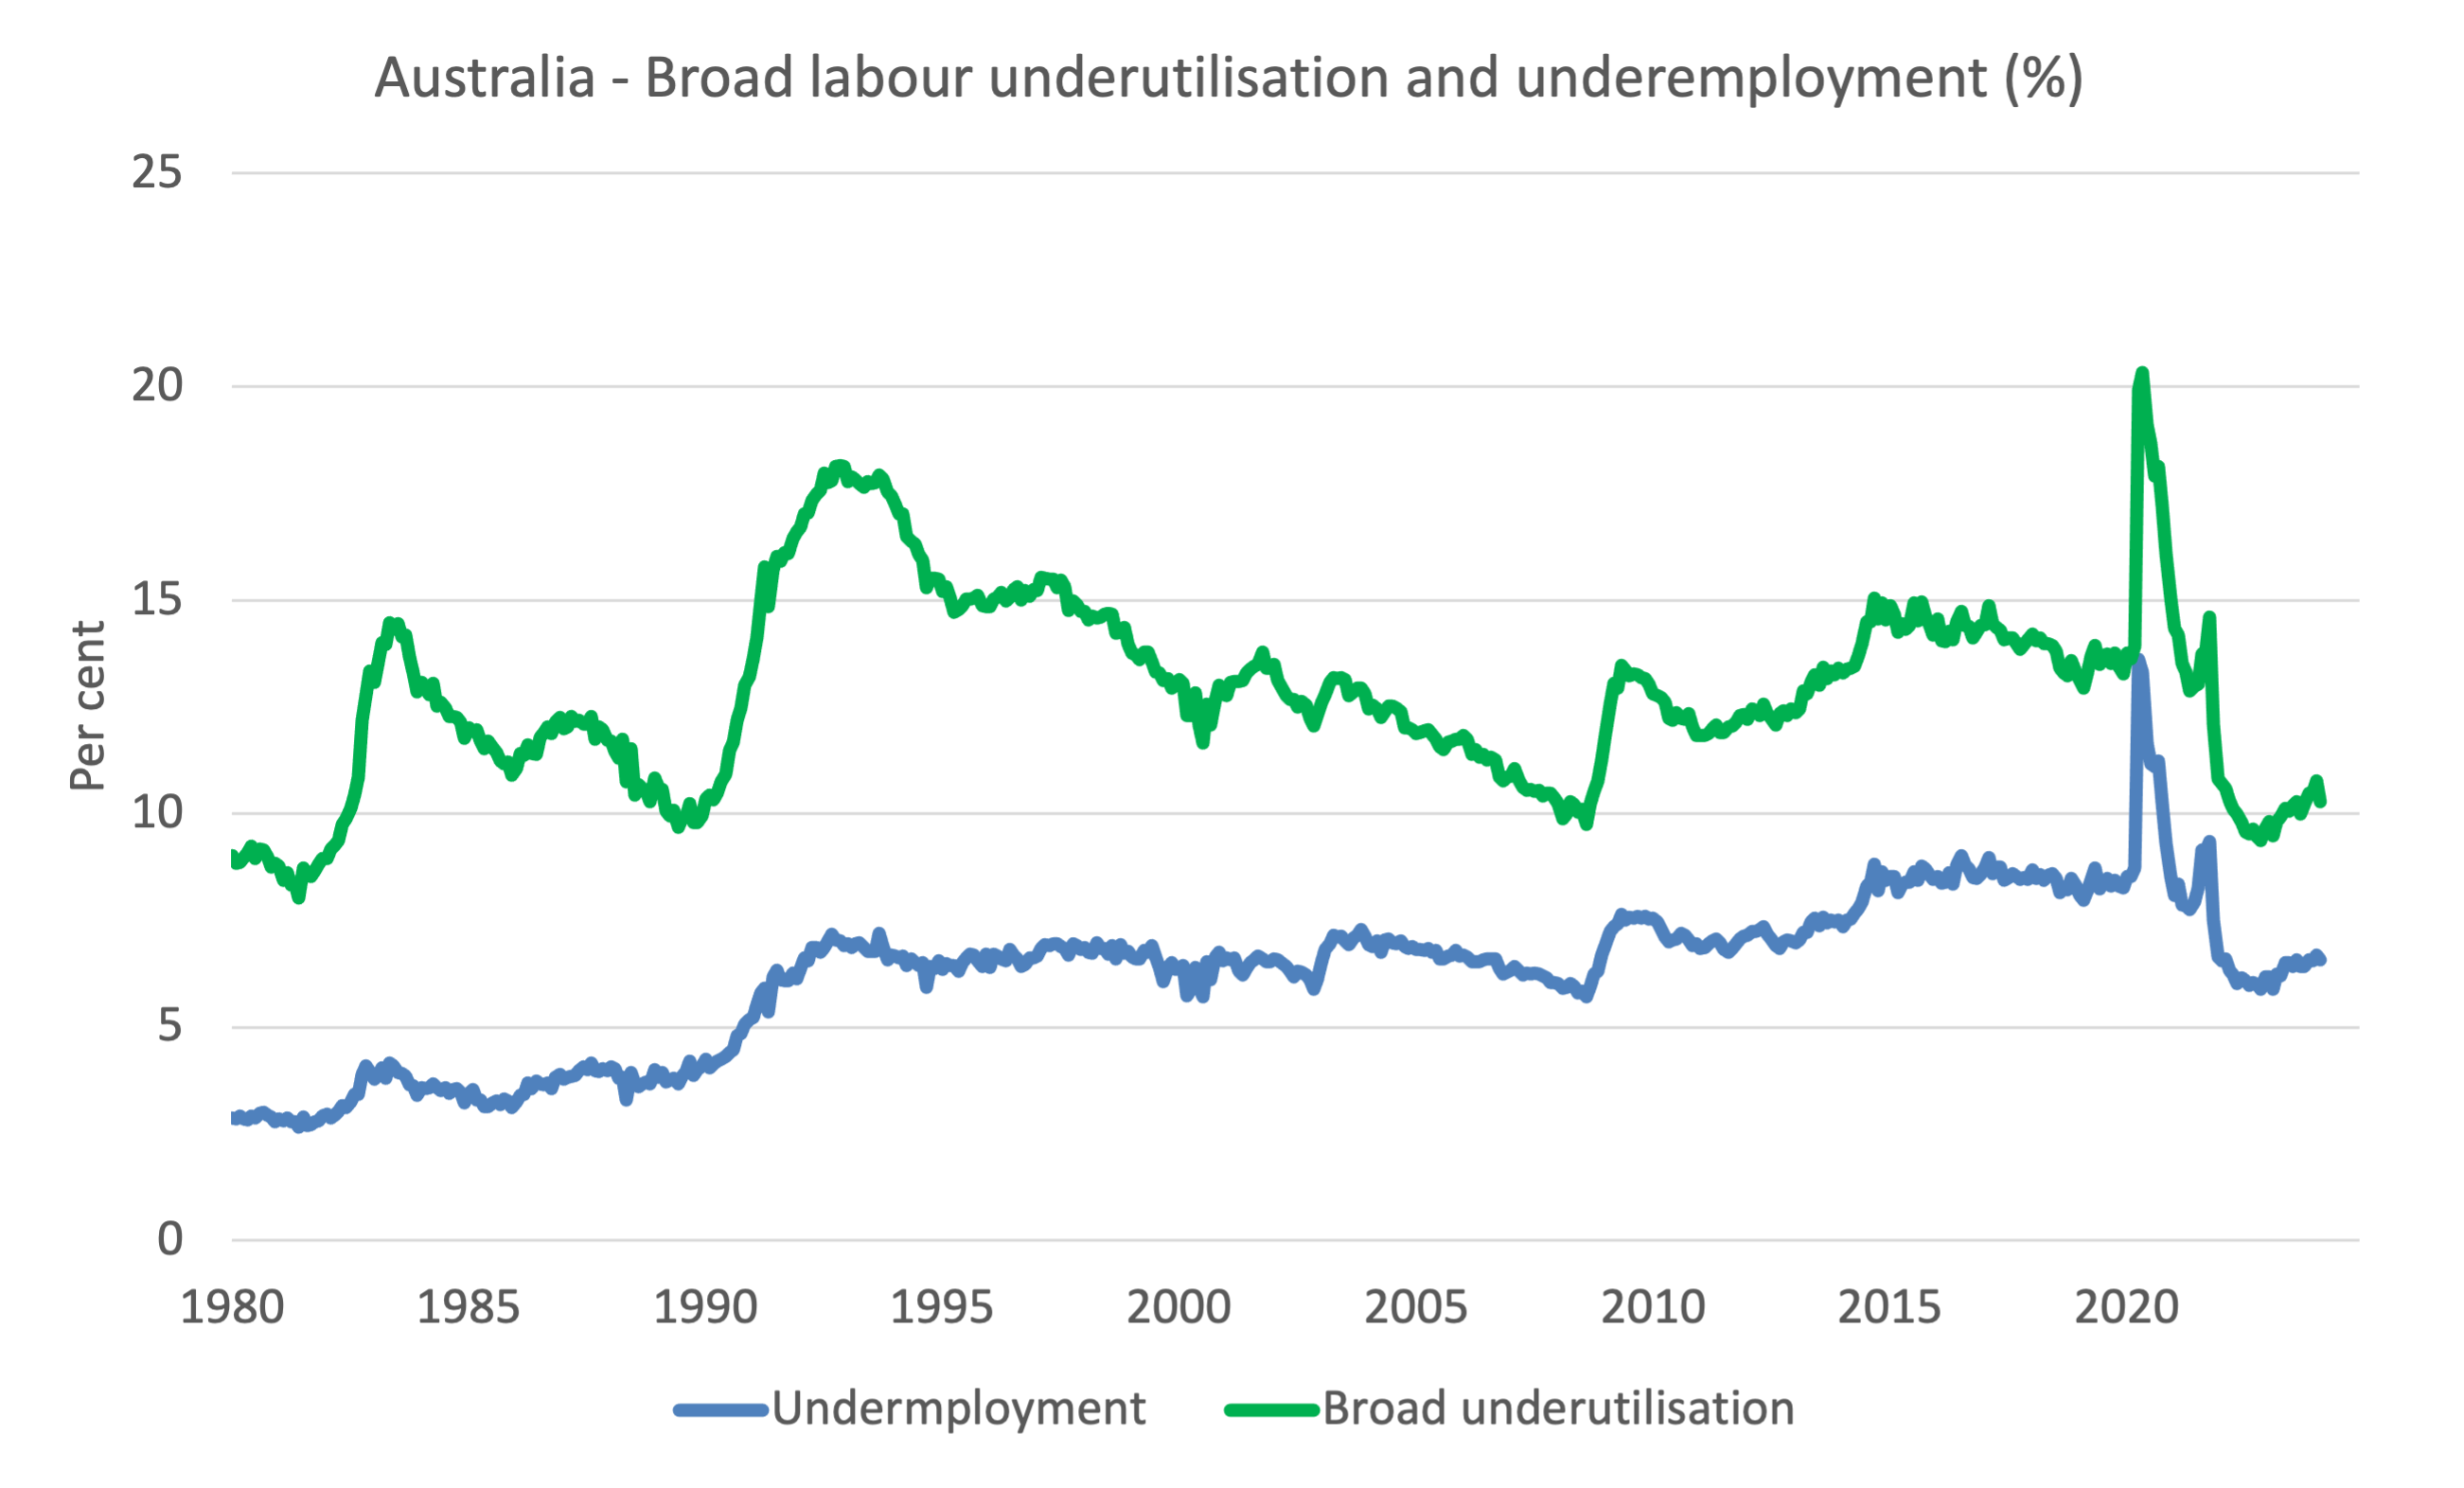
Broad labour underutilisation fell 0.5 points to 10.3 in February 2024
1. Underemployment rate fell 0.1 point to 6.6 per cent (-12.5 thousand).
2. Overall there are 974.5 thousand underemployed workers.
3. The total labour underutilisation rate (unemployment plus underemployment) fell 0.5 points to 10.3 per cent.
4. There were a total of 1522.7 thousand workers either unemployed or underemployed.
While the sharp decline to 10.3 per cent in the broad underutilisation rate is welcome, it still means that 1,522.7 thousand persons who are available and willing to work are without work in one way or another (unemployed or underemployed), which makes a mockery of claims by economic commentators and policy officials that Australia is near full employment or that this is a tight labour market.
The following graph plots the seasonally-adjusted underemployment rate in Australia from April 1980 to the February 2024 (blue line) and the broad underutilisation rate over the same period (green line).
The difference between the two lines is the unemployment rate.
Teenage labour market improves in February 2024
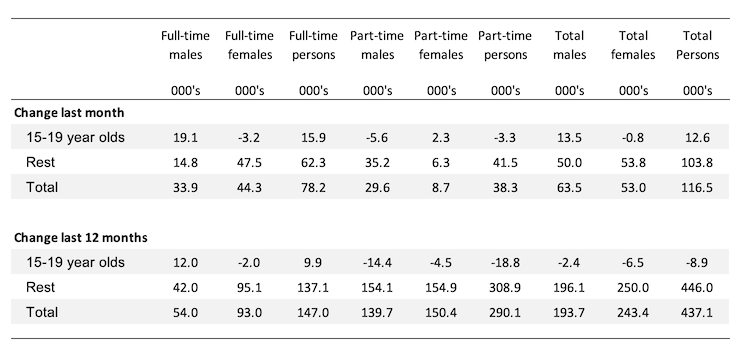
Overall teenage employment rose by 12.6 thousand with full-time employment rising 15.9 thousand while part-time employment fell 3.3 thousand.
The following Table shows the distribution of net employment creation in the last month and the last 12 months by full-time/part-time status and age/gender category (15-19 year olds and the rest).
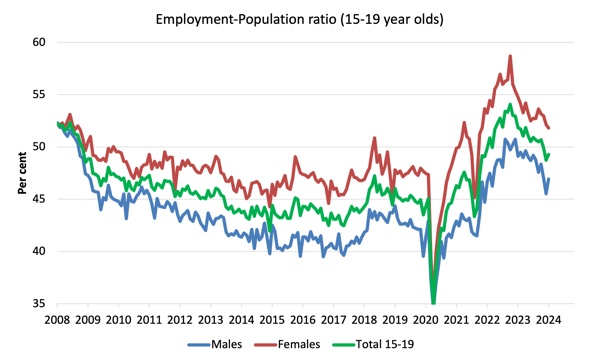
To put the teenage employment situation in a scale context (relative to their size in the population) the following graph shows the Employment-Population ratios for males, females and total 15-19 year olds since July 2008.
You can interpret this graph as depicting the change in employment relative to the underlying population of each cohort.
In terms of the recent dynamics:
1. The male ratio rose 1.4 points over the month.
2. The female ratio fell 0.3 points over the month.
3. The overall teenage employment-population ratio rose 0.6 points over the month.
The graph shows that despite the uptick in February, there has been an on-going deterioration in the job opportunities for the growing teenage population since November 2022.
The RBA’s desire to deliberately create unemployment in Australia has probably damaged this cohort more than any.
And this cohort is the future workers who we will depend on for higher productivity as the population ages.
It is smart policy (not!) to undermine their work opportunities at the age that they will be acquiring skills and experience.
Conclusion
My standard monthly warning: we always have to be careful interpreting month to month movements given the way the Labour Force Survey is constructed and implemented.
My overall assessment is:
1. As I noted in the January analysis, the changing holiday behaviour that has become evident (many people now working zero hours in January) makes it difficult to be definitive about the February result, which is excellent.
2. Employment growth was strong as those zero-hour workers resumed work and the net job creation easily outstripped the rising participation rate.
3. The drop in unemployment is a boost as is the drop in underemployment.
4. However, there is still 10.3 per cent of the available and willing working age population who are being wasted in one way or another – either unemployed or underemployed and that proportion is increasing.
5. Australia is not near full employment despite the claims by the mainstream commentators and it is hard to characterise this as a ‘tight’ labour market.
6. The return to a 3.7 per cent unemployment – the level that was very stable in the period since mid-to-late 2022 makes a mockery of economists who think that interest rate hikes would always push up unemployment.
And with unemployment and inflation falling, the current unemployment rate cannot be below some NAIRU, which also makes a mockery of the the RBA’s stated research and policy logic.
The reality is that inflation has fallen as the supply factors abate and the interest rate hikes were totally unnecessary.
That is enough for today!
(c) Copyright 2024 William Mitchell. All Rights Reserved.
When the narrative fails and it becomes evident that inflation can’t be tackled with rising unemployment, mainstreamers just keep at it, because they know nothing better.
In any other job, they would all get sacked.
Except in economics, because they are not expected to follow any kind of logic.
Their only logic is to serve the interest of the wealthy.
The usual propaganda accompanied this welcome unemployment news in Australia.
Even on the supposedly independent ABC bank economists cheerfully stepped up to remind us that this means a tightening labour market so the good news is also bad news!
Lower unemployment means we could suffer continued or even higher inflation, so the RBA will have no alternative (!) but to keep interest rates high in the foreseeable future, we are assured.
There is a seemingly inexhaustable supply of these people available to embellish economic announcements by ramming home the mainstream economic narrative in brief, unchallenged grabs that would suggest that agreement with this fiction is unanimous among economists.
I have even heard the RBA governor applauded for having great understanding and empathy for the victims of her unavoidable decisions, cold comfort especially if we know they were in fact totally unnecessary.
The current era of economic debate seems to be very similar to how I imagine general debates were in the pre-enlightenment era. Mostly dogma and unquestioned assumptions.
How do we prepare for a future with diminishing and lower paid employment?
Do we have to wait for problems to be solved, ‘one funeral at a time.’
Neo-liberalism is looking decidedly pre enlightenment, and I doubt that Jesus is going to ride to our rescue. Where are the three wise men when you need them?