I have been 'at it' for decades now but it never ceases to amaze me…
Australia – inflation falling rapidly
Today (January 31, 2024), the Australian Bureau of Statistics released the latest – Consumer Price Index, Australia – for the December-quarter 2023. The data showed that the inflation rate continues to fall sharply – down to 4.1 per cent from 5.2 per cent in line with global supply trends. There is nothing in this quarterly release that would justify further interest rate rises. Yesterday, the ABS published the latest – Retail Trade – data for December 2023, which showed a marked slowdown in consumer spending in December 2023 after many consumers brought forward spending in November 2023 to take advantage of the discount sales. So it is likely that overall spending is subdued and I expect the inflation rate to continue to decline in the next three months.
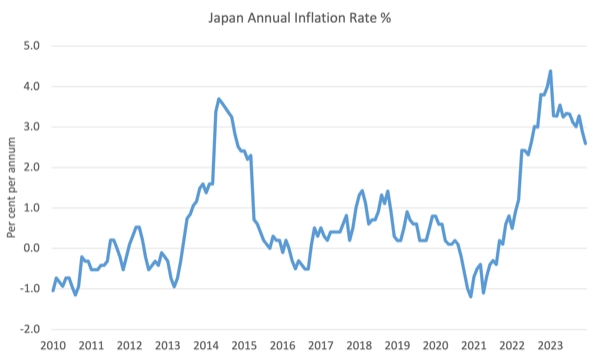
Japan’s inflation decline
On January 19, 2024, the Japanese National Statistical Agency published the December – Consumer Price Index – data.
In December 2023, the annual inflation rate was down to 2.6 per cent (from 2.9 per cent in November 2023 and was -0.1 per cent for the month, the second successive negative monthly inflation result.
So its over.
Here is the Japanese monthly annual inflation rate since 2010 (to December 2023).
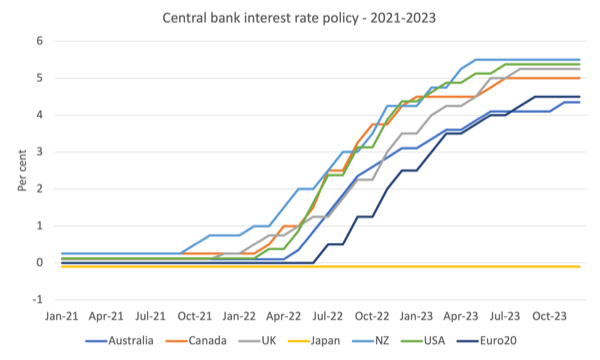
I thought the next two graphs were interesting.
The first shows the movements in central bank monetary policy interest rates since March 2017.
The sheep all move together and Japan stands apart.
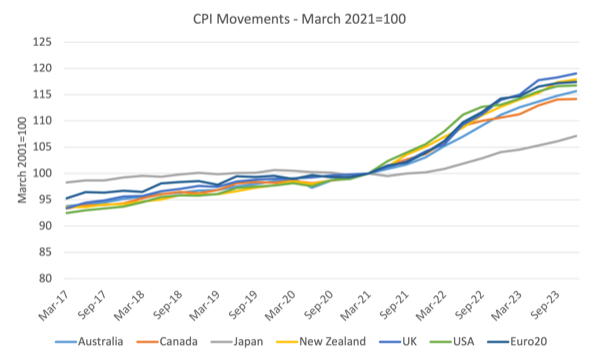
And the next graph shows the movements in the CPI (indexed to 100 at March 2021) for the same countries.
The sheep move together and Japan stands apart.
Back to the Australian data
The summary, seasonally-adjusted Consumer Price Index results for the December-quarter 2023 are as follows:
- The All Groups CPI rose by 0.6 per cent for the quarter (down from 1.2 last quarter).
- The All Groups CPI rose by 4.1 per cent over the 12 months (a decline from 5.4 per cent last quarter).
- The most significant price rises this quarter were Tobacco (+7.0%), New dwelling purchase by owner-occupiers (+1.5%), Domestic holiday travel and accommodation (+3.9%) and Medical and hospital services (+1.2%).
- The Trimmed mean series rose by 0.8 per cent for the quarter (down from 1.2) and 4.2 per cent over the previous year (down from 5.2 per cent).
- The Weighted median series rose by 0.9 per cent (down from 1.3) for the quarter and 4.4 per cent over the previous year (down from 5.2 per cent).
The ABS Media Release notes that:
The CPI rose 0.6 per cent in the December quarter, lower than the 1.2 per cent rise in the September 2023 quarter. This was the smallest quarterly rise since the March 2021 quarter …
While prices continued to rise for most goods and services, annual CPI inflation has fallen from a peak of 7.8 per cent in December 2022, to 4.1 per cent in December 2023.
Short assessment:
1. The inflation rate continues to fall as the supply factors that drove its rise abate.
2. Tobacco price rises which were significant in the overall result are the result of government policy decisions as are the medical and hospital service increases rather than any ‘market’ pressure from demand.
Trends in inflation
The headline inflation rate increased by 0.6 per cent in the December-quarter 2023 (down from 1.2)
Over the 12 months to December the inflation rate was 4.1 per cent (down from 5.4).
The peak was in the December-quarter 2022 when the inflation rate high 7.8 per cent.
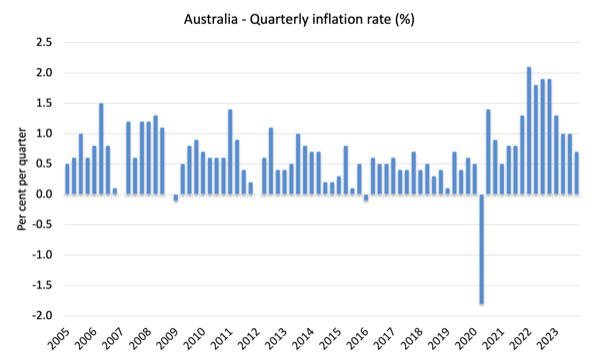
The following graph shows the quarterly inflation rate since the December-quarter 2005.
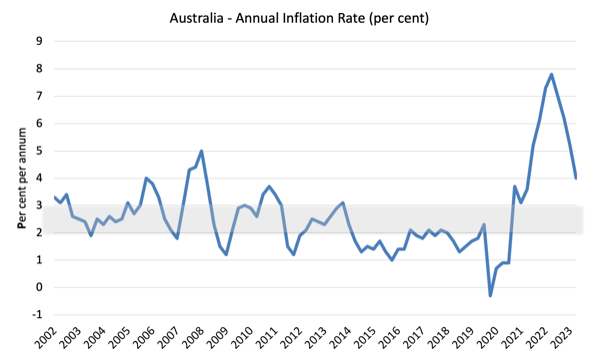
The next graph shows the annual headline inflation rate since the first-quarter 2002. The shaded area is the RBA’s so-called targetting range (but read below for an interpretation).
What is driving inflation in Australia?
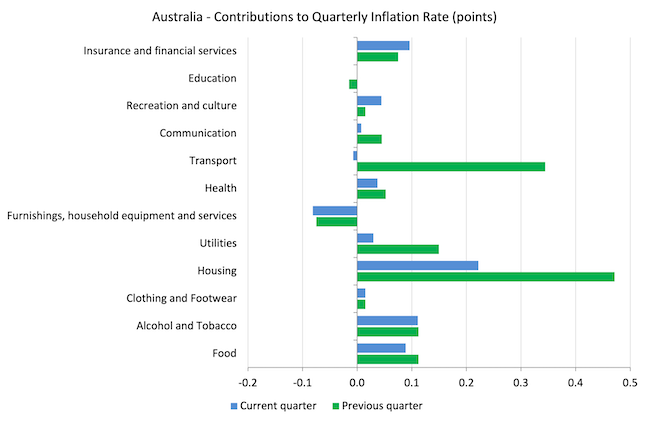
The following bar chart compares the contributions to the quarterly change in the CPI for the December-quarter 2023 (blue bars) compared to the September-quarter 2023 (green bars).
Note that Utilities is a sub-group of Housing and are significantly impacted by government administrative decisions, which allow the privatised companies to push up prices each year, usually well in excess of CPI movements.
One of the main drivers – housing – arises from the supply shortage where the years of neglect by governments in supplying adequate housing for low-income families is now coming home to roost.
However, that contribution fell significantly in the last quarter relative to the September-quarter 2023.
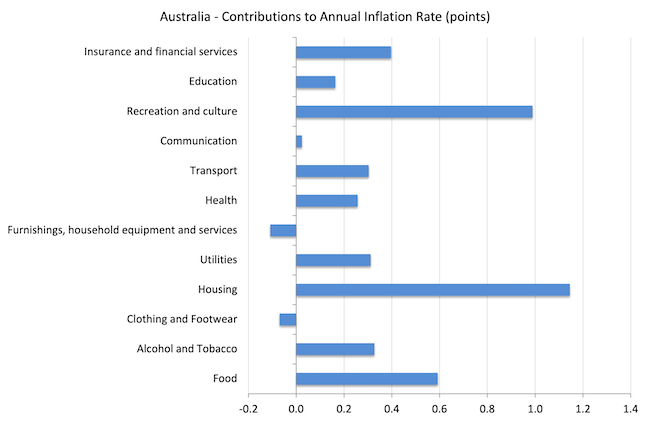
The next graph shows the contributions in points to the annual inflation rate by the various components.
The Recreation and culture components reflects the boom in international travel following the Covid restrictions easing.
Inflation and Expected Inflation
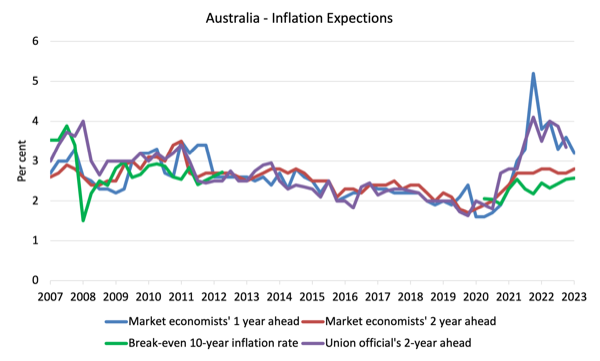
The following graph shows four measures of expected inflation produced by the RBA from the December-quarter 2005 to the December-quarter 2023.
The four measures are:
1. Market economists’ inflation expectations – 1-year ahead.
2. Market economists’ inflation expectations – 2-year ahead – so what they think inflation will be in 2 years time.
3. Break-even 10-year inflation rate – The average annual inflation rate implied by the difference between 10-year nominal bond yield and 10-year inflation indexed bond yield. This is a measure of the market sentiment to inflation risk. This is considered the most reliable indicator.
4. Union officials’ inflation expectations – 2-year ahead.
Notwithstanding the systematic errors in the forecasts, the price expectations (as measured by these series) are now falling or relatively stable.
In the case of the Market economists’ inflation expectations – 2-year ahead and the Break-even 10-year inflation rate, the expectations remain well within the RBA’s inflation targetting range (2-3 per cent) and show no signs of accelerating.
So all the talk now is that inflation is not falling fast enough – and that claim is accompanied by claims that the longer it remains above the inflation targetting range, the more likely it is that a wage-price spiral and/or accelerating (unanchored) expectations will drive the rate up for longer.
Neither claim can be remotely justified given the data.
Implications for monetary policy
What does this all mean for monetary policy?
Reflect on the information under the Japan heading first as to whether monetary policy is effective in achieving its stated aims.
The Consumer Price Index (CPI) is designed to reflect a broad basket of goods and services (the ‘regimen’) which are representative of the cost of living. You can learn more about the CPI regimen HERE.
The RBA’s formal inflation targeting rule aims to keep annual inflation rate (measured by the consumer price index) between 2 and 3 per cent over the medium term.
However, the RBA uses a range of measures to ascertain whether they believe there are persistent inflation threats.
Please read my blog post – Australian inflation trending down – lower oil prices and subdued economy – for a detailed discussion about the use of the headline rate of inflation and other analytical inflation measures.
The RBA does not rely on the ‘headline’ inflation rate. Instead, they use two measures of underlying inflation which attempt to net out the most volatile price movements.
The concept of underlying inflation is an attempt to separate the trend (“the persistent component of inflation) from the short-term fluctuations in prices. The main source of short-term ‘noise’ comes from “fluctuations in commodity markets and agricultural conditions, policy changes, or seasonal or infrequent price resetting”.
The RBA uses several different measures of underlying inflation which are generally categorised as ‘exclusion-based measures’ and ‘trimmed-mean measures’.
So, you can exclude “a particular set of volatile items – namely fruit, vegetables and automotive fuel” to get a better picture of the “persistent inflation pressures in the economy”. The main weaknesses with this method is that there can be “large temporary movements in components of the CPI that are not excluded” and volatile components can still be trending up (as in energy prices) or down.
The alternative trimmed-mean measures are popular among central bankers.
The authors say:
The trimmed-mean rate of inflation is defined as the average rate of inflation after “trimming” away a certain percentage of the distribution of price changes at both ends of that distribution. These measures are calculated by ordering the seasonally adjusted price changes for all CPI components in any period from lowest to highest, trimming away those that lie at the two outer edges of the distribution of price changes for that period, and then calculating an average inflation rate from the remaining set of price changes.
So you get some measure of central tendency not by exclusion but by giving lower weighting to volatile elements. Two trimmed measures are used by the RBA: (a) “the 15 per cent trimmed mean (which trims away the 15 per cent of items with both the smallest and largest price changes)”; and (b) “the weighted median (which is the price change at the 50th percentile by weight of the distribution of price changes)”.
So what has been happening with these different measures?
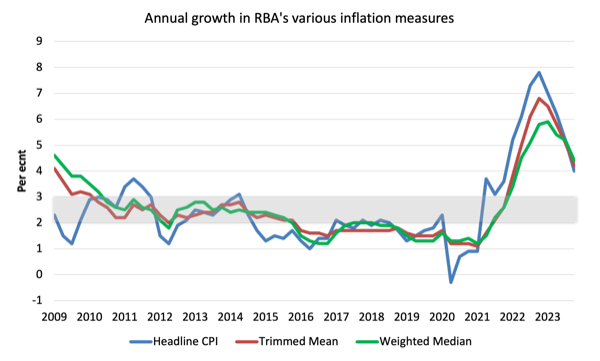
The following graph shows the three main inflation series published by the ABS since the December-quarter 2009 – the annual percentage change in the All items CPI (blue line); the annual changes in the weighted median (green line) and the trimmed mean (red line).
The RBAs inflation targetting band is 2 to 3 per cent (shaded area). The data is seasonally-adjusted.
The three measures are in annual terms:
1. CPI measure of inflation rose by 4.1 per cent (down from 5.2 per cent last quarter). For the quarter it rose by 0.6 points (down from 1.2)
2. The Trimmed Mean rose 4.2 per cent (down from 5.2 per cent last quarter). For the quarter it rose 0.8 points (down from 1.2).
3. The Weighted Median rose 4.4 per cent (down from 5.2 per cent last quarter). For the quarter it rose by 0.9 points (down from 1.3 point).
How to we assess these results?
1. The RBA’s preferred measures remain outside the targetting range and they have been using that fact to justify their rate hikes since May 2022 even though the factors that have been driving the inflation until late 2022 were not sensitive to the interest rate increases.
2. They also claimed the NAIRU was 4.25 per cent and with unemployment stable at around 3.9 per cent, they considered that justified further rate rises. However, if inflation is falling consistently with a stable unemployment rate then the NAIRU must be below the current rate of 3.9 per cent.
3. There is no evidence that inflationary expectations are accelerating – quite the opposite and that has been the case for some months now.
4. There is no significant wages pressure.
5. The other major contributors to the current situation are also not sensitive to interest rate rises.
6. Inflation is falling rapidly.
7. There is no justification for any further rate rises, especially given the slowdown in retail sales noted above.
Conclusion
The latest CPI data showed that inflation is falling rapidly in Australia in line with trends around the globe.
This was always a transitory, supply-side inflation, which meant that demand-side measures (interest rate hikes) were totally inappropriate.
That is enough for today!
(c) Copyright 2024 William Mitchell. All Rights Reserved
This Post Has 0 Comments