Over the last several years, I have been indicating that I think we are in…
US labour market defies the Federal Reserve and continues to improve
Last Friday (April 7, 2023), the US Bureau of Labor Statistics (BLS) released their latest labour market data – Employment Situation Summary – March 2023 – which revealed continuing employment growth and rising participation with unemployment falling modestly. A good confluence of events. We have been looking for a turning point in the US labour market after several months of interest rate increases. But it hasn’t come yet. Indeed, it is going in the opposite direction to that envisaged by the Federal Reserve ‘model’, upon which they justify their interest rate decisions. Guess which is wrong? Most of the aggregates are steady and in terms of the pre-pandemic period, March’s net employment change was still relatively strong. Real wages continued to decline in the face of a decelerating inflation rate. Overall, the US labour market is steady and doesn’t appear to be contracting in the face of the Federal Reserve interest rate hikes.
Overview for March 2023 (seasonally adjusted):
- Payroll employment increased by 236,000 – second month the increase has declined.
- Total labour force survey employment rose by 577 thousand net (0.36 per cent).
- The labour force rose by 480 thousand net (0.29 per cent).
- The participation rate rose by 0.1 point to 62.6 per cent.
- Total measured unemployment fell by 97 thousand to 5,839 thousand.
- The official unemployment rate rose 0.1 point to 3.6 per cent.
- The broad labour underutilisation measure (U6) fell by 0.1 point to 6.7 per cent.
- The employment-population ratio rose 0.2 points to 60.4 per cent (still well below the May 2020 peak of 61.2).
For those who are confused about the difference between the payroll (establishment) data and the household survey data you should read this blog post – US labour market is in a deplorable state – where I explain the differences in detail.
Some months the difference is small, while other months, the difference is larger.
Payroll employment trends
The BLS noted that:
Total nonfarm payroll employment increased by 236,000 in March, compared with the average monthly gain of 334,000 over the prior 6 months. In March, employment continued to trend up in leisure and hospitality, government, professional and business services, and health care …
Leisure and hospitality added 72,000 jobs in March, lower than the average monthly gain of 95,000 over the prior 6 months … Employment in leisure and hospitality is below its pre-pandemic February 2020 level by 368,000, or 2.2 percent.
Government employment increased by 47,000 in March, the same as the average monthly gain over the prior 6 months. Overall, employment in government is below its February 2020 level by 314,000, or 1.4 percent.
Employment in professional and business services continued to trend up in March (+39,000), in line with the average monthly growth over the prior 6 months (+34,000) …
Over the month, health care added 34,000 jobs, lower than the average monthly gain of 54,000 over the prior 6 months …
Employment in social assistance continued to trend up in March (+17,000), in line with the average monthly growth over the prior 6 months (+22,000).
In March, employment in transportation and warehousing changed little (+10,000) … Employment in transportation and warehousing has shown little net change in recent months.
Employment in retail trade changed little in March (-15,000) … Retail trade employment is little changed on net over the year.
Employment showed little change over the month in other major industries …
In summary, no sign of an impending recession.
The first graph shows the monthly change in payroll employment (in thousands, expressed as a 3-month moving average to take out the monthly noise). The red lines are the annual averages. Observations between January 2020 and January 2020 were excluded as outliers.
Some sectors, however, have still not regained the employment they lost in 2020-21.

The next graph shows the same data in a different way – in this case the graph shows the average net monthly change in payroll employment (actual) for the calendar years from 2005 to 2023.
The red marker on the column is the current month’s result.
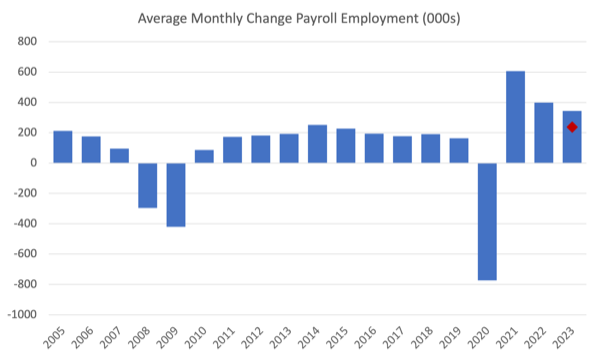
Average monthly change – 2019-2023 (000s)
| Year | Average Monthly Employment Change (000s) |
| 2019 | 163 |
| 2020 | -774 |
| 2021 | 606 |
| 2022 | 399 |
| 2023 (so far) | 345 |
Labour Force Survey data – employment and participation rises and unemployment falls
The seasonally-adjusted data for March 2023 reveals:
1. Total labour force survey employment rose by 577 thousand net (0.36 per cent) – strengthening.
2. The labour force rose by 480 thousand net (0.29 per cent).
3.The participation rate rose by 0.1 point to 62.6 per cent.
4. As a result (in accounting terms), total measured unemployment fell by 97 thousand to 5,839 thousand and the official unemployment rate fell by 0.1 point to 3.5 per cent.
After the ‘boom’ in January, the last two months have seen the aggregates fall back to more normal settings.
There is no sign of recession so far.
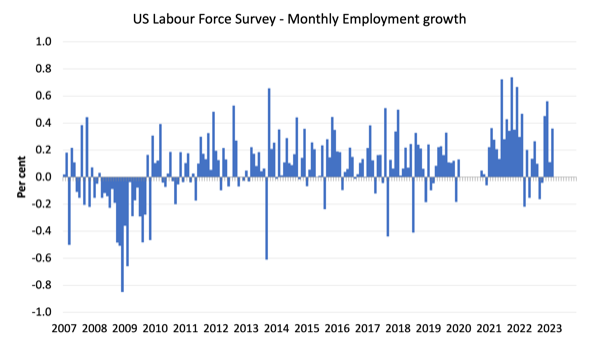
The following graph shows the monthly employment growth since January 2008 and excludes the extreme observations (outliers) between May 2020 and January 2020, which distort the current period relative to the pre-pandemic period.
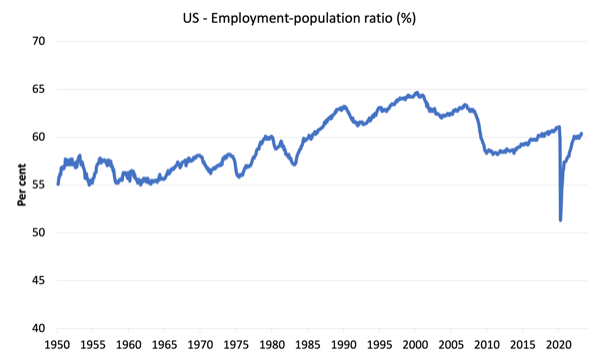
The Employment-Population ratio is a good measure of the strength of the labour market because the movements are relatively unambiguous because the denominator population is not particularly sensitive to the cycle (unlike the labour force).
The following graph shows the US Employment-Population from January 1950 to March 2023.
In March 2023, the ratio was rose 0.2 points to 60.4 per cent. A sign of a strengthening labour market.
The peak level in May 2020 before the pandemic was 61.1 per cent.
Unemployment and underutilisation trends
The BLS note that:
Both the unemployment rate, at 3.5 percent, and the number of unemployed persons, at 5.8 million, changed little in March. These measures have shown little net movement since early 2022 …
The number of long-term unemployed (those jobless for 27 weeks or more) was little changed at 1.1 million in March. These individuals accounted for 18.9 percent of all unemployed persons …
The number of persons employed part time for economic reasons was essentially unchanged at 4.1 million in March. These individuals, who would have preferred full-time employment, were working part time because their hours had been reduced or they were unable to find full-time jobs …
So a fairly static picture.
Unemployment did fall in March because employment growth outstripped the rise in the labour force even with the rise in participation. That is a good sign.
The first graph shows the official unemployment rate since January 1994.
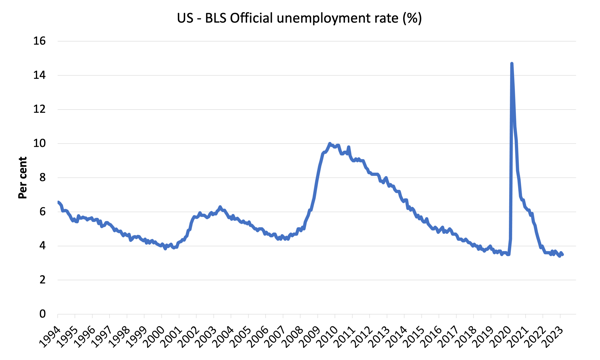
The official unemployment rate is a narrow measure of labour wastage, which means that a strict comparison with the 1960s, for example, in terms of how tight the labour market, has to take into account broader measures of labour underutilisation.
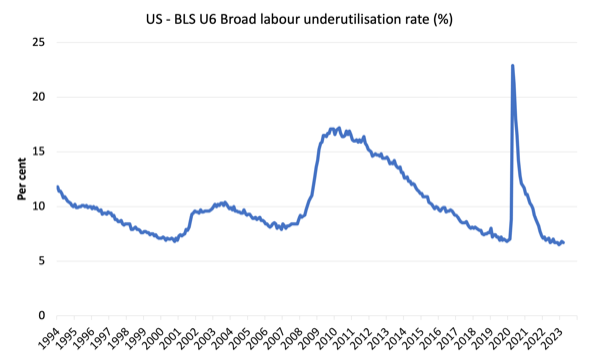
The next graph shows the BLS measure U6, which is defined as:
Total unemployed, plus all marginally attached workers plus total employed part time for economic reasons, as a percent of all civilian labor force plus all marginally attached workers.
It is thus the broadest quantitative measure of labour underutilisation that the BLS publish.
Pre-COVID, U6 was at 6.8 per cent (January 2019).
In March 2023 the U6 measure was 6.7 per cent, down by 0.1 point as a result of the fall in unemployment with other determining factors largely unchanged. It is still 0.2 points above the December 2022 level.
What about wages growth in the US?
The BLS reported that:
In March, average hourly earnings for all employees on private nonfarm payrolls rose by 9 cents, or 0.3 percent, to $33.18. Over the past 12 months, average hourly earnings have increased by 4.2 percent. In March, average hourly earnings of private-sector production and nonsupervisory employees rose by 9 cents, or 0.3 percent, to $28.50.
These are modest increases relative to the current inflation rate.
However, the latest – BLS Real Earnings Summary (published March 14, 2023) – tells us that:
Real average hourly earnings for all employees decreased 0.1 percent from January to February … This result stems from an increase of 0.2 percent in average hourly earnings combined with an increase of 0.4 percent in the Consumer Price Index for All Urban Consumers (CPI-U) …
Real average weekly earnings decreased 0.4 percent over the month due to the change in real average hourly earnings combined with a 0.3-percent decrease in the average workweek.
Real average hourly earnings decreased 1.3 percent, seasonally adjusted, from February 2022 to February 2023. The change in real average hourly earnings combined with a decrease of 0.6 percent in the average workweek resulted in a 1.9-percent decrease in real average weekly earnings over this period.
Overall, while the inflationary pressures are moderating, nominal wages growth is still lagging and the result is that real wages continue to fall.
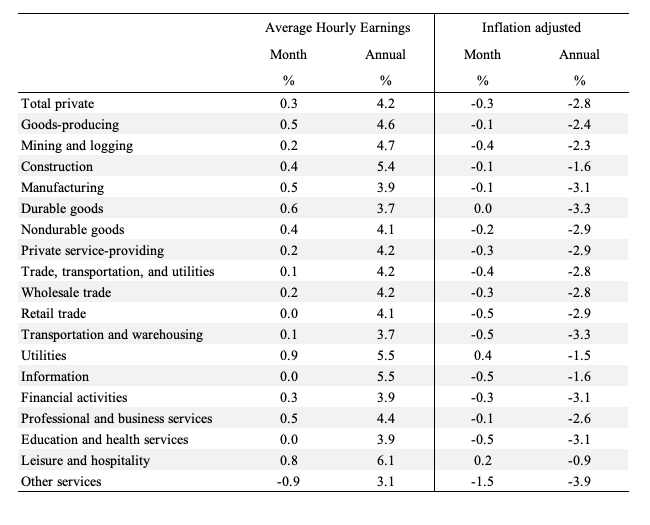
The following table shows the movements in nominal Average Hourly Earnings (AHE) by sector and the inflation-adjusted AHE by sector for March 2023 (note we are adjusting using the February CPI – the latest available).
There is considerable disparity across the sectors, with most still reporting falling real wage outcomes.
The following graph shows annual growth in real average hourly earnings from 2008 to March 2023.
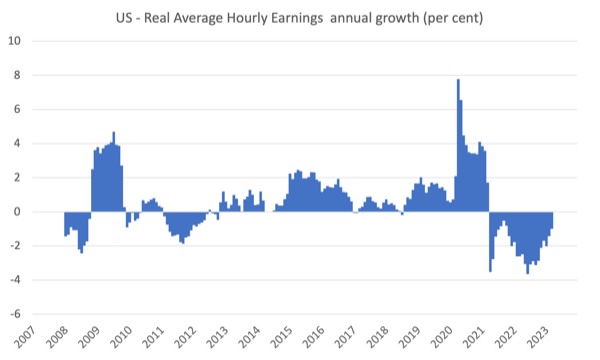
The real wage cuts are slowing.
The other indicator that tells us whether the labour market is turning in favour of workers is the quit rate.
The most recent BLS data – Job Openings and Labor Turnover Summary (released April 4, 2023) – shows that:
The number of job openings decreased to 9.9 million on the last business day of February … Over the month, the number of hires and total separations changed little at 6.2 million and 5.8 million, respectively. Within separations, quits (4.0 million) edged up, while layoffs and discharges (1.5 million) decreased …
In February, the number of quits edged up to 4.0 million (+146,000), and the rate was little changed at 2.6 percent.
If the US labour market was in retreat, then the quit rate would be falling.
Conclusion
In March 2023, the latest US labour market data revealed no signs of a looming recession.
March’s net employment change was still relatively strong compared to the pre-pandemic period.
Unemployment fell because even though the rising participation rate brought more people into the labour force, employment outstripped the supply-side increase.
Real wages continued to decline in the face of a decelerating inflation rate.
Overall, the US labour market is steady and doesn’t appear to be contracting in the face of the Federal Reserve interest rate hikes.
That is enough for today!
(c) Copyright 2023 William Mitchell. All Rights Reserved.
“Volcker revisited” or “how to save wall street from colapse, on the expenses of the 99%”.
As Gramsci would put it: “The old is dying and the new cannot be born. In this interregnum there arises a great diversity of morbid symptoms.”.
What else is dead is the “history is dead” trope.
Aside the suffering, we are witnessing history on the making.
So, post-modernism is dead too.
Maybe we can try to recover modernism, after all.