In the 1990s, a new industry was created in Australia. It produced nothing. But it…
Australian labour market – slight improvement in the situation despite rise in unemployment
The Australian Bureau of Statistics (ABS) released of the latest labour force data today (August 18, 2022) – Labour Force, Australia – for August 2022. WThe labour market improved slightly in August 2022 with employment and participation both increasing, but this was just reversing the joint decreases in July. The rise in the official unemployment rate from 3.4 to 3.5 per cent was due to the rise in the participation rate, which meant the modest employment growth could not absorb all the new entrants to the labour force. The underlying (‘What-if’) unemployment rate is closer to 6 per cent rather than the official rate of 3.5 per cent. There are still 1,320.4 thousand Australian workers without work in one way or another (officially unemployed or underemployed). The only reason the unemployment rate is so low is because the underlying population growth remains low after the border closures over the last two years. But that is changing as immigration increases. Overall, the situation improved a bit over August.
The summary ABS Labour Force (seasonally adjusted) estimates for August 2022 are:
- Employment increased by 33,500 (0.2 per cent) – full-time employment increased by 58,800 and part-time employment decreased by 25,300.
- Unemployment rose by 14,000 to 487,700 persons.
- The official unemployment rate rose 0.1 points to 3.5 per cent.
- The participation rate increased 0.2 points to 66.6 per cent.
- The employment-population ratio increased by 0.1 points to 64.3 per cent.
- Aggregate monthly hours increased by 14 million hours (0.8 per cent).
- Underemployment decreased by 0.1 point to 5.9 per cent (a fall of 7.2 thousand). Overall there are 832.7 thousand underemployed workers. The total labour underutilisation rate (unemployment plus underemployment) was constant at 9.4 per cent, with the rise in official unemployment being exactly offset by the fall in underemployment. There was a total of 1,320.4 thousand workers either unemployed or underemployed.
In its – Media Release – the ABS noted that:
The seasonally adjusted unemployment rate rose to 3.5 per cent in August 2022 …
With employment increasing by 33,000 people and unemployment by 14,000, the unemployment rate rose 0.1 percentage points to 3.5 per cent in August, returning to the same rate as June …
The participation rate also rose, to 66.6 per cent, consistent with the increase in employment and unemployment. The participation rate is now 0.2 percentage points below the record high in June and 0.7 percentage points higher than before the pandemic.
So on first blush it looks as if the labour market improved slightly in August despite the relatively modest employment growth.
Both participation and employment is up, which means that the rise in unemployment is due to more people seeking work.
The Employment-population ratio rose, which reinforces that point.
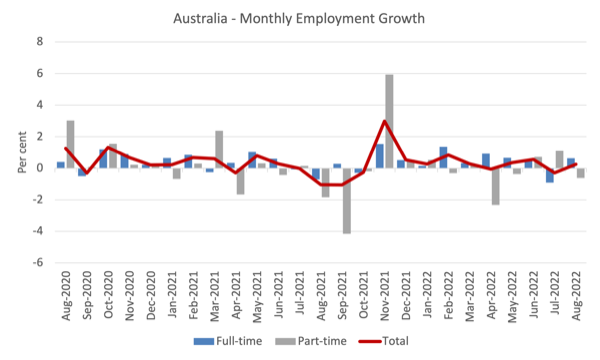
Employment increased by 33,500 (0.2 per cent) in August 2022
1. Full-time employment increased by 58,800 and part-time employment decreased by 25,300.
2. The Employment-population ratio increased by 0.1 points to 64.3 per cent.
3. Employment in Australia is 591 thousand (net) jobs (4.5 per cent) above the pre-pandemic level in February 2020.
The following graph shows the month by month growth in full-time (blue columns), part-time (grey columns) and total employment (green line) for the 24 months to August 2022 using seasonally adjusted data.
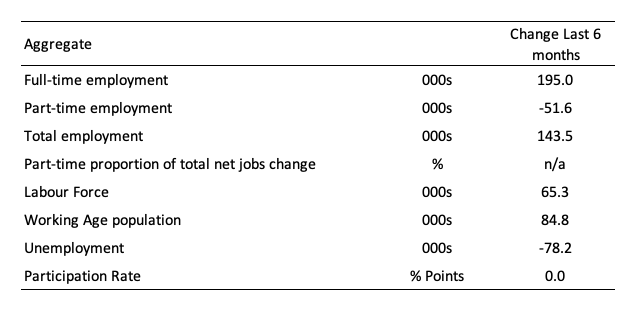
The following table provides an accounting summary of the labour market performance over the last six months to provide a longer perspective that cuts through the monthly variability and provides a better assessment of the trends.
Given the variation in the labour force estimates, it is sometimes useful to examine the Employment-to-Population ratio (%) because the underlying population estimates (denominator) are less cyclical and subject to variation than the labour force estimates. This is an alternative measure of the robustness of activity to the unemployment rate, which is sensitive to those labour force swings.
The following graph shows the Employment-to-Population ratio, since April 2008 (that is, since the GFC).
The ratio increased by 0.1 points to 64.3 per cent in August 2022 – showing an improving situation.

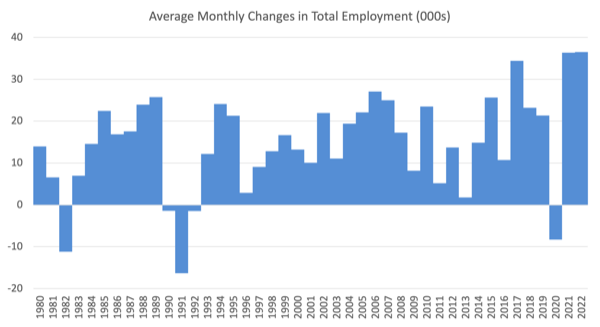
For perspective, the following graph shows the average monthly employment change for the calendar years from 1980 to 2022 (to date).
1. The average employment change over 2020 was -8.4 thousand which rose to 36.3 thousand in 2021 as the lockdowns eased.
3. So far in 2022, the average monthly change is 36.5 thousand.
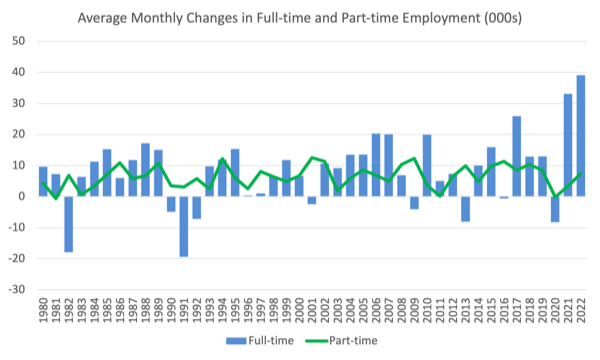
The following graph shows the average monthly changes in Full-time and Part-time employment (lower panel) in thousands since 1980.
The interesting result is that during recessions or slow-downs, it is full-time employment that takes the bulk of the adjustment. Even when full-time employment growth is negative, part-time employment usually continues to grow.
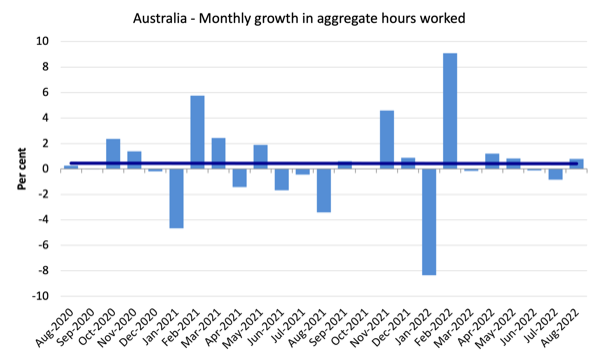
Hours worked increased by 14 million hours (0.8 per cent) in August 2022
A fairly modest increase commensurate with the moderate employment growth.
The following graph shows the monthly growth (in per cent) over the last 24 months.
The dark linear line is a simple regression trend of the monthly change (skewed by the couple of outlier result).
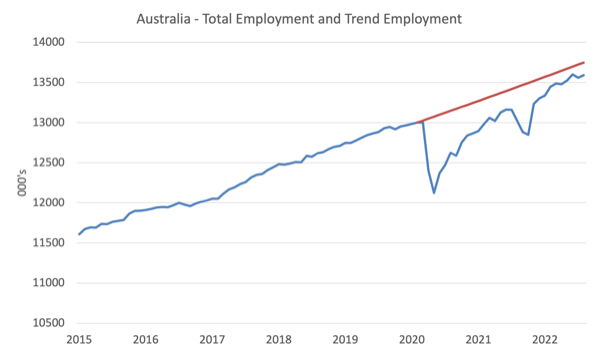
Actual and Trend Employment
The Australian labour market is now larger than it was in February 2020. But it is still some way from where it would have been if it had have continued to expand at the previous trend.
The following graph shows total employment (blue line) and what employment would have been if it had continued to grow according to the average growth rate between 2015 and April 2020.
In August 2022, the gap fell by 7.9 thousand to 155.6 thousand jobs as a result of the employment contraction.
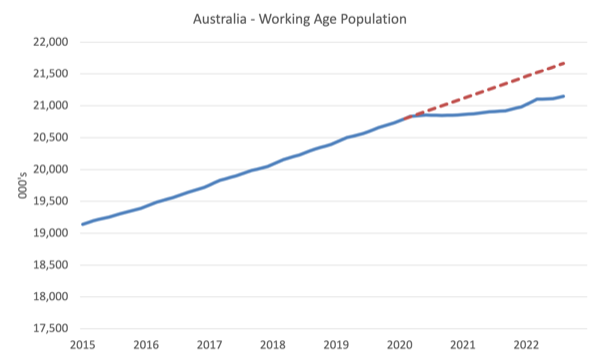
The Population Slowdown – the ‘What-if’ unemployment analysis
The following graph shows Australia’s working age population (Over 15 year olds) from January 2015 to August 2022. The dotted line is the projected growth had the pre-pandemic trend continued.
The difference between the lines is the decline in the working age population that followed the Covid restrictions on immigration.
The civilian population is 521.8 thousand less in August 2022 than it would have been had pre-Covid trends continued.
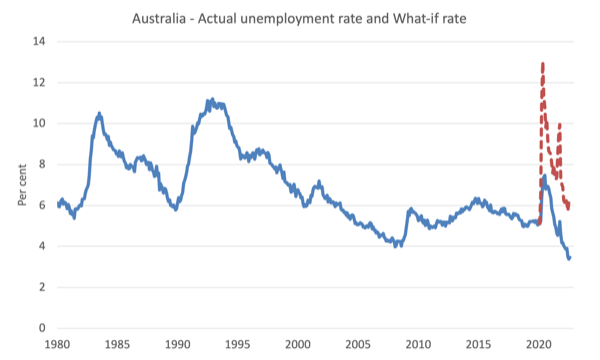
The following graph shows the evolution of the actual unemployment rate since January 1980 to August 2022 and the dotted line is the ‘What-if’ rate, which is calculated by assuming the most recent peak participation rate (recorded at August 2022 = 66.8 per cent), the extrapolated working age population (based on growth rate between 2015 and April 2020) and the actual employment since April 2020.
It shows what the unemployment rate would have been given the actual employment growth had the working age population trajectory followed the past trends.
In this blog post – External border closures in Australia reduced the unemployment rate by around 2.7 points (April 28, 2022), I provided detailed analysis of how I calculated the ‘What-if’ unemployment rate.
So instead of an unemployment rate of 3.5 per cent, the rate would have been 6 per cent in August 2022, given the employment performance since the pandemic.
This finding puts a rather different slant to what has been happening since the onset of the pandemic.
Unemployment rose by 14,000 to 487,700 persons in August 2022
Unemployment rose because the rise in employment (33.5 thousand) was less than the rise in the labour force (47.5 thousand), which was driven by the increase in the participation rate.
The rise in the working age population was steady (17.4 thousand) but more people within that population are now seeking work.
This signals an improving situation.
Also so bear in mind the ‘What-if’ analysis above and see the impact of the fall in participation below.
The following graph shows the national unemployment rate from April 1980 to August 2022. The longer time-series helps frame some perspective to what is happening at present.
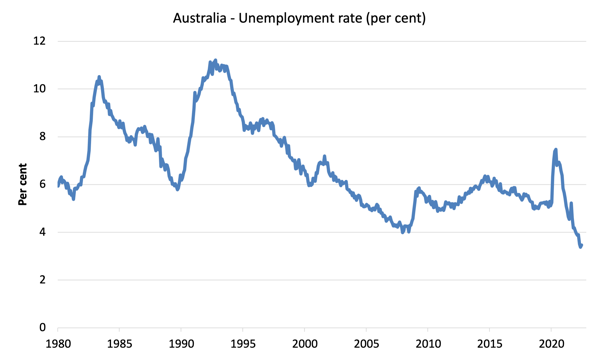
Broad labour underutilisation was constant at 9.4 per cent in August 2022
1. Underemployment decreased by 0.1 point to 5.9 per cent (a fall of 7.2 thousand).
2. Overall there are 832.7 thousand underemployed workers.
3. The total labour underutilisation rate (unemployment plus underemployment) was constant at 9.4 per cent.
4. There were a total of 1,320.4 thousand workers either unemployed or underemployed.
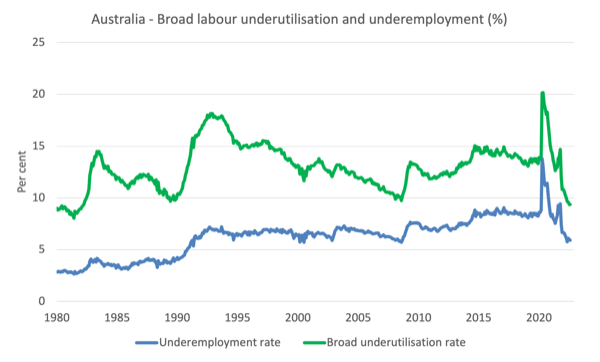
The following graph plots the seasonally-adjusted underemployment rate in Australia from April 1980 to the August 2022 (blue line) and the broad underutilisation rate over the same period (green line).
The difference between the two lines is the unemployment rate.
The three cyclical peaks correspond to the 1982, 1991 recessions and the more recent downturn.
The other difference between now and the two earlier cycles is that the recovery triggered by the fiscal stimulus in 2008-09 did not persist and as soon as the ‘fiscal surplus’ fetish kicked in in 2012, things went backwards very quickly.
The two earlier peaks were sharp but steadily declined. The last peak fell away on the back of the stimulus but turned again when the stimulus was withdrawn.
Teenage labour market deteriorated in August 2022
Both full- and part-time opportunities for teenagers were lost in August.
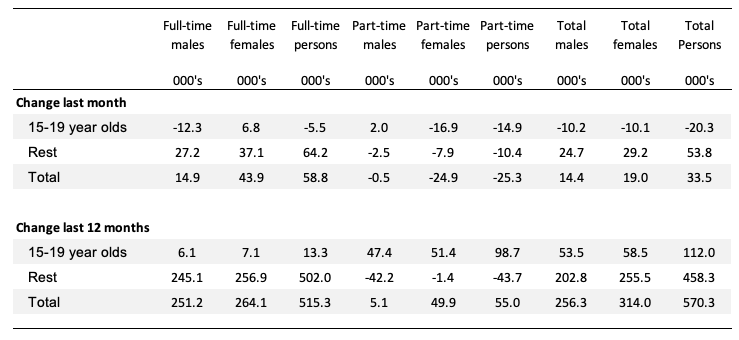
The following Table shows the distribution of net employment creation in the last month and the last 12 months by full-time/part-time status and age/gender category (15-19 year olds and the rest).
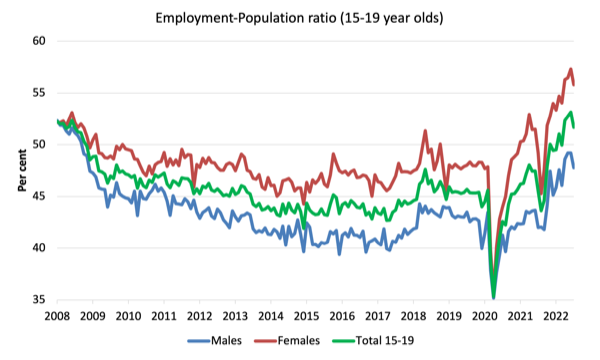
To put the teenage employment situation in a scale context (relative to their size in the population) the following graph shows the Employment-Population ratios for males, females and total 15-19 year olds since June 2008.
You can interpret this graph as depicting the loss of employment relative to the underlying population of each cohort.
1. The male ratio has fallen by 4.6 percentage points since April 2008. It fell by 1.4 points over the month. It is now 4.3 points above its level in March 2020.
2. The female ratio is 3.7 percentage points above the April 2008 level. It fell by 1.5 points over the month. It is now 7.9 points above its level in March 2020.
3. The overall teenage employment-population ratio has fallen by 0.6 percentage points since April 2008. It fell by 1.5 points over the month. It is now 6.1 points above its level in March 2020.
4. So female teenagers are doing better in relative terms than male teenagers.
Conclusion
My standard monthly warning: we always have to be careful interpreting month to month movements given the way the Labour Force Survey is constructed and implemented.
My overall assessment is:
1. The labour market improved slightly in August 2022 with employment and participation both increasing, but this was just reversing the joint decreases in July.
2. The rise in the official unemployment rate from 3.4 to 3.5 per cent was due to the rise in the participation rate, which meant the modest employment growth could not absorb all the new entrants to the labour force.
3. The underlying (‘What-if’) unemployment rate is closer to 6 per cent rather than the official rate of 3.5 per cent.
4. There are still 1,320.4 thousand Australian workers without work in one way or another (officially unemployed or underemployed). The only reason the unemployment rate is so low is because the underlying population growth remains low after the border closures over the last two years. But that is changing as immigration increases.
That is enough for today!
(c) Copyright 2022 William Mitchell. All Rights Reserved.
This Post Has 0 Comments