On May 19, 2026, Oxfam Australia's media release - Australian billionaires’ wealth grows by $50,000…
CEO pay binge in Australia continues while workers’ wages growth remains flat
The headlines in the last week summarised the inherent inadequacy of capitalism for most of us who depend on real wages growth to enhance our material standard of living in economies that are growing. The latest report from the Australian Council of Superannuation Investors released on Thursday (July 17, 2018) – CEO Pay in ASX200 Companies: 2017 – shows how unfair and unsustainable the income distribution is in Australia. Australian CEOs were fully committed to the ‘greed is good’ binge leading up to the GFC along with their peers across the globe. The GFC interrupted that ‘party’, albeit temporarily. As the emergency environment that surrounded the business community during the GFC abated as a result of extensive government support (bailouts, stimulus packages, etc), the managerial class in Australia has returned attention to its on-going ‘national income grab’. The Report shows that in 2017, CEO pay reached its highest level in 17 years and the managerial class enjoyed real growth in pay at a time when the average worker is enduring either flat to negative growth in pay. Further, overall economic growth in Australia is being driven by increased non-government indebtedness as real wages growth (what there is of it) lags well behind productivity growth. And, at the same time, the Federal Government is intent on pursuing an austerity policy stance. All these trends are similar to the dynamics we experienced in the lead-up to the GFC. They are unsustainable. A major shift in income distribution away from capital towards workers has to occur before a sustainable future is achieved.
The context
The following two graphs provide the context for understanding why the latest CEO data is so problematic.
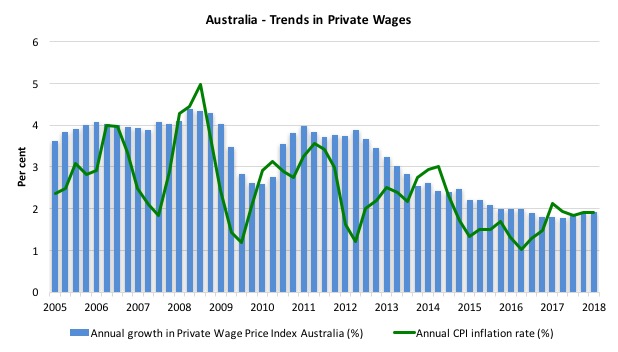
The first graph shows the annual growth in nominal wages for private sector workers (blue bars) and the annual growth in inflation from the March-quarter 2005 to the March-quarter 2018.
The bars above the green line indicate real wages growth and below the opposite.
The graph make it very clear that wages growth has been very subdued over the last several years, with real wage gains difficult to achieve.
Wages growth is now at record low levels and as the graph shows, real wages started falling in 2017, and in recent quarters have just kept pace with inflation.
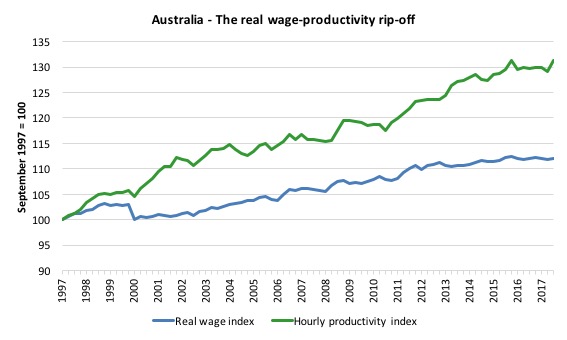
The next graph shows the total hourly rates of pay in the private sector in real terms (deflated with the CPI) (blue line) from the inception of the Wage Price Index (September-quarter 1997) and the real GDP per hour worked (from the national accounts) (green line) to the March-quarter 2018.
Over that time, the real hourly wage index has grown by just 12 per cent, while the hourly productivity index has grown by 31 per cent.
If I started the index in the early 1980s, when the gap between the two really started to open up, the productivity index would stand at around 180 and the real wage index at around 115. Data discontinuities however prevent a concise graph of this type being provided at this stage.
This gap represents a massive redistribution of national income to profits and away from wage-earners. For more analysis of why the gap represents a shift in national income shares and why it matters, please read the blog – Australia – stagnant wages growth continues.
Where does the real income that the workers lose by being unable to gain real wages growth in line with productivity growth go?
Answer: Almost mostly to profits.
The mainstream economists (and the business lobby) then claim that this redistribution will stimulate investment and then employment.
At the onset of the GFC (December-quarter 2007), the Investment ratio (percentage of private investment in productive capital to GDP) was 23.8 per cent.
It peaked at 24.8 per cent in the June-quarter 2013.
But in recent quarters as the gap between real wages growth and productivity growth has widened, the Investment ratio has fallen and in the March-quarter 2018 (most recent data) it stood at 19.8 per cent.
Some of the redistributed national income has gone into paying the massive and obscene executive salaries that we are discussing in this blog post.
Some will be retained by firms and invested in financial markets fuelling the speculative bubbles around the world.
By any standards there is a rip-off going on where Australian workers are generating productivity growth but not receiving an appropriate share.
CEO pay binge carries on in 2017
The news reports that came out when the data was released were clear.
For example, the ABC News Headline (July 17, 2018) – CEO pay deals surge to highest level in 17 years thanks to ‘persistent and increasing’ bonuses, report shows.
The opening paragraph captured the tension that is now rising in Australia:
Chief executive pay hit record highs over the past year as wages growth for workers continues to flatline and trust in big business ebbs amid fallout from the banking royal commission …
The startling results come against the backdrop of the banking royal commission which has revealed unlawful, unethical and possible criminal activity in some parts of the banking and insurance sectors.
This sort of trend is, of course, global as the top-end-of-town feast on the growth spurt while workers are struggling to maintain the real value of their wages.
A more recent analysis (August 3, 2018) – CEO pay can be linked to slow wage growth, but does that make it theft? – concludes that the extraordinary pay results for Australia’s CEOs amounts to theft because the higher CEO pay has come on the back of higher profits which “in turn is related to the low growth in Australian average wages”.
Meanwhile the banks and related financial service companies are being investigated by the Royal Commission, which has already revealed a breathtaking litany of corruption, deception, criminal behaviour and unethical conduct by these institutions.
The evidence already before the Commission shows that these institutions chase profits without regard to workers, customers and, probity.
Major legal limits on this sector is long over due.
The latest annual CEO pay survey for 2017 covers executive pay for the 200 listed companies on the Australian Stock Exchange.
The survey shows that in 2001 (when the first survey was taken) the ratio of average CEO pay to total earnings by workers was 76.2 to 1.
In 2017, this ratio has risen to 89.7 to 1, although it peaked at 123 to 1 in 2007 just before the crisis.
That rise in the ratio is another way of understanding the widening gap between productivity growth and real wages growth, which we demonstrated in the graph above.
The widening gap manifests as an increasing profit share in national income and a decreasing wage share.
This redistribution of national income towards capital has been ongoing for the last three decades or so in most countries and is a characteristic of the neo-liberal era.
For workers, the problem is that they rely on real wages growth to fund consumption growth and without it they borrow or the economy goes into recession. The former is what happened around the world in the lead up to the crisis (and caused the crisis).
The latter is more or less what is happening again now as growth has returned.
One of the essential changes that needs to happen to ensure that another bout of financial instability doesn’t hit soon is that real wages have to grow in proportion with productivity growth – exactly the reverse of what is happening now.
That will require a fundamental revision of the way executive pay is determined and significantly reduced payout outcomes for the bosses.
The latest Australian data from the Australian Council of Superannuation Investors (ACSI), the body that “provides independent research and advice to assist its member superannuation funds to manage environmental, social and corporate governance (ESG) investment risk”, shows that:
… CEO pay is on the rise, with average realised pay outcomes reaching their highest level in four years. This uplift correlates with strong equity market performance.
Across the sample, bonus persistence was strikingly apparent – most ASX100 CEOs received a bonus at a significant proportion of their maximum entitlement – and its quantum increased …
Close to 1 in 3 ASX100 CEOs received 80 per cent (or more) of their maximum bonus during the period …
Realised pay for both ASX100 and ASX101- 200 CEOs was the highest in the four years that we have reported this data
In FY17, average realised pay was again higher than the average pay disclosed for ASX100 CEOs …
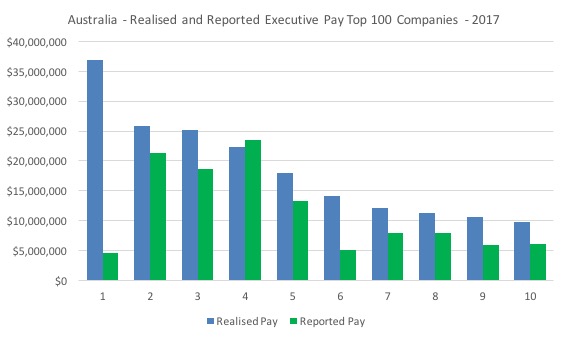
The following graph shows the gap between the reported pay and realised pay for the top 10 CEO earners.
The ACSI had argued in an earlier Report that:
These figures suggest that the existing requirements for reporting executive pay may significantly understate the rewards received in a given year. Statutory reporting is, perhaps, disclosing only the tip of the iceberg in terms of the wealth accruing to senior executives …
It is clear that there is a significant variation in what the companies report in their Annual Reports and the extra payments associated with cash payments on top that are not reported.
In its current report, ACSI say that:
The increase in pay levels for CEOs occurs at a time when public trust in business is at a low ebb, and wages growth in the broader economy can best be described as anaemic. Against this background, decisions to significantly increase bonuses appear not only tone-deaf but also make me wonder whether boards have lost sight of the link between community and investor expectations, and a company’s social licence to operate.
This may have the consequence of further damaging community perceptions of business. We see a real prospect of regulatory intervention if the current trend continues.
While CEO pay increases have not been closely linked to company performance in the past, the latest data shows that profits (and share prices) have grown strongly in the last year.
Clearly, the suppression of wages for workers has been instrumental in CEOs being able to capture most of the growth in their company fortunes.
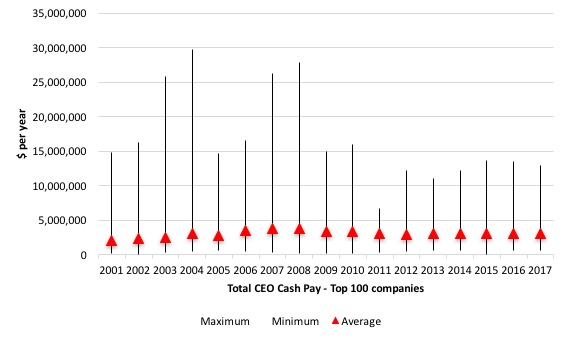
The next graph shows the average total CEO Cash Pay in the Top 100 companies (red triangles) and the maximum and minimum values for each year (indicated by the vertical lines).
The ACSI define the total cash pay as “fixed pay, cash bonuses and accrual of entitlements”, so more or less what an average worker might receive each year (the bonuses if they are lucky).
There is considerable disparity within the ranks of the CEOs (from max to min). There are some sensationally large salaries and some rather modest ones (in relative terms).
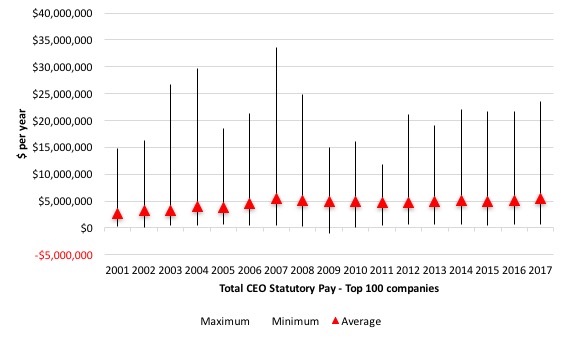
The next graph shows the average total CEO Statutory Pay in the Top 100 companies (red triangles) and the maximum and minimum values for each year (see accompanying table for actual dollar values).
The ACSI define statutory pay as “the total remuneration disclosed for a CEO in a company’s remuneration report, as required by Australian law. It therefore includes the value of share-based payments expensed under accounting standards”.
Don’t be fooled by the different scale of the axes in each graph – the statutory pay is a huge step up on the total cash pay although clearly well below the ultimate realised earnings (as detailed in the first graph).
Comparisons with other workers
But all of that analysis doesn’t mean much unless there is some context. We have already seen that wages growth for workers has been very flat in recent years.
This section analyses the relative movements in wages for workers and CEOs.
The next graph shows the Ratio of CEO Statutory Pay to Total Average Weekly Earnings (blue line) and Total Average Weekly Full-time Earnings (red line) from 2001 to 2017.
The ratio for the former started at 76.2 in 2001, peaked at 123.1 in 2007 at the height of the ‘greed is good’ frenzy and is now back to 88.7 and is on the rise again.
The ratio for the latter started at 58.6 in 2001, peaked at 93.7 in 2007 and is now back to 65.7. It is also rising again.
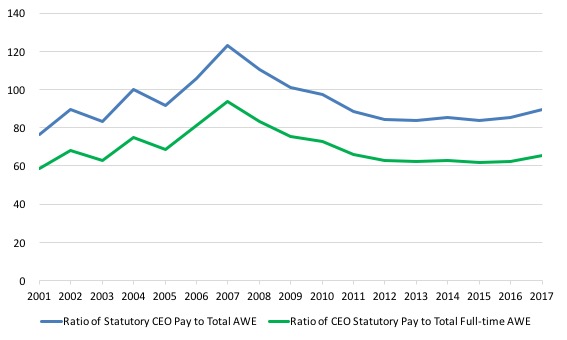
These differentials are always justified by the conservatives and the business lobby as being essential to attract top quality executives. But then we know that company performance is not closely linked at times to the pay that the CEOs get, which puts a hole in that argument.
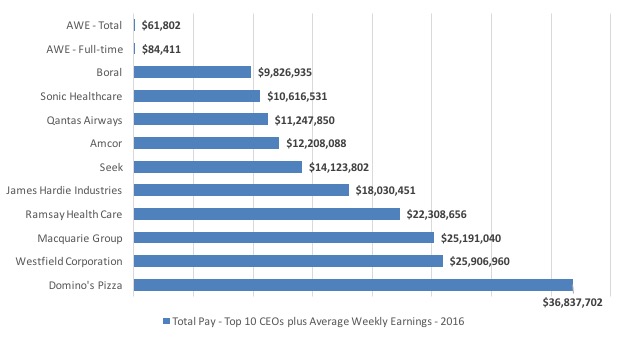
The next graph shows the salaries of the Top 10 CEOs in Australia compared to Average Weekly Earnings (Full-time) and Average Weekly Earnings (Total) for 2017.
The question is what does a person who runs a pizza franchising operation ($A36,837,702) or a shopping centre empire ($A25,906,960) contribute to society that is worth more than $A26 million a year relative to what an average workers contributes who only gets $A62,802 per year?
The question is unanswerable using any logic that is based on societal well-being, fairness, or decency much less productivity.
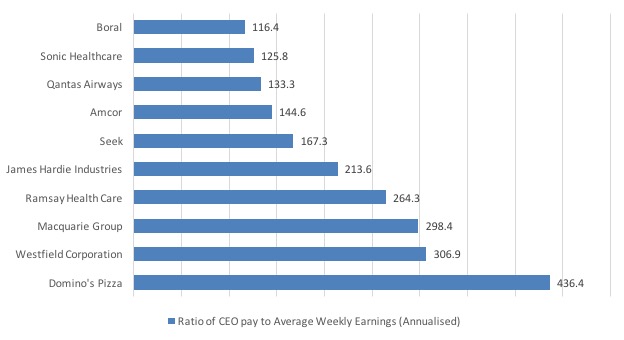
The next graph shows the pay ratios of the Top 10 CEOs in Australia compared to Average Weekly Earnings (Total and Full-time).
I have reported elsewhere that the growth in the Wage Price Index in Australia is at record lows (for several successive quarters).
Please read my blog – Australia – real wages growth zero and the rip-off of workers continues – for more discussion on this point.
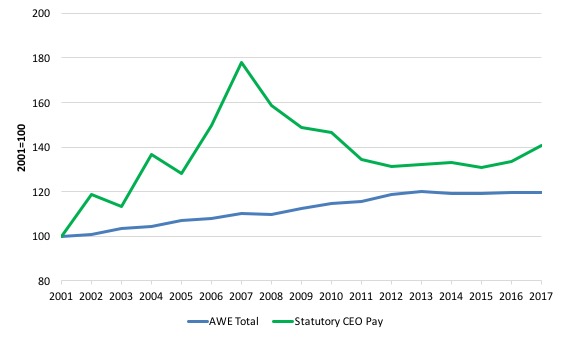
The following graph shows the movement in Average Weekly Earnings (blue line) and Statutory CEO pay (green line) both indexed to 100 in 2001. The data is also deflated using the Consumer Price Index, so reflects real growth.
I also use Average Weekly Total Earnings (which provides some measure of the shift towards part-time work) and a better indicator of the central tendency in the labour market.
Real Average Weekly Earnings Total Earnings (annualised) have grown by just 19.6 per cent since 2001 (up to 2017), while Statutory CEO Pay in Australia has grown by 40.7 per cent over the same period.
Of course, the CEO real pay exploded in the financial market frenzy before the crisis and by 2007 their real pay had risen by 77 per cent since 2001, compared to the average worker’s real wage rise of 11.2 per cent over the same period.
Since 2012, CEO real pay has risen by 7.1 per cent compared to real AWE 0.9 percent.
Between 2016 and 2017, CEO real pay rose by 5.3 per cent while real AWE was flat.
The more recent period will see real earnings growth for average workers hovering around zero (if not negative) while CEO pay continues to growth in real terms.
Conclusion
There is a stream of research being published that demonstrates how fractured modern (financial) capitalism has become. In the post Second World War II period, the Cold War warriors in the West lampooned communism on the basis that the capitalist dream was spreading its rewards to the workers as well as to the owners of the capital.
The full employment consensus that emerged in that period, mediated by Social Democratic governments, achieved both productivity and real wage growth and more or less comprehensive Welfare States, which raised the material living standards of workers rapidly.
At least, in the developed world.
There was also a sense that the regulative environment and cultural overtones had kept the capitalist class in check in terms of their share of the pie.
Of course, there was also a sense that the exploitation of workers in poorer countries in Asia, Latin America, Africa and elsewhere was increasing to allow the West to satisfy the demands of more organised workers in the advanced nations for better living standards.
With the abandonment of the full employment consensus, variously, around the mid 1970s and beyond (depending on the nation), and the emergence of Monetarism and its micro-economic manifestation (privatisation, deregulation, etc), that lull in worker exploitation in the advanced nations came to an end.
Capital has found a way to co-opt the state to work in its favour more fully and abandon its role as a mediator in the class conflict, which up until then, following the end of the War, had helped workers improve working conditions, pay levels, and provided social wage benefits in the form of public education, public health, public transport and all rest of it.
It’s interesting that the Left have bought the myth that the state is no longer relevant or has the capacity to influence national economies in the face of globalisation and global financial flows.
But the state never went away. It is still as important as it ever was. It is just now, that it openly works in the interests of capital rather than acts as the mediator.
This ongoing CEO salary binge, even though it is clearly now often at the expense of their own companies well-being, is a sign that capitalism is once again getting ahead of itself.
We saw it at the end of the 19th century, which provoked the rise of trade unions and broad social movements designed to force elected governments to act more broadly in terms of the interests that it served.
These movements led to the Social Democratic era in the West. The lesson was that workers will only take so much and when their material living standards are so threatened, they retaliate and will not remain passive.
At some point, this neo-liberal era will be brought to an end by some similar type of worker reorganisation and uprising. I hope it comes within my own lifetime.
That is enough for today!
(c) Copyright 2018 William Mitchell. All Rights Reserved.
Bill, I don’t know how you assemble all this data. I couldn’t agree more with you. That the investment to gdp ratio has fallen is no surprise. It’s what’s to be expected. As the yearly income stream is diverted more and more to the wealthy and the powerful, the ability of working people to draw on the economic resources of the country is reduced. It becomes more an economy designed around the luxuries of the elites, and less about the wants and needs of the general population. A billionaire might have 5 luxury mansions, staffs, private planes, pilots, mechanic, grounds keepers. Many people in a servile or service role. The people aren’t permitted to work for themselves in a more productive way, such as building homes, cars, education, health care, for themselves. Here in US we have a housing shortage for economy homes, starter homes. And they’r not being built either. People can’t afford to buy them. Their lives are put at the disposal of the wealthy and the powerful, not for themselves.
It is interesting that executive pay began to fall after Labour took government in 2007 and stabilized and began to grow again after the Coalition took government in 2013.
May have also had something to do with the GFC.
Bill,
If data discontinuities prevent a precise graph of the real wage index and hour productivity, how do you know?
Can you go into the Key National Accounts data and graph “GDP per hour worked” and “Compensation of employees” divided by “hours worked”?
With all due respect to everyone, I don’t know how anyone who is possessed of the facts such as that of the above, can find the motivation to get up every morning and continue to grind in the rat wheel knowing who the ultimate beneficiaries are and faced with the prospect of being stuck in it for life.
Instead of trying to change the whole system politically by banging a hammer over the heads of all those whose wealth comes at the expense of workers, wouldn’t it be a better idea to come up with other alternatives and arrangements that do not rely on corporations so much? I mean we can’t exactly say we all have that much of an input when it comes to corporate governance – we let them write the contracts, we let them set the price, we rely on them for our super, we rely on them for our jobs.
How about less political agenda pushing and a bit more imagination utilizing things like surplus share arrangements which utilize government as a partner, and instead of trying to replace the whole system, if more of us start using a different system those who have reaped the benefits of our hard work so far will start realize we don’t need them as much as they think we do and will be forced to change.
For 300+ years we have tried to change the system to suit the worker and all history has proven is that the more we try to change it the more we seem to keep the status quo.
Dean,
“How about less political agenda pushing and a bit more imagination utilizing”
That’s what the JG is. A scheme that ensures we are not at the mercy of others savings desires or corporations spending decisions.
We have done pretty well over the last 300 years. Our government is our agent. Though it currently doesn’t behave as such, it is those in control not the system itself that is the issue.
We’ve moved from feudalism to more open and democratic societies. We’ve effectively pushed the monarchy out, the reality is, they are rather powerless.
Bill is right in pushing a correct understanding of monetary operations. It allows us to see what is possible. Achieving that possibility is a political process.
Should this been Average Annual Earnings (Full-time)?
$84,411 average annual compensation for full-time workers
$61,802 average annual compensation for all workers