Last week, I considered recent research published by the BIS - Bank of International Settlements…
Household debt is part of a broader problem – be informed
The head of the Australian Prudential Regulation Authority (APRA), which was created in 1998 as part of the sham to separate regulation from policy and pretend the Reserve Bank of Australia was independent, gave a speech in Sydney yesterday (November 21, 2017) – Housing – The importance of solid foundations. The reason the speech is important is because it demonstrates the disconnect in policy making and the failure of key policy makers and regulators to connect macroeconomic dots. Australia – like the rest of the world – needs politicians and officials who understand how the macroeconomic aggregates are connected. One cannot have a conversation about household debt without recognising that it is, in part, directly related to the fiscal position of the government and the nation’s external position. While the APRA boss is correct to highlight the precarious nature of household balance sheets given the record and increasing debt levels being borne by households who are experiencing a wages squeeze and a government intent on austerity cuts, he should be educating the public on the broader context. Then there would be more acceptance of expanding discretionary fiscal deficits and a wages policy designed to bring real wages growth back into line with productivity growth. If that was the case, much of the idiotic conversations – some masquerading as ‘research’ results would disappear.
The Speech was delivered to the so-called “Australian Securitisation Forum 2017”, which in itself is a problem. Banks should be prevented from ‘securitising’ its housing loans and taking them off their balance sheets.
A progressive reform process would certainly see banks being required by the regulators to hold all their assets and liabilities on their balance sheets so that the owners bore full responsibility for the decisions made by the organisation.
A more progressive reform would just nationalise banking and be done with it.
The message in the Speech was that the housing sector in Australia is now in a risky position due to the record levels of debt being carried by Australian households.
He talked about “heightened risk” arising from an “erosion in lending quality just at a time when standards should be going in the other direction”.
Just last week we learned that one of the big 4 banks in Australia:
… has sacked 20 bankers and disciplined another 32 over the selling of mortgages without accurate customer information and documentation … about 2,300 home loans sold since 2013 that were likely to contain inaccurate information.
For more details on that, see the ABC News story (November 16, 2017) – NAB sacks 20 bankers for selling 2,300 ‘liar’ home loans.
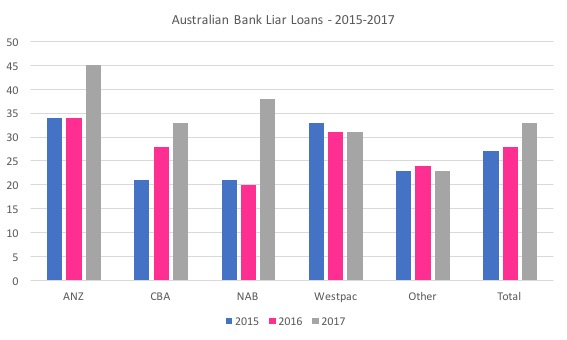
The following graph shows the evolution of these so-called “liar loans” by bank since 2015.
The first four banks (the “big 4”) account for more than 82 per cent of the total loans market in Australia.
Research from UBS showed that “up to a third of Australian mortgages … could be so-called ‘liar loan’, based on factually incorrect information”.
The most recent revelations point to the same problem that has plagued the greedy banking sector for years – “the loans were organised through the bank’s own staff and its Introducer Program … rewards businesses – accountants, solicitors, financial planners and real estate agents – with commissions for successful loan referrals”.
Attach a subsidy to some activity and watch the over production of that activity. Remember the butter mountains in Europe!
So APRA’s concern about the housing market is justified.
The Chairman said:
Household indebtedness is high: perhaps more importantly, the trajectory is clearly for it to rise further … This trend is underpinned by a sustained period of historically low interest rates, subdued income growth, and high house prices. Combined, they describe an environment in which lenders need to be vigilant to ensure their policies and practices are both prudent and responsible. In short, heightened risk requires heightened vigilance: certainly by APRA, but also – and preferably – by lenders (and borrowers) themselves.
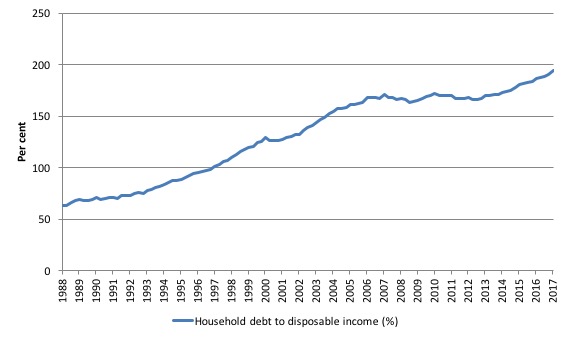
The latest RBA data – Household Finances – Selected Ratios – E2 – shows that the ratio of household debt to annualised household disposable income is now at record levels – each month a new record is established.
The following graph shows the ratio from 1988 (the beginning of the series) to the June-quarter 2017.
In June 1988, the ratio was 63.2 per cent. It peaked at 171 per cent in the June-quarter 2007, just before the GFC emerged.
It stabilised for a while as the fear of unemployment and the economic slowdown curbed credit growth for a while. But that didn’t last.
Over the last two years it has accelerated considerably and now stands at 193 per cent.
The position of Australian households, carrying record levels of debt, is made more precarious by the record low wages growth and the conduct of the private banks.
Please read my blog – Australia’s household debt problem is not new – it is a neo-liberal product – for more discussion on this point.
The banksters have sought to load as much debt onto households as they can in search of their profits and have ignored the obvious risk in doing that in a flat wages growth environment because they know the neoliberal game is to privatise the gains and socialise the losses.
They have used tactics ranging from cutting corners on documentation to outright fraud to push credit onto households.
Further, national income growth is being driven still by household consumption expenditure, which, in part, is being driven, given the flat wages growth, by credit expansion.
Sustaining household consumption growth and continued growth in real estate prices by pushing ever-increasing levels of debt onto households is not a sustainable strategy.
That is what APRA are concerned about. The Chairman documented several initiatives APRA has taken to try to curb the excessive credit growth in the housing market.
However, despite some success, he noted that their were some on-going warning signs.
First, even with “historically low interest rates and an unemployment rate that for the past few years has drifted lower … the overall rate of non performing housing loans is drifting up towards post-crisis highs.”
Second, APRA monitors “lending with a low net income surplus (NIS). This measure represents the lender’s assessment of the surplus income borrowers would likely have left over each month, after taking into account living expenses, debt repayments and adding in some buffers.”
The problem is that the data shows that “a reasonable proportion of new borrowers have limited surplus funds each month to cover unanticipated expenses, or put aside as savings.”
Third, so-called loan-to-income ratios are high in Australia and “well north of what has been permitted in other jurisdictions grappling with high house prices and low interest rates, such as the UK and Ireland.”
But it is here that the limited nature of the public debate is revealed.
While I understand that APRA comment on contemporary developments within their domain and so would naturally talk about the excessive household debt and the excessive low-quality credit growth, within the context of the specific tools that they might bring to bear as the regulator to the problem, the disconnect in understanding is apparent.
People who listened to or read his speech (as I did) would be left with a sort-of ‘partitioned’ understanding of the problem.
Yes, it is clear that household debt is at record levels and shows no sign of stopping its northward trajectory.
Yes, wages growth is at record low levels.
Yes, the wage share in national income is at record low levels.
Yes, unemployment remains high and underemployment is hovering around record levels, meaning that the Australian economy is far from full employment and there has been a rising proportion of precarious jobs.
But to see why these trends (facts) are even more problematic we have to put the issue into the broader context, which commentators rarely do.
‘Liar loans’ are obviously an issue and banksters should go to prison for making them. But even legitimately-documented credit will become problematic if the supporting trends are not in place.
People might conclude that APRA can do something about the housing debt escalation by tightening its own directives to lenders. Which is true. But the consequences of that sort of decision-making are unclear unless we invoke the broader context.
It makes no sense to analyse household debt in isolation to what else is happening in the economy. In that sense, the sectoral balances framework is a suitable way of thinking about these issues.
Please read the answer to Question 2 in my blog – The Weekend Quiz – November 18-19, 2017 – answers and discussion – for more discussion on the derivation of this framework.
We can partition the economy into three broad sectors which produce ‘sectoral balances’ between their income earning and spending activities:
1. Government (G spends, T taxes).
2. Private domestic (S saves, I invests).
3. External (X exports, M imports, FNI net financial flows), so (X – M + FNI) = CAD (Current Account Deficit)
Given that, national income accounting ensures that the sectoral balances equation:
(S – I) = (G – T) + CAD
Always holds. This expression just says that government sector deficits (G – T > 0) and current account surpluses (CAD > 0) generate national income and net financial assets for the private domestic sector.
Conversely, government surpluses (G – T < 0) and current account deficits (CAD < 0) reduce national income and undermine the capacity of the private domestic sector to add financial assets.
National income changes will bring these aggregates into line with the sectoral balances expression because S, T and M rise when national income grows.
The problem is that shifts in behaviour of any sector, impact on the balances of the other sectors via these income changes, and feedback on the sector initally changing its behaviour.
For example, output, employment and national income are positively driven by aggregate spending. Firms form expectations of future aggregate spending and produce and hire accordingly even if they are uncertain about the actual demand that will be realised when the output emerges from the production process and sales occur.
Imagine if households desire to increase their saving out of disposable income. The first signal firms get that household consumption is falling is in the unintended build-up of inventories. Sales fall and stocks accumulate on shelves and in warehouses.
That signals to firms that they were overly optimistic about the level of demand in that particular period.
Once this realisation becomes consolidated, that is, firms generally realise they have over-produced, output starts to fall. Firms layoff workers and the loss of income starts to multiply as those workers reduce their spending elsewhere.
As national income falls, so does overall saving (as some proportion of the loss of income).
The attempts by households overall to increase their saving ratio may be thwarted because income losses cause loss of saving in aggregate. This is called the Paradox of Thrift.
The initial change in behaviour feeds back and may undermine the initial desired shift.
So while one household can easily increase its saving ratio through discipline, if all households try to do that then they will fail. This is an important statement about why macroeconomics is a separate field of study.
But as the economy is falling into recession, tax receipts for government fall (as they are linked to activity), which pushes up the fiscal deficit (G – T) – this is the so-called automatic stabiliser effect.
And imports fall because they are linked to national income – so the external deficit might decline (if exports are maintained). Much of the reduction in Greece’s current account deficit after the crisis was nothing to do with increased external competitiveness but rather the deep Depression killed imports growth.
Typically, the only way to avoid these spiralling employment losses in this type of scenario would be for an exogenous intervention to occur – in the form of an expanding public deficit or a boost to net exports.
The former strategy – increase the discretionary fiscal deficit is certain to expand output and restore growth whereas the second path is uncertain and fraught.
Now, in the current situation, APRA is correct to worry about the burgeoning household debt. But they should also acknowledge that the problem cannot be isolated to bank behaviour or households seeking to borrow to much.
These are related causes.
In Australia’s case, the latest economic predictions are contained in Budget Paper No.1 and are as follows:
1. The fiscal deficit for 2016-17 of -2.1 per cent of GDP reducing to -1.6 per cent of GDP in 2017-18, then -1.1 per cent (2018-19), -0.1 per cent (2019-2020) and a surplus of 0.4 per cent in 2020-21.
2. The current account deficit to be come down from 4.4 per cent in 2015-16 to -1.5 per cent of GDP in 2016-17 and 2017-18, then stabilising at 2 per cent (2018-19).
I note that the average current account deficit since fiscal year 1974-74 to 2015-16 has been -3.9 per cent of GDP. So we might consider that sort of performance to continue over the fiscal projection period. There is certainly no expectation that the current account will suddenly record close to balance as is projected by the Government over the fiscal forecast period.
So what does that mean in terms of the sectoral balances?
We know that the financial balance between spending and income for the private domestic sector equals the sum of the government financial balance plus the current account balance.
The following graph shows the sectoral balance aggregates in Australia for the fiscal years 2000-01 to 2020-21, with the forward years using the Treasury projections published in ‘Budget Paper No.1’.
The vertical black line demarcates the actual from the projected data.
All the aggregates are expressed in terms of the balance as a percent of GDP
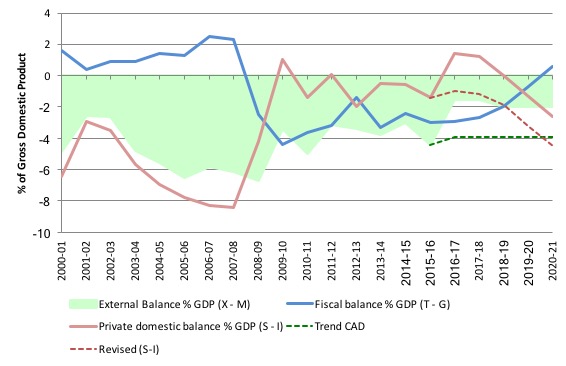
So it becomes clear, that with the current account deficit (green area) more or less projected to be constant over the forward estimates period, the private domestic balance overall (solid red line) is the mirror image of the projected government balance (blue line).
In the earlier period, prior to the GFC, the credit binge in the private domestic sector was the only reason the government was able to record fiscal surpluses and still enjoy real GDP growth.
But the household sector, in particular, accumulated record levels of (unsustainable) debt (that household saving ratio went negative in this period even though historically it has been somewhere between 10 and 15 per cent of disposable income).
The fiscal stimulus in 2008-09 saw the fiscal balance go back to where it should be – in deficit. This not only supported growth but also allowed the private domestic sector to rebalance its precarious debt position somewhat.
Re-check the Household debt graph (above) which showed that the sector started to stabilise its debt to income ratio after the onset of the GFC with support from the fiscal deficit.
You can see the red line moves into surplus or close to it. The long-run average private domestic deficit is 2.1 per cent of GDP and was achieved largely when the household saving ratio was between 10 and 16 per cent and private investment in capital formation was strong.
The fiscal strategy outlined by the Government last May clearly implied that the private domestic sector would resume accumulating debt as it progressively spends more than its income.
In fact, the external deficit assumptions built into the fiscal strategy were overly optimistic and so I remodelled the outcome based on the the long-term average current account deficit of 3.9 per cent – the dotted lines show this alternative scenario.
Under this more realistic assumption, the private domestic sector experiences increasing deficits – heading towards the pre-GFC levels.
Either way, the fiscal strategy being followed by the Government has pushed Australia back on to the path back of excessive private domestic debt levels.
A return to pre-GFC behaviour, which was unsustainable.
Further, the fiscal estimates last May suggested that total private investment would decline by 6 per cent in 2016-17, be flat (no growth) in 2017-18 and exhibit modest growth in 2018-19.
For the overall sectoral balances to have any coherence – then the following observation is obvious.
For the private domestic sector to move from a deficit of 0.6 per cent of GDP in 2015-16 to 4.5 per cent of GDP in 2020-21 under the alternative (dotted) assumptions or to 2.6 per cent of GDP under Government assumptions, with private investment in sharp decline or largely static, the household sector is going to have to be spending much more than its income, and, increasingly so.
That would mean the implied build up of private sector debt will be borne by the household sector, already carrying record levels of debt.
But, then you examine the other fiscal projections in Table 1 of the Economic Outlook, presented in Budget Paper No.1 and the outlook for household consumption and dwelling investment are fairly constant or falling (in the case of home investment).
So the question then is obvious – where is all the private domestic sector spending implied by the sectoral balances analysis going to come from?
The answer is also obvious: the Treasury estimates are inconsistent. They do not add up. Which would not be the first time that observation has been apparent.
In other words, the fiscal estimates provided by the Government are concocted in an ad hoc manner which little recognition of the underlying relationships that have to hold between the three macro sectors.
If the projections are to be believed then the Government is expecting the private domestic sector to maintain the growth in the economy by increasing its indebtedness.
That would mean we are heading in the same direction as before the crisis – growth becomes reliant on private debt buildup.
The whole nation is transfixed on fears that the government debt in Australia is too high – courtesy of all the scaremongering that has been going on. But nary a word gets mentioned about the dangerous private debt levels.
This is the broader picture that APRA should be acknowledging. Rather than sit in its cocoon and talk about reducing loan-to-income ratios and the like, it should recognise that borrowing behaviour is just part of a broader picture.
If the Australian government continues to pursue its stated austerity plans then the private domestic sector will have to continue increasing its indebtedness, especially given the flat wages growth.
If the private domestic sector does follow APRA’s lead and bank lending is reined in somewhat then there will be a recession if the Government maintains its austerity bias.
And, through the income effects on the balances, the Government will record deficits in 2021 as a result of the poor economic results rather than using its fiscal policy capacity to improve well-being.
On a similar theme, the Conversation, which has what I consider to be a suffocating editorial policy and refuses to allow authors to write on topics that the editors do not think are worthy (so much for academic freedom), published a disgraceful article today (November 22, 2017) – Young Australians will wear the costs of Turnbull’s middle income tax cut.
The discussion was not worthy of reaching the eyes of the world. It is simply neoliberal propaganda.
It purports to be expert commentary about some proposed tax cuts by the Australian government, which were floated this week as a way of deflecting attention from the massive failings of the Government.
As far as we know there is no hard analysis available from the Government to justify the cuts or their consequences.
The article in the Conversation seeks to fill the void. It fails.
It claim that the tax cuts would maintain a fiscal deficit in 2021 despite the intention of the Government to be in surplus by then. We hope and pray it doesn’t stick to that intention and “the announcement in the 2021 budget of Australia’s 13th successive budget deficit” would be welcome.
It would continue the long tradition of the Federal government running deficits to support the desire of the non-government sector to save overall, especially in the context of an on-going external deficit of around 3 to 4 per cent.
The Grattan Institute (which houses the authors of the article) has long tried to tell the Australian public that deficits are bad and burden future generations. You know the line.
They are at it again.
We read:
Grattan Institute research shows that each year the government runs a A$40 billion deficit, it increases the lifetime tax burden for households headed by a person aged 25 to 34 by A$10,000. This is based on the share of debt they would have to repay – with interest – over time. With each successive budget deficit, the tab grows for today’s young Australians.
The reality is different. No-one aged 25 to 34 will be paying back public debt over their lifetime. And many would benefit from the fact that their superannuation funds will be holding that debt and earning income from it.
Remember we do not pay taxes to fund the Australian government spending.
Please read my blog – Taxpayers do not fund anything – for more discussion on this point.
Sure enough, if you can do some simple arithmetic you can come up with Per Head $ calculations for anything. But to be meaningful they have to ground them in something coherent.
The Grattan Institute has no coherent macroeconomic understanding and continues to pump out this meaningless propaganda.
Which tells you that the Grattan Institute is just part of the problem and its public funding should be immediately withdrawn.
Conclusion
Australia – like the rest of the world – needs politicians and officials who understand all this stuff.
While the APRA boss is correct to highlight the precarious nature of household balance sheets given the record and increasing debt levels being borne by households who are experiencing a wages squeeze and a government intent on austerity cuts, he should be educating the public on the broader context.
Then there would be more acceptance of expanding discretionary fiscal deficits and a wages policy designed to bring real wages growth back into line with productivity growth.
If that was the case, the idiots at the Grattan Institute would find no-one to publish their nonsense.
That is enough for today!
(c) Copyright 2017 William Mitchell. All Rights Reserved.
I was active on The Conversation today as I could not stomach the utter tosh that the authors were spouting. I try to correct the rubbish macroeconomics that successive authors put forward as “Academic rigour, journalistic flair”. Its definitely not the case for most economics articles!
G’day Bill and others. I felt frustration at the Grattan Institute article today at The Conversation and immediately checked with others more learned than I whether it indeed sound like nonsense.
How do we go about changing some of the established and incorrect economic ‘dogma’ that emanates from mobs like Grattan?
The Upton Sinclair quote comes to mind – “It is difficult to get a man to understand something, when his salary depends on his not understanding it.”
Dear Bill
I wonder how many political decision-makers understand that S – I = G – T + CAD. It doesn’t really require an Einstein to grasp it.
Regards. James
“The first signal firms get that household consumption is falling is in the unintended build-up of inventories. Sales fall and stocks accumulate on shelves and in warehouses.”
As a business owner and manager for most of my working life I would not operate on that basis. I admit I have never been in manufacturing, but the principle is the same. I always managed my inventory on a “Just in Time” basis by constantly monitoring sales. It was possible in that way to spot a downturn and upturn. As my mentor used to say “you don’t want to stock anything – you want to sell it”. So a manufacturer should always be adjusting his raw materials inventory to match anticipated sales, and set production lines running at the appropriate rate. Not an easy trick, admittedly, but trends are predictable. You are not looking at downturns (upturns) in inventory – that’s too late – you are looking for decreasing (increasing) demand.
That does not alter the sense of what you are saying.
Similar story in NZ I believe and given our banking systems are interlinked I find this disturbing. Part of me thinks maybe I should withdraw my deposits and stick them under the mattress given that we have no deposit guarantee in NZ. Westpac has been in trouble in NZ for fudging its capital declarations.
I often hear this line in the NZ press: ” NZ has high private debt so therefore the government must keep a low level of debt” – rather than “the NZ government’s surplus obsession leads to high private indebtedness” (given a similar CAD to Australia).
Presumably the reasoning is that should the banks fail due to the high level of private indebtedness, the government can then step in with a massive deficit to bail them out. Otherwise I don’t follow the logic.
There seems to be the view that private indebtedness comes first and then government must maintain a surplus to offset that somehow in case they need to do a bail out. Rather than telling the story that the CAD and the surpluses push the private sector into debt in the first place.
Am I missing something?
Whenever I ask mainstream economists about why NZ must run a surplus they always say it’s because of our high private debt. I’d love to read a column about this argument. It would be helpful to counter them.
Nigel, unless you had a crystal ball, monitoring sales is the same as monitoring inventory – just on a shorter timeframe.
Matt,
It always worked alright for me right from when I first learned about JIT procurement back in the mid-eighties. Admittedly I was only ever looking at a very short timeframe. The slight danger is that it is Just Too Late, but I did always keep a small buffer stock of anything that I knew to be fast-moving. It was all done by a mainframe computer that you could set up to monitor sales on a matrix system so the re-stock rate varied according to average historic sales. If you only monitor inventory there is too much of a delay.
It’s not like sectorial balances are difficult to understand. It’s algebra I did in 8th grade.
I started to draw similar conclusions to you about aggregates and where would growth come from if governments didn’t spend during my HSC economic years. I never understood neoliberal theories and was turned off economics.
Then the whole neoliberal bond sale to match deficit spending never made sense to me. There was never any discussion that The Government issued the Australian dollar.
Thank goodness for MMT and it pointing out the obvious. The sad thing is, I’m viewed as a ‘radical’ for merely stating accounting identities. If the government continues with austerity measures and you run a current account deficit, the only place growth can come from is private sector indebtedness.
I’d like to point out that while most of the time i can understand the article no problem, sometimes those negative signs on deficits are making what you wrote there double negatives, making some parts hard to understand.
Such as:
“1. The fiscal deficit for 2016-17 of -2.1 per cent of GDP…”
Just a minor thing. =)
what is confusing for me is if households hold more debt than they did prior to the GFC, then why is their so called savings line (red line) in such a better position (hovering between 0 and -2)?
i realize that since the GFC that govt ran deficits and the CAD decreased, but this does not account for where that extra income/wealth has gone – it can’t have gone to households otherwise they would not be at such a high level of debt would they?
therefore, if the private sector balance is S-I and debt (-S) has increased since 2008, then (I) must have increased quite substantially, correct?