There was a conference in Berlin recently (25th FMM Conference: Macroeconomics of Socio-Ecological Transition run by the Hans-Böckler-Stiftung), which sponsored a session on “The Relevance of Hajo Riese’s Monetary Keynesianism to Current Issues”. One of the papers at that session provided what the authors believed is a damning critique of Modern Monetary Theory (MMT). Unfortunately,…
Iceland should not peg its currency to the euro or any other currencies
In between reading economics articles, I read a lot of fiction novels especially when sitting around airports and flying places. I get through a lot of novels. I am currently tracking some Icelandic noir writers (for example, Arnaldur Indriðason and Ragnar Jónasson) and have been sort of ‘living in the fjords’ lately such is the imagery these great writers present of life in Iceland. I am right up north in a place called Siglufjörður at the moment surrounded by towering mountains and snow storms and enjoying it a lot. It was also where the excellent TV series ‘Trapped’ was filmed. Anyway, Iceland has been firmly in my focus. And the politics of the place is interesting at the moment because with the economy well down the recovery path, the neo-liberals which nearly ruined the place are trying to reassert their mindless policies – to wit, in this case, the Finance Minister claiming that Iceland is thinking about pegging the króna to the euro or perhaps a basket to maintain ‘stability’ (now you can laugh). Current Prime Minister Bjarni Benediktsson has rejected the plan it seems setting up an internal power struggle within the government. One of the reasons Iceland has recovered so well and left the Eurozone nations in its wake is because its currency was floating. Pegging it to the euro would be a very silly thing for that nation to do. Only a little less stupid that trying to revive their old neo-liberal plans to join the Eurozone as a Member State. If they did that then it would be a case of Dark Iceland (the theme of Ragnar Jónasson’s novels) – the economic lights would well and truly go out.
The Finance Minister Benedikt Johannesson is the leader of the Reform Party, which is pro-EU membership and pro free-trade (as the neo-liberals know it).
It broke with the Independence Party over these sorts of issues.
He is calling for a peg because he claims he wants to “stabilise the currency” (Source).
But Bloomberg reported (April 4, 2017) – Iceland’s Currency Speculation Opens Rift in Ruling Coalition – that the Finance Minister’s desires are opposed by the Prime Minister Bjarni Benediktsson, who is leader of the Independence Party.
The Prime Minister:
… underscored the value of a freely floating currency in enabling Iceland’s economic rebound after its 2008 collapse and dismissed as flawed the notion that a fixed exchange-rate regime was the only path to future economic success.
He said:
There are no magic bullet solutions that reduce fluctuations and retain stability …
But pegging is not any solution – it just introduces new problems that Iceland can well do without.
GDP success
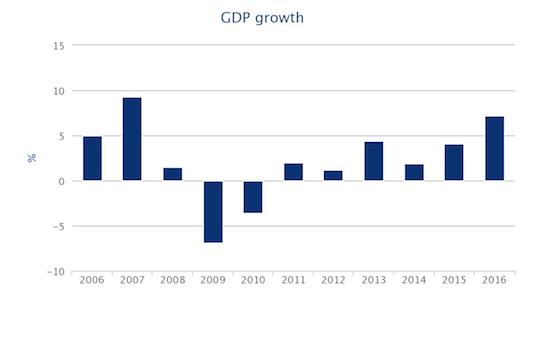
The following graph shows the recent real GDP growth history for Iceland (2006 to 2016). In 2016, the nation recorded a real GDP growth rate of 7.2 per cent and has demonstrated a sustained recovery since the crisis years of 2009 and 2010.
Remember that when Iceland’s financial system collapsed in 2008, the government refused to bailout the private banks and instead restructured domestic bank deposits within newly-nationalised banks, pushing all foreign exposure into the bankruptcy process.
The Icelandic disaster was another demonstration of the perils of neo-liberalism. Its banking crisis had its roots in deregulation and privatisation of the banks which saw their balance sheets multiply many times over in the four years to 2008.
The banks were aided by flawed credit rating reviews and consulting reports provided by hired academics, which waxed lyrical about the solid state of the economy.
Just before the collapse, total bank assets in Iceland were around 11 times GDP and a large majority of the banks’ operations were in foreign currencies, which meant the central bank was unable to provide any security as a lender of last resort.
International markets started to get the jitters in early 2008 and capital inflow dried up, which led to a weakening of the króna and inflation began to accelerate due to the rising price of imports including petrol (Central Bank of Iceland, 2008).
In early October 2008, around 90 per cent of Iceland’s banking system collapsed within a 7-day period and the government stepped in with emergency legislation to save the economy from total collapse. It is the largest bank collapse in history.
The bank collapse exacerbated the currency crisis and the króna depreciated by 50 per cent over 2008 in terms of the euro. This was particularly difficult for Icelandic households who were heavily indebted in foreign currencies and this was compounded by the widespread use of inflation-indexed debt.
But the decline was finite as we see below.
While the IMF became involved under a Standby Arrangement and the government was prevented from introducing a full-scale discretionary fiscal stimulus, the automatic stabilisers certainly were not constrained by mindless austerity and cushioned the loss of total spending.
Moreover, the government, realising it was partially constrained by the IMF program, freed up rules relating to private pension savings and relative to GDP, and the size of the withdrawals from the pension scheme were around the same as fiscal stimulus packages that many other countries adopted in response to the crisis.
In other words, blanket austerity was not imposed on the economy and the spending growth led to an early recovery.
GDP per capita
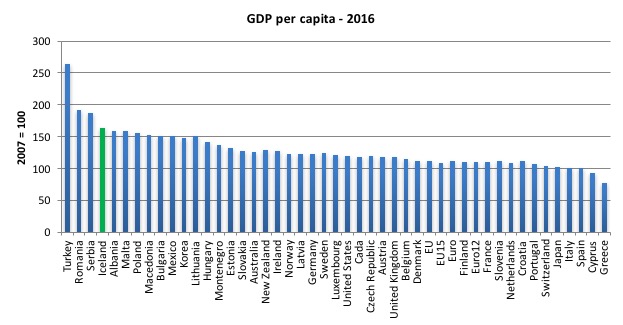
If you think in per capita terms, then Iceland has made a very good recovery from its meltdown. The following graph shows the GDP per capita as at 2016 with the base year 2007 = 100. The data comes from the European Commission’s AMECO database.
Despite the massive crisis in Iceland it still has seen growth in GDP per head of 63.3 per cent since 2007. Of the Eurozone Member States only Malta comes close (both heavily reliant on Tourism). The rest of the Eurozone nations lag well behind and Greece has seen a 23 per cent decline in GDP per head since 2007.
Italy and Spain have stood still.
Interestingly, Denmark, which is often used by the peggers to justify their claims that Iceland should peg to the Euro has seen growth in GDP per head of 12.3 per cent since 2007 (about the same as the Eurozone, 11.3 per cent).
Labour Market improvements
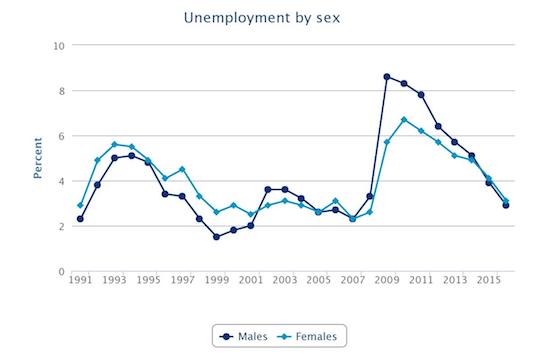
The next graph shows the recovery in the unemployment rate, which has been symmetric for males and females in Iceland.
The unemployment rate is now 2.9 per cent for males and 3.1 per cent for females, not far above the pre-crisis levels.
Compare that to the Eurozone. There were a lot of tweets about this morning after Eurostat released the latest – Labour Force data (for February 2017), which showed that:
The euro area (EA19) seasonally-adjusted unemployment rate was 9.5% in February 2017, down from 9.6% in January 2017 and from 10.3% in February 2016. This remains the lowest rate recorded in the euro area since May 2009.
And evidently, from the tenor of the tweets, we are meant to be happy about that and applaud the Eurozone leaders for making progress.
I would be sacking the lot of them for incompetence.
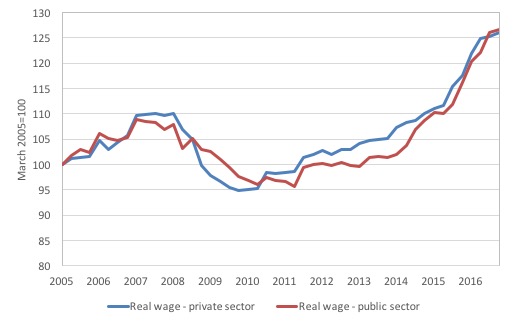
The next graph shows movements in the real wage index for Iceland (private and public sectors separated) from the March-quarter 2005 to the December-quarter 2016.
The crisis clearly saw a massive decline in real wages in both sectors mostly as a result of the rise in the domestic inflation rate driven by the depreciation.
The annual inflation rate rose to 17 per cent in the March-quarter 2009 which dramatically eroded the purchasing power of wages.
But it has now dropped to below 2 per cent (aided by the appreciation) and real wages are now growing strongly again.
No-one is saying that exchange rate flexibility doesn’t bring costs to workers and consumers – clearly import price fluctuations can be very severe (especially for a small island that depends on many imported goods and services).
But the shifts reverse fairly quickly and contain dynamics that aid that reversal (increased competitiveness etc).
Exchange rate flexibility
The following graph shows how many Icelandic Króna is required to purchase one euro from January 2000 to April 2, 2017. The three periods are notable:
1. The massive depreciation, which started in September 2007 (exchange rate 88.53) and hit the trough in November 2009 (184.64).
2. Then the period of stability again until early 2014 as the economy was recovering.
3. Then the steady appreciation as the Icelandic economic growth rate started to accelerate and exports gained strength.
That is a typical pattern and denies the claims that a depreciation is an endless process. Short, sharp depreciations like this tend to be finite events (and painful in the beginning because of their impact on import prices).
The Eurozone Member States would have been much better off had they had this external flexibility when the crisis hit.
Now just imagine what would be the case had Iceland been pegging against the euro.
In the depreciation period, the Icelandic central bank would have had to raise interest rates sharply to attract foreign capital and the fiscal authority would have had to cut domestic growth to constrain imports even further than what happened as a result of the collapse.
That is, a Greek-style Depression would have been inflicted on the nation.
The central bank would also have had to be furiously selling euros into the foreign exchange markets in return for Króna, which would have soon exhausted its stocks.
Meanwhile the speculators would have been shorting the currency knowing that the capacity to maintain the peg would be exhausted (such were the forces that led to the actual depreciation of the scale we observed) and, thus, making matters worse.
Similarly, in the period that the exchange rate has appreciated against the euro as a result of the economic recovery (boom), the central bank would have been under pressure to lower interest rates and buy up foreign exchange (euros). Both actions would not be indicated during a boom that was in danger of spilling over into an inflationary situation.
The exchange rate fluctuation avoided these destructive binds on policy, which a peg would bring.
Pegging a nation’s exchange rate (effectively surrendering monetary independence) means that all adjustments that arise from trading fluctuations have to be borne by the domestic economy. The terminology that is now popular in the Eurozone for that process is internal devaluation.
So instead of allowing an exchange rate to depreciate when a nation’s exports slump relative to imports or financial flows are more out than in, a pegging nation will be forced to engage in internal devaluation, which is a process that effectively brought the Bretton Woods system of fixed exchange rates down in the 1960s (finally ending in August 1971).
A peg is more damaging when there are downward pressures on a currency than when the trading position of the nation is strong and it is facing upward pressure on its currency relative to the currency it is pegging against.
International competitiveness
The evidence suggests internal devaluation does not provide a sound basis for growth.
First, it is a ‘race to the bottom’ strategy that attempts to drives down unit costs via cuts in wages, which undermine domestic spending. But if workforce morale also falls as a result of the wage cuts, it is likely that industrial sabotage and absenteeism will rise, undermining labour productivity.
Further, overall business investment is likely to fall in response to declining spending, which also erodes future productivity growth. There is thus no guarantee that there will be a significant fall in unit labour costs.
There is robust research evidence to support the notion that by paying high wages and offering workers secure employment, firms enjoy higher productivity growth and the nation improves its international competitiveness as a result.
Eurostat data shows that between 2008 and 2013, labour productivity per hour worked rose by 1.8 per cent in Germany, but fell in Greece, the worst hit by the austerity, by 8.5 per cent and in Italy by 0.7 per cent.
So not only does the internal devaluation approach fail to lift competitiveness, it locks in a low productivity path, which undermines increases in real living standards.
The massive costs for nations being subjected to these austerity programs in the form of millions of lost jobs and the very high youth unemployment are much higher in the long-term than any benefits that might arise.
Second, the imposition of domestic austerity and a reliance on net exports for growth cannot work for all nations. To understand that point, we need to understand the concept of a fallacy of composition.
Please read my blog – Fiscal austerity – the newest fallacy of composition – for more discussion on this point.
Does internal devaluation boost external competitiveness?
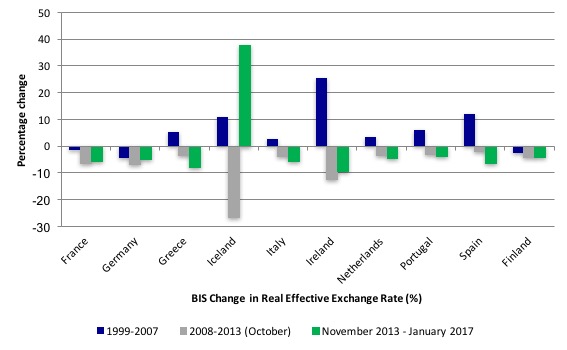
The BIS ‘real effective exchange rate indices’ (REER), which are internationally accepted measures of international competitiveness that adjust nominal exchange rates with other data on domestic inflation and production costs can help us determine the answer.
If the real effective exchange rate rises (falls) for a nation, then it signals a loss (gain) in its international competitiveness.
The following graph shows movements in real effective exchange rates for three distinct periods.
The first, the period of growth from January 1996 to December 2007, then the period from January 2008 to October 2013 (which was the crisis period and is defined by the depreciation in Iceland’s exchange rate to the trough), and finally from November 2013 to February 2017 (the latest data). The data allows a comparison of selected Eurozone nations and Iceland.
The data shows that following the introduction of the euro, international competitiveness for all the nations shown declined except in the cases of France and Germany. Further Germany made relative gains on the rest.
Following the crisis, the general tendency has been for real effective exchange rates to decline. However, the real effective exchange rate for Greece was only 3.3 per cent lower in October 2013 than in January 2008 despite the massive austerity program it has endured.
By comparison, the real effective exchange rate for Germany fell by 6.9 per cent over the same period. Of these Eurozone nations, only Ireland improved its position relative to Germany over this period.
So we conclude that the massive internal devaluations that Greece, Italy, Portugal, Spain and Finland endured in this period did not restore competitiveness relative to Germany.
As the grinding austerity continued, Greece did start to catch up with Germany in the rate of change in the REER but if you take the entire period from January 2008 to February 2017, then the competitive position of Germany has improved more than Greece and all the Eurozone nations other than Ireland and France.
However, the comparison of these fixed exchange rate euro nations with Iceland is striking.
The fundamental differences between the Eurozone nations and Iceland are threefold:
(a) Iceland issues its own currency while the other nations use a foreign currency;
(b) Iceland enjoys a floating exchange rate; and
(c) Iceland sets its own interest rate.
These are the characteristics that differentiate sovereign from non-sovereign nations in terms of the currency in use.
Iceland experienced a massive gain in its international competitiveness in the period from January 2008 to October 2013 with much less austerity. The results for Iceland are actually conservative because its percentage gain in competitiveness from its maximum index value was by far the highest.
The exchange rate depreciation in Iceland made their exports cheaper and demand for them grew rapidly at the same time as import demand fell because of the rise in prices in the local currency. The same sort of dynamic assisted Argentina in growing after it allowed its exchange rate to drop significantly in 2002.
Iceland’s real effective exchange rate evened out after its initial plunge. That is a common pattern. After an initial plunge, the nominal exchange rate stabilises as growth returns. The scaremongers who claim that the weaker euro-nations would experience massive and on-going currency plunges are in denial of history.
Iceland’s approach to the crisis has been less painful and more effective. Greece and other weaker euro-nations could have enjoyed similar improvements in their external competitiveness if they had exited the EMU and allowed their currencies to float.
Internal devaluation has clearly not been an effective route to increasing international competitiveness despite all the neo-liberal claims to the contrary.
The costs of such a strategy have been huge in terms of lost output, mass unemployment and social breakdown.
In the more recent period, Iceland’s REER has risen substantially in line with the growing strength of its economy (rising wages etc). The important point to note is the swing – from crisis to strong growth – and the exchange rate was swinging in a helpful way to facilitate that adjustment.
Not so the Eurozone nations.
Conclusion
The quality of the improvements shown in this blog for the Icelandic economy outstrip what has been going on in the Eurozone.
A move to peg the Icelandic exchange rate to the euro would be disastrous. Only slightly less than actually entering the Eurozone as a Member State.
Back to the dark night … and the frost … and the shadows.
That is enough for today!
(c) Copyright 2017 William Mitchell. All Rights Reserved.

I suspect the attempt to peg the Krona is a way of maintaining the ‘export led growth’ the neoliberal see as nirvana – and emulating Denmark and Norway which Iceland look towards due to their shared histories.
Pegging the currency for export led nations is an acceptable form of currency manipulation that seems to allow them to load up on ‘hard currency assets’ in wealth funds by suppressing the value of their currency. The process discounts the ‘hard assets’ with their own currency while making the balance sheet numbers look good to neoliberals.
I haven’t worked out the precise mechanism for either Norway or Denmark. It’s not that clear how the discounting process works. Norway has the sovereign wealth fund and Denmark seems to use private pension funds for the same job.
The Scottish independence movement seems to be looking at this approach for similar reasons to Iceland. The ‘success’ of Norway and Denmark is a big draw for them all.
The bit they miss is that the ‘hard assets’ are a form of vampirism on the people of the deficit nations. Eventually they will start asking their politicians why the Danes should get a pension off their backs.
As Bill noted, both Norway and Denmark are tourist meccas; re Denmark, think of Legoland. In addition, Norway has oil revenues that it has not squandered, unlike the English under Thatcher. And one of Norway’s most successful companies will not allow short-term investment in the company — you are in it for about 10 years at a minimum or you are not in it at all. This is the antithesis of Wall Street, where, if I remember rightly, the average amount of time a stock is held is 64 seconds. Trading at its best.
Dear Bill
On the graphs about growth in GDP per capita, Turkey went from 100 to 260 in 9 years. That’s a growth rate of more than 10% per year. Surely, that can’t be true.
Regards. James
@ Larry
That figure is remarkable, but you might think that a huge amount of churn would offset by wise institutional investors holding stocks for long periods. If you did think that, you would be wrong, according to this interesting paper ‘Institutional Holding Periods’ by Bidisha Chakrabarty and colleagues, who looked at a large sample of American trading data (“Wall Street”), and found the following information for pension funds (i.e. the guys who are supposed to think long term):
Holding period | %holding | %raw returns
< 1 day | 0.2 | 1.2
< 1 week | 1.3 | -1.5
< 1 month | 3.9 | -3.1
< 2 months | 6.5 | -3.1
< 3 months | 6.7 | -3.4
< 4 months | 6.6 | -3.1
< 5 months | 6.1 | -2.9
< 6 months | 5.4 | -2.4
< 9 months | 14.0 | -2.1
< 1 year | 10.7 | -1.0
< 2 years | 23.0 | 1.3
< 3 years | 9.0 | 3.2
4 years | 2.9 | 6.8
Those are mean values, and each category excludes the previous ones. So the majority of stock was held for less than one year, and apart from a tiny amount of intraday trading, the round trip (buy/sell) lost money on average. The authors explanation is, to summarise rather brutally, the incompetence of the average institutional investor. However, as Keynes noted long ago, “Worldly wisdom teaches that it is better for reputation to fail conventionally than to succeed unconventionally.”
Larry, ’64 seconds? I think I’ve read it is more like 20! 64 seconds is much too long term.
I see over at FT Alphaville they are suggesting a possible “Chechxit” as in the Czech national bank un-pegging from the Euro.
Link