I haven't provided detailed commentary on the US labour market for a while now. To…
Australian labour market – looking pretty wan indeed
Last month, employment growth was basically flat (slightly negative). Participation decreased. The signs were ominous. Today’s release of the – Labour Force data – for January 2016 by the Australian Bureau of Statistics show that those ominous signs have worsened. Total employment growth fell again with massive drops in full-time jobs, unemployment increased sharply and the unemployment rose by 0.2 per cent on the back of the declining employment and steady participation. The teenage labour market continued to deteriorate with the adjusted unemployment rate (taking into account the sharp fall in participation since the downturn) of 28.2 per cent rather than the official estimate for January 2016 of 18.3 per cent. Overall, with private investment forecast to decline further over the next 12 months, the Australian labour market is looking pretty wan indeed.
The summary ABS Labour Force (seasonally adjusted) estimates for January 2016 are:
- Employment decreased 7,900 (-0.1 per cent) with full-time employment decreasing by 40,600 and part-time employment rising by 32,700.
- Unemployment increased by 30,200 to 761,400.
- The official unemployment rate increased by 0.2 percentage points to 6.0 per cent.
- The participation rate was steady at 65.2 per cent. It is still well below its November 2010 peak (recent) of 65.9 per cent.
- Aggregate monthly hours worked increased 10.9 million hours (0.66 per cent).
- The quarterly ABS broad labour underutilisation estimates (the sum of unemployment and underemployment) were updated in the December release month. Underemployment was at 8.4 per cent and total labour underutilisation rate was at 14.3 per cent. There were 1,051.2 thousand persons underemployed and a total of 1.839.3 thousand workers either unemployed or underemployed. The next quarterly release will be in the February 2016 publication released in early March.
Employment growth – continues in negative territory
This month, the zig-zag pattern that we have observed over the last 24 months or so – where the employment estimates have been switching back and forth regularly between negative employment growth and positive growth with the occasional spikes – continues
This month total employment fell by 7,900, the second consecutive month of negative growth.
Full-time employment fell shaprly (down in net terms by 40,600), while growth in part-time jobs (net 32,700) partly offset the decline.
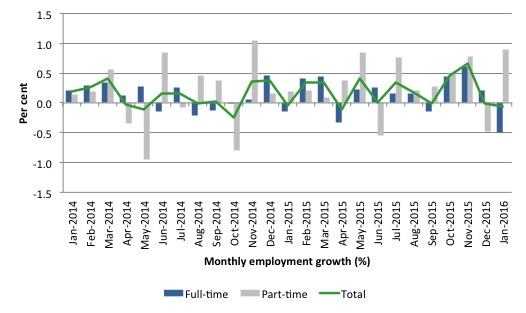
The following graph shows the month by month growth in full-time (blue columns), part-time (grey columns) and total employment (green line) for the 24 months to January 2016 using seasonally adjusted data.
It gives you a good impression of just how flat employment growth has been over the last 2 years.
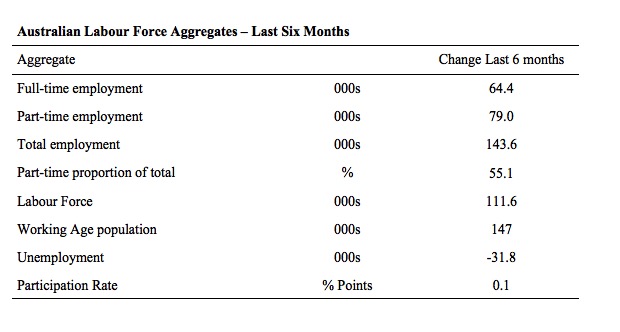
The following table provides an accounting summary of the labour market performance over the last six months. The monthly data is highly variable so this Table provides a longer view which allows for a better assessment of the trends. WAP is working age population (above 15 year olds).
The conclusion – overall there have been 143.6 thousand jobs (net) added in Australia over the last six months while the labour force has increased by 111.6 thousand. Employment growth has thus outstripped the increase in the supply of labour with the result that unemployment has fallen by 31.8 thousand.
This is largely the result of strong employment growth in October and November, which has now vanished.
Full-time employment has risen by 64.4 thousand jobs (net) while part-time work has risen by 79.0 thousand jobs. Thus, 55.1 per cent of the total employment created (net) over the last 6 months has been part-time.
The participation rate has risen by just 0.1 points from very low levels and remains at depressed levels.
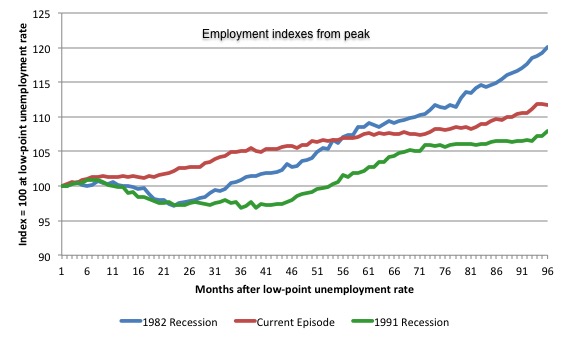
The following graph shows employment indexes for the last 3 recessions and allows us to see how the trajectory of total employment after each peak prior to the three major recessions in recent history: 1982, 1991 and 2009 (the latter to capture the current episode).
The peak is defined as the month of the low-point unemployment rate in the relevant cycle and total employment was indexed at 100 in each case and then indexed to that base for each of the months as the recession unfolded.
I have plotted the 3 episodes for 95 months after the low-point unemployment rate was reached in each cycle – the length of the current cycle.
The initial employment decline was similar for the 1982 and 1991 recessions but the 1991 recovery was delayed by many months and the return to growth much slower than the 1982 recession.
The current episode is distinguished by the lack of a major slump in total employment, which reflects the success of the large fiscal stimulus in 2008 and 2009.
However, the recovery spawned by the stimulus clearly dissipated once the fiscal position was reversed and the economy fell back into producing very subdued employment outcomes. The performance in October and November 2015 showed some signs that the pace of employment growth was picking up but that impetus appears to have disappeared now. The shifts could also be due to the problems that the ABS has been having with its survey reliability over the last several months.
Moreover, since February 2008, employment has grown by a miserly 11.7 per cent, which is a very slow pace in historical terms for such a long period.
Given the variation in the labour force estimates, it is sometimes useful to examine the Employment-to-Population ratio (%) because the underlying population estimates (denominator) are less cyclical and subject to variation than the labour force estimates. This is an alternative measure of the robustness of activity to the unemployment rate, which is sensitive to those labour force swings.
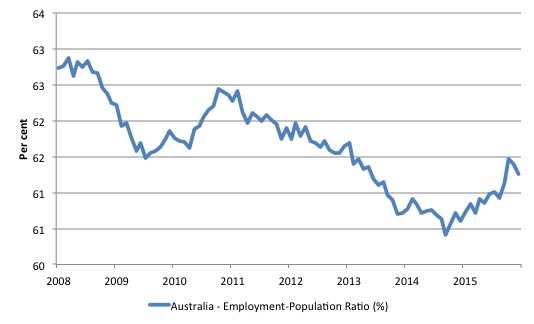
The following graph shows the Employment-to-Population ratio, since February 2008 (the low-point unemployment rate of the last cycle).
It dived with the onset of the GFC, recovered under the boost provided by the fiscal stimulus packages but then went backwards again as the last Federal government imposed fiscal austerity in a hare-brained attempt at achieving a fiscal surplus.
The ratio has been rising since October 2014 which suggested to some that the labour market had bottomed out and would improve slowly as long as there are no major policy contractions or cuts in private capital formation.
However, the peak in November is gone and the ratio is once again in retreat.
The on-going fiscal deficit is still supporting growth in the economy as the spending associated with the mining boom disappears.
The series decreased sharply by 0.1 points in January.
Teenage labour market – continues to deteriorate
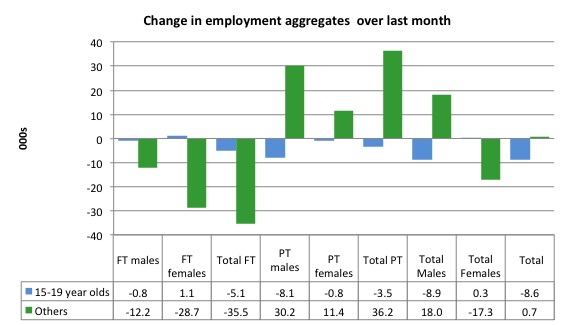
The teenage labour market deteriorated further in January 2016 with full-time employment falling by 5.1 thousand and part-time employment falling by 3.5 thousand.
Total employment fell by 8.6 thousand (net).
The teenage unemployment rate rose by 1 per cent to 18.3 per cent in January 2016.
The following graph shows the distribution of net employment creation in the last month by full-time/part-time status and age/gender category (15-19 year olds and the rest)
If you take a longer view you see how poor the situation remains.
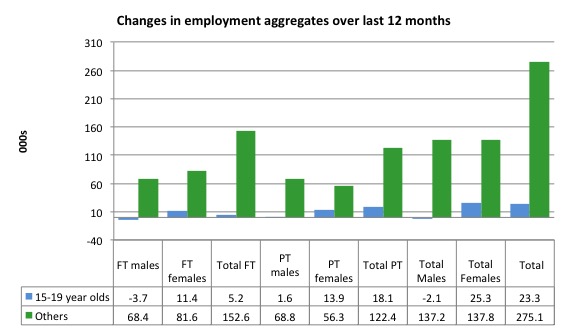
Over the last 12 months, teenagers have gained only 22.3 thousand jobs overall while the rest of the labour force have gained 275.1 thousand net jobs. Remember that the overall result represents a fairly poor annual growth in employment.
The teenage segment of the labour market is being particularly dragged down by the sluggish employment growth, which is hardly surprising given that the least experienced and/or most disadvantaged (those with disabilities etc) are rationed to the back of the queue by the employers.
The following graph shows the change in aggregates over the last 12 months. It is as if the teenagers have not had a stake in the labour market either way (blue bars barely visible)
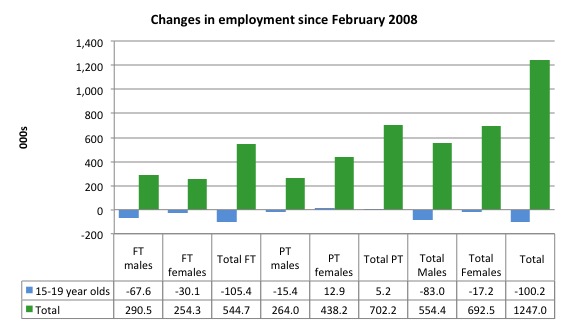
To further emphasise the plight of our teenagers, I compiled the following graph that extends the time period from the February 2008, which was the month when the unemployment rate was at its low point in the last cycle, to the present month (January 2016). So it includes the period of downturn and then the so-called “recovery” period. Note the change in vertical scale compared to the previous two graphs.
Since February 2008, there have been only 1,247 thousand (net) jobs added to the Australian economy but teenagers have lost a staggering 100.2 thousand over the same period. It is even more stark when you consider that 105.4 thousand full-time teenager jobs have been lost in net terms.
Even in the traditionally, concentrated teenage segment – part-time employment, teenagers have gained only 5.2 thousand jobs (net) even though 702.2 thousand part-time jobs have been added overall.
Overall, the total employment increase is modest. Further, around 56 per cent of the total (net) jobs added since February 2008 have been part-time, which raises questions about the quality of work that is being generated overall.
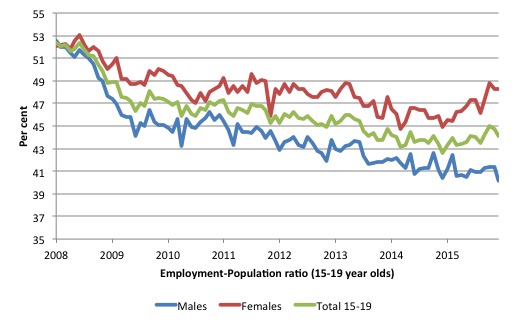
To put the teenage employment situation in a scale context the following graph shows the Employment-Population ratios for males, females and total 15-19 year olds since February 2008 (the month which coincided with the low-point unemployment rate of the last cycle).
You can interpret this graph as depicting the loss of employment relative to the underlying population of each cohort. We would expect (at least) that this ratio should be constant if not rising somewhat (depending on school participation rates).
The facts are that the absolute loss of jobs reported above is depicting a disastrous situation for our teenagers. Males, in particular, have lost out severely as a result of the economy being deliberately stifled by austerity policy positions.
In the last month, with the employment situation improving, there has been some reversal in the downward trends in these ratios.
The male ratio has fallen by 10.9 percentage points since February 2008, the female ratio has fallen by 3.7 percentage points and the overall teenage employment-population ratio has fallen by 7.4 percentage points. That is a substantial decline in the employment market for Australian teenagers.
The other staggering statistic relating to the teenage labour market is the decline in the participation rate since the beginning of 2008 when it peaked in January at 61.4 per cent. In January 2016, the participation rate was just 54 per cent.
That is an additional 116.7 thousand teenagers who have dropped out of the labour force as a result of the weak conditions since the crisis.
If we added them back into the labour force the teenage unemployment rate would be 28.2 per cent rather than the official estimate for January 2016 of 18.3 per cent. Some may have decided to return to full-time education and abandoned their plans to work. But the data suggests the official unemployment rate is significantly understating the actual situation that teenagers face in the Australian labour market.
Overall, the performance of the teenage labour market remains poor. It doesn’t rate much priority in the policy debate, which is surprising given that this is our future workforce in an ageing population. Future productivity growth will determine whether the ageing population enjoys a higher standard of living than now or goes backwards.
I continue to recommend that the Australian government immediately announce a major public sector job creation program aimed at employing all the unemployed 15-19 year olds, who are not in full-time education or a credible apprenticeship program.
Unemployment increased by 30,200 to 761,400
With unemployment increasing by 30,200 to 761,400, the official unemployment rate rose by 0.2 percentage points to 6.0 per cent in January 2016.
Overall, the labour market still has significant excess capacity available in most areas and what growth there is is not making any major inroads into the idle pools of labour.
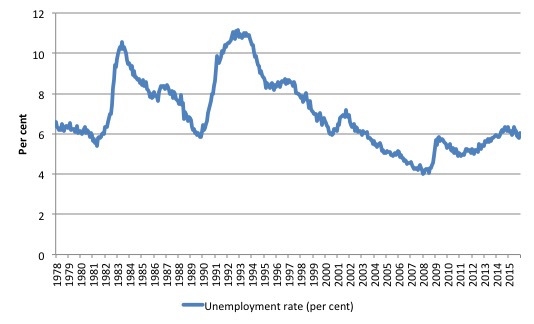
The following graph shows the national unemployment rate from February 1978 to January 2016. The longer time-series helps frame some perspective to what is happening at present.
After falling steadily as the fiscal stimulus pushed growth along, the unemployment rate slowly trended up for some months.
It is now above the peak that was reached just before the introduction of the fiscal stimulus. In other words, the gains that emerged in the recovery as a result of the fiscal stimulus in 2009-10 have now been lost.
Broad labour underutilisation – upwards of 14.3 per cent
The ABS published its quarterly broad labour underutilisation measures for the November-quarter in last month’s data release. So the following reflects the results for that quarter.
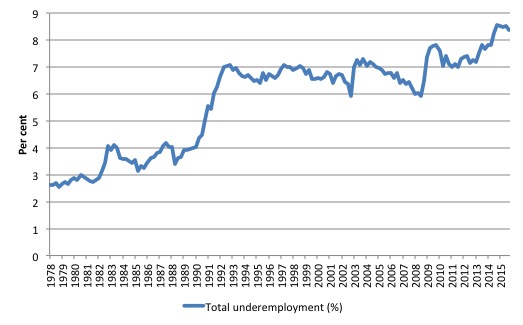
In the November-quarter, total underemployment remained at 8.4 per cent and the ABS broad labour underutilisation rate (the sum of unemployment and underemployment) was 14.3 per cent.
| There were 1,058.4 thousand persons underemployed and a total of 1,797.5 thousand workers either unemployed or underemployed. |
The following graph plots the history of underemployment in Australia since February 1978 to the November-quarter 2015.
If hidden unemployment is added to the broad ABS figure the best-case (conservative) scenario would see a underutilisation rate well above 16 per cent at present. Please read my blog – Australian labour underutilisation rate is at least 13.4 per cent – for more discussion on this point.
The next update will be for the February-quarter 2016 and will be published published in the March 2016 Labour Force release.
Aggregate participation rate – steady
The January 2016 participation rate was steady at 65.2 per cent. It remains substantially down on the most recent peak in November 2010 of 65.9 per cent when the labour market was still recovering courtesy of the fiscal stimulus.
What would the unemployment rate be if the participation rate was at that last November 2010 peak level (65.8 per cent)?
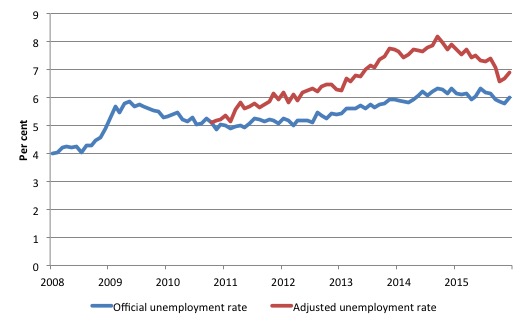
The following graph tells us what would have happened if the participation rate had been constant over the period November 2010 to January 2016. The blue line is the official unemployment since its most recent low-point of 4 per cent in February 2008.
The red line starts at November 2010 (the peak participation month). It is computed by adding the workers that left the labour force as employment growth faltered (and the participation rate fell) back into the labour force and assuming they would have been unemployed. At present, this cohort is likely to comprise a component of the hidden unemployed (or discouraged workers).
Total official unemployment in January 2016 was estimated to be 761.4 thousand. However, if participation had not have fallen relative to November 2010, there would be 881.2 thousand workers unemployed given growth in population and employment since November 2010.
| The unemployment rate would now be 6.9 per cent if the participation had not fallen below its November 2010 peak of 65.8 per cent. The official unemployment in January 2016 was 6.0 per cent. |
The difference between the two numbers mostly reflects, the change in hidden unemployment (discouraged workers) since November 2010. These workers would take a job immediately if offered one but have given up looking because there are not enough jobs and as a consequence the ABS classifies them as being Not in the Labour Force.
There has been some change in the age composition of the labour force (older workers with low participation rates becoming a higher proportion) but this only accounts for about a 1/3 of the shift. The rest is undoubtedly accounted for by the rise in hidden unemployment.
Note, the gap between the blue and red lines doesn’t sum to total hidden unemployment unless November 2010 was a full employment peak, which it clearly was not. The interpretation of the gap is that it shows the extra hidden unemployed since that time.
In recent months, this gap has shrunk as participation has risen.
Hours worked – barely moved in January 2016
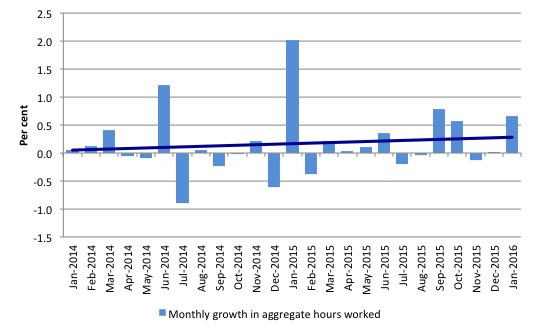
Aggregate monthly hours worked rose by 10.9 million hours (0.66 per cent) in January 2016 in seasonally adjusted terms.
The result is soemwhat confounding given the sharp fall in full-time employment and the rise in part-time employment. But strange shifts in the composition of hours across work categories has been going on for some months now so there could be several underlying reasons for the paradox.
The following graph shows the monthly growth (in per cent) over the last 24 months. The dark linear line is a simple regression trend of the monthly change – which depicts a weak positive trend. You can see the pattern of the change in working hours is also portrayed in the employment graph – zig-zagging across the zero growth line.
Conclusion
In general, I repeat my monthly warning – we always have to be careful interpreting month to month movements given the way the Labour Force Survey is constructed and implemented.
The previous three month’s data from the ABS really stretched credibility given how strong employment is estimated to have been in October and November (which I now consider to be overestimates) and the decline in December.
Today’s figures return us to the pattern that has been common over the last two years or so – with employment growth zig-zagging across the zero growth line.
The conclusion is that the situation is rather weak on the demand for labour side.
Unemployment rose this month solely due to employment growth declining rather than because of any participation shifts.
I remain in two minds as to whether unemployment has peaked or not. If the private investment plans (projected rather significant cuts) for the forthcoming year are realised then peak unemployment will be higher than it is at present.
The teenage labour market remains in a parlous state and it deteriorated further this month.
I consider this situation to warrant immediate attention by the Federal Government. The neglect of our teenagers will have a very long memory indeed and the negative consequences will be stronger given the ageing population.
The Federal government appears incapable of addressing this dire issue.
Weekend Quiz
The Weekend Quiz (formerly known as the Saturday Quiz) will be back again tomorrow. It will be of an appropriate order of difficulty (-:
That is enough for today!
(c) Copyright 2016 William Mitchell. All Rights Reserved.
Thanks for all this detailed analysis. I was referred to your blog by a fellow contributor to a Guardian comment line, following a woefully inadequate short article on recent unemployment figures. I am especially concerned about unemployment amongst mature adults 25-50 year olds – Gen X, I guess. Do you have any particular comments and statistics on that?
A case study in how to wreck a nation.
Wrecking is the only talent our Vermin In Charge possess.
Hi Jay welcome to the centre for reality and reprogramming from the neo-liberal lies we are all barraged with on a daily basis. I recommend going back through bills blogs as there is a wealth of info. Not sure about that particular stat but there’s probably government stats out there to try and estimate. With real unemployment at 16% it will be much higher than it needs to be or should be!
Bill great blog but very sobering to read. What I don’t seem to get is why a government apprentice scheme would be considered a radical idea? If labor proposed to implement a teenage apprenticeship scheme I think the base would come back to them in droves. The media would try to crucify them but I think with social media now it’s a way to cut through directly to voters. Bernie sanders I believe is having the success he is purely from social media. The media ignored him and is now trying to undermine him. It’s going to get ugly but I really hope he can win if the American political system isn’t completely broken. Maybe the world can then have a discussion that destroys neo-liberal economics. I hope within my lifetime.
Oh and one thing I’ve been wondering when I hear that Australia’s economy isn’t tanking faster is all the money coming out of China. People are reselling our products online like baby milk, vitamins and other premium products and posting them for 3x the price. There’s stories of shop shelves being completely cleared and limiting purchases to 4 and not allowing online purchasing of baby milk by woolworths if you have an Asian name. Add in that and all the dark money in our property market, trust me there’s huge money changing hands via local people go get out property I’m not sure how it works but it’s been happening for years. I believe this probably goes one way to explaining how we’ve avoided a recession with this current governments mad austerity policies.
Bill also it would be interesting to see how NZ is going as it sounds like their conservative hogivernment is doing something right unlike ours. This article points to some interesting and sobering reading: http://m.smh.com.au/business/no-one-wants-to-live-in-sydney-ceo-hits-out-over-tax-20160217-gmwkps.html the headline is sensationalist but there’s some interesting points. I wish business people understood that government deficits were good for business and don’t have to lead to higher taxes unless it’s for inflation purposes and/or the government needs to buy some of the resources the private sector is using for a national infrastructure project for example. Then maybe the government would start listening to them. They seem to only listen to business and not voters for some reason. Oh that’s right political donations! Silly me.
I think Michael Hudson is on to something.
He says worldwide austerity is being organised by uncle Sam for one reason and one reason only. That is to destroy Russia and China. Which then allows the U.S. banks to step in and control the world’s public infrastructure.
Which also explains the organised financial crash in 2008 and why no bankers were jailed.
World unemployment levels are seen by Washington as an acceptable by product to achieve this goal. It also allows them to take their own countries public infrastructure first before concentrating all their efforts elsewhere via so called trade deals.
Bill et al.
I see the OECD is calling for urgent fiscal intervention to support global growth.
http://www.oecd.org/economy/elusive-global-growth-outlook-requires-urgent-policy-response.htm
Kind Regards
hi bill,
just to change the subject completely
machinations in china are the flavour of the month these days. depending on which side of the shorting fence you live on , its either business as usual and they are different when it come to the level of social financing, or its the biggest crash in history waiting to happen, and the chinese central bank wont be able to stop it in the long run.
would be nice to get your take on the china sitch from a mmt perspective when you get the chance
@Derek,
if Michael Hudson said this, he needs to see someone about his paranoia.
if I was betting between a ideological stuff up and a conspiracy, i’ll take the stuff up all the time
Right wingers deserve free money apparently! Mindless nonsense from Turnbull, worse than Abbott really.
The government is not concerned with the labour market. Abbott 2 is looking to give away tax free effort free property capital gains:
http://www.smh.com.au/federal-politics/political-news/turnbull-warns-property-prices-will-fall-under-labor-negative-gearing-policy-20160219-gmyq2k.html
Home owners across the country will see the value of the family home “smashed” under Labor’s “very blunt, very crude” negative gearing policy, Prime Minister Malcolm Turnbull has warned.
In a blistering political attack on the opposition’s policy, which was unveiled last weekend and which restricts negative gearing to new properties while also reducing capital gains discounts available to investors, Mr Turnbull warned ” this should put concern into the minds of every single house owner”.
And in a clear sign the federal government is prepared to launch a massive scare campaign in the lead up to the 2016 election over the Labor policy, which is designed to save $32 billion over a decade, Mr Turnbull warned “Bill Shorten’s policy is calculated to reduce the value of your home”.
“The Labor Party’s negative gearing policy and its wind back on the capital gains discount – its increase in tax on capital gains – is a very dangerous one. It’s been very, very poorly thought out,” Mr Turnbull said.
“The consequence of it will be a decline in property prices, every home owner in Australia has a lot to fear from Bill Shorten.”
So do we look at trend estimates or seasonally adjusted figures …. the commentary says that trend estimates are a better way to judge the Labour market … is this correct ?
I read the Greens financial policies a week or so ago. It mentions expensive government programs and accountable government and balancing the budget. It didn’t include the D-word, but it was there all the same.
I actually wrote an email to Whish-Wilson ( The Surf Senator ) and asked if he could maybe change his economic discourse, reframe it, get out of the neoliberal box he’s put himself into and start talking about a Jobs Guarantee and why deficts are a good thing.
I CC’d the email to Di Natale, too.
And I’ve had no acknowledgement from either.
No help there it seems. Must be too busy with their worm farms.