Regular readers will know that I hate the term NAIRU - or Non-Accelerating-Inflation-Rate-of-Unemployment - which…
European Employment Strategy – barely a new job in sight
Eurostat released the latest – Employment – data for July 2014 last week (September 12, 2014) and announced that total employment was up by 0.2 per cent in the euro area. For those that study the data closely you will not be confused. But for the casual observer you might have cause to puzzle. Has this been a sudden turnaround given that last quarter employment growth was firmly negative in Europe? The clue is that Eurostat publish two different measures of employment. The first (published last week) is derived from the National Accounts estimates whereas the other is derived from the Labour Force Survey. The latter doesn’t paint a very rosy picture at all. But whatever these data nuances, the European Commission is still facing a disaster and their latest policy response will do nothing much to alleviate the problem. But then why should we be surprised about that?
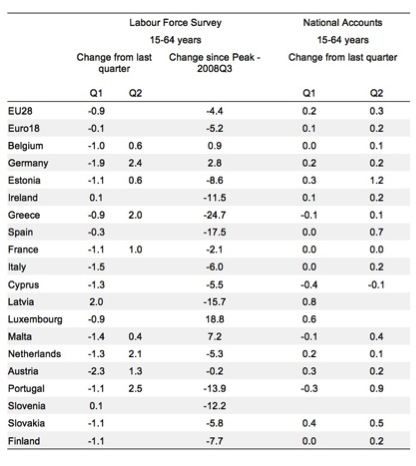
The following table compares the Labour Force Survey (LFS) estimates of employment growth for Quarters 1 and 2 (where available) for 15-64 year olds with the National Account estimates. I added another column from the LFS estimates, which show the percentage employment change since the last peak in the third quarter 2008.
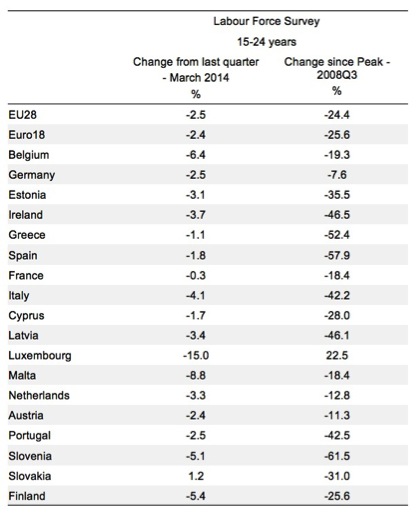
The next Table shows the LFS estimates for the employment growth in Quarter 1 2014 and the change since the peak for European youth (15-24 year olds). The data signifies a disaster.
How do we go about reconciling the two different employment data series?
Eurostat provide a useful publication – Relation between employment in the labour force survey and in national accounts – which allows you to understand the differences but not necessarily resolve the contradictions between the two measures.
Essentially:
1. National accounts estimates emphasise the concept of “employment in resident production units irrespective of the place of residence” whereas the LFS uses a “national concept of employment”, which represents residents in employment.
The difference between the two concepts “corresponds mainly to the net number of cross-border workers”. Typically, the difference is relatively small.
2. The LFS excludes “persons living in institutional or collective households (e.g. conscripts), unpaid apprentices and trainees and/or persons on extended parental leave” whereas national accounts estimates include them. So if there was a host of young people working for free under the burgeoning ‘work experience’ rort that is creeping into advanced labour markets (that is, unpaid work) then the national accounts would include them whereas the LFS would not.
3. The LFS “exclude persons below 15 years old from the definition of employment” whereas the “National accounts do not exclude individuals from employment because of age”.
My experience tells me that the LFS estimates are typically a better guide with less revisions.
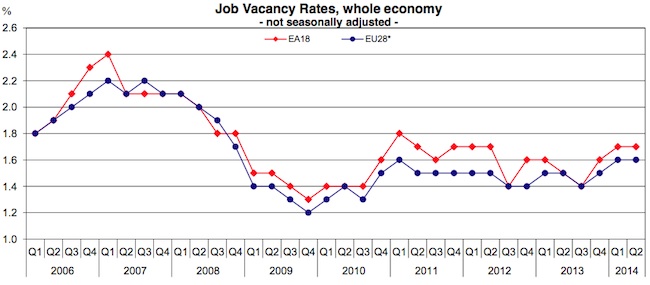
As additional support to the belief that the National Accounts data is presenting an excessively optimistic picture, Eurostat also published the latest – Euro area job vacancy rate stable at 1.7% – yesterday (September 16, 2014), which showed that the vacancy rate has been unchanged since the end of 2010 and has only marginally recovered from the 2009 trough.
Here is the graph from the Eurostat publication.
By any stretch of interpretation though, the data from either source is pretty awful.
So what happened?
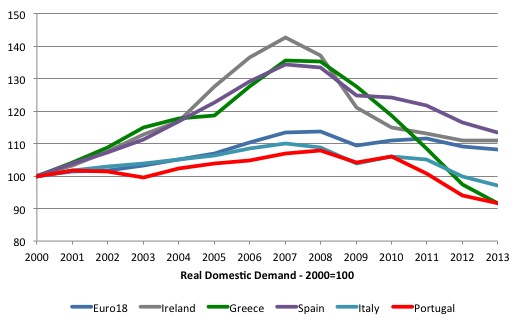
The following graph shows real Domestic demand (indexed at 100 in 2000) for the Euro 18 nations and the PIIGS (Portugal, Ireland, Italy, Greece and Spain).
Domestic demand is the sum of private and public consumption expenditure and private and public investment (capital formation). So it measures total spending in the economy other than that coming from net exports (export revenue minus import spending).
There was a massive collapse from 2007 and no recovery since that time. For nations such as Portugal, Greece and Italy, domestic demand in 2013 was still below the level at the time they entered the Eurozone and surrendered their own currencies.
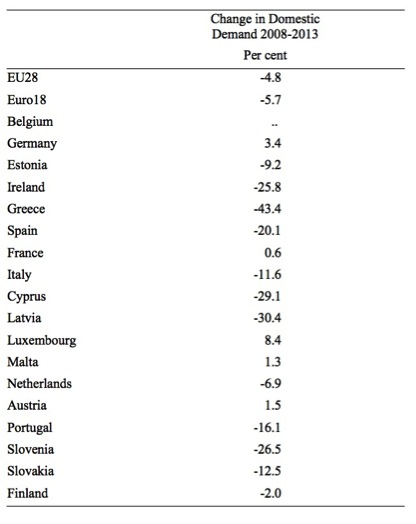
If we consider the Eurozone as a whole the following table shows the change in real Domestic demand between 2008 and 2013 (per cent).
The shifts in lost domestic spending in real terms are staggering. Ireland has lost around 25.8 per cent, Italy 11.6 per cent, Greece 43.4 per cent, Spain 20.1 per cent, Cyprus 29.1 per cent, Latvia 30.4 per cent, Portugal 16.1 per cent.
By any means this data depicts a massive failure of these economies and given we are talking a 5-year period, the outcomes reflect a massive policy failure.
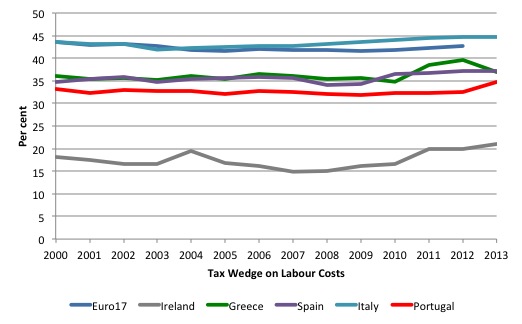
The so-called Tax wedge on labour cost is often wheeled out as a structural constraint on employment in the European context.
According to Eurostat, the Tax wedge is:
… defined as income tax on gross wage earnings plus the employee’s and the employer’s social security contributions, expressed as a percentage of the total labour costs of the earner. The total labour costs of the earner are defined as gross earnings plus the employer’s social security contributions plus payroll taxes (where applicable).
The following graph shows Eurostat’s tax wedge for the Euro17 and the PIIGS from 2000 to 2013. Flatness pervades with minor ups and down.
It is hard to implicate a variable in a massive collapse of another when: (a) the other time series has grown strongly while the variable in question has maintained its value; (b) the other times series changes direction dramatically, with no particular change in the variable in question.
The changes in real domestic demand were cyclical not structural and remain that way in the current period. When I have examined the so-called structural determinants of the so-called Natural Rate of Unemployment (the NAIRU) which are listed by mainstream economists as unemployment benefits, replacement ratios (dole), tax wedges (on-costs etc) I have found: (a) they are highly cyclical; and (b) when you strip the cyclical component out (detrend) you find they don’t explain any change in the underlying estimates of the NAIRU. The evidence supporting the a negative relationship between the tax wedge and the growth in employment is dubious at best.
Further, in the graph below, Ireland stands out as a low tax wedge nation yet its collapse in real Domestic Demand was rather substantial as well.
Now why am I writing that?
Yesterday (September 16, 2014), the Employment, Social Affairs and Inclusion division of the European Commission published its latest major output – Employment policy beyond the crisis – Social Europe guide – Volume 8.
The “Social Europe guide is a bi-annual publication aimed at providing an interested but not necessarily specialised audience with a concise overview of specific areas of EU policy in the field of employment, social affairs and inclusion … Volume 8 looks at EU employment policy, underpinned by the European Employment Strategy. It highlights major initiatives to tackle the disruptive effects of the economic crisis, notably the Europe 2020 Strategy and the European Semester.”
Volume 8 outlines the employment policy that the European Commission has put in place. The Chapter on “Fighting unemployment in a major recession” (starting page 19) says that the massive increases in unemployment in most European nations:
… risk leaving deep scars on Europe’s social fabric, making it harder to achieve the employment and social objectives enshrined in the trea- ties (Article 3 of the TEU commits the EU ‘to work for the sustainable development of Europe […], aiming at full employment and social progress’).
Which is a true statement if there ever was one.
Note the aim of full employment, which means that they have to produce as many jobs as are desired by the available workforce.
There are around 25 million people unemployed in the European Union. If we allow for frictions (around 2 per cent), then they need at least 21 million jobs (about) to achieve their aim of achieving full employment.
So what are they doing about it?
Volume 8 says that the EC is supporting job creation by engendering “Reforms in labour taxation”. How? By “A reduction of the tax wedge”.
Apparently the aim is to accomplish this without “harming a budget. For example, taxation can be shifted in a budgetary neutral way towards environmental, property or consumption taxes – which are less detrimental to employment growth.”
This is the usual mainstream gibberish. Note they propose no net increase in government spending (budget neutral changes) so they do not anticipate a public sector employment stimulus.
Further, consumption taxes undermine spending (refer back to yesterday’s blog about Japan for an example).
There is also nothing to suggest that cutting labour costs increases employment. Firms will not employ labour no matter how cheap it is if there is no demand for their products.
The EC Employment Package also involves the payment of wage subsidies. These might shift employment among different groups in the labour force but do not increase employment overall because they do not increase total spending in the economy.
They propose increasing “in-work benefits to boost ‘take home’ pay for low-skilled workers”. These are essentially a wage subsidy that is paid by the state rather than the employer. However, the evidence is not very supportive that they increase employment.
There have been perverse effects noted where workers will dramatically cut back the hours they work so as to qualify for the benefit.
The fact remains that firms will not employ the workers if there is not a prospect of an increase in sales of their goods. The provision of in-work benefits is not a means of boosting demand especially when they are cast in a fiscally-neutral environment.
The EC also claim that they want to “modernising wage-setting systems … to ensure that real wages reflect productivity developments and support aggregate demand”. We will wait and see whether that eventuates. Certainly, the trend is to widen the gap between real wages growth (which is flat to negative) and productivity growth and rely on credit growth to sustain growth in consumption.
A lethal cocktail but inherent to the neo-liberal policy structures.
All the proposals to solve mass unemployment by job creation will succeed in producing very few net jobs and an insignificant increase in working hours.
They have been tried over and over again and typically fail.
These failed policies are all inspired by the neo-classical textbook claim that unemployment is caused by excessive real wages rather than a lack of spending.
Refer back to the collapse in domestic demand (spending) graph above.
Conclusion
The EC document is very glossy and probably cost a bomb to publish and print. But it doesn’t inspire hope.
Lets hope that the new incoming Commissioner sees things a little differently and realises that she has to demand European governments be permitted to substantially increase their fiscal deficits and engage in some direct public sector job creation.
That is enough for today!
(c) Copyright 2014 Bill Mitchell. All Rights Reserved.
“The EC document is very glossy and probably cost a bomb to publish and print.”
Perhaps that’s how they are going to solve the employment crisis. By publishing more and more glossy reports until everybody is employed producing glossy reports and recycling them.
It’s an approach, but I prefer Keynes digging holes and filling them back in again – as it uses less oil and provides physical exercise at the same time.
Bill, They obviously taken to heart the advice you offered about a month ago along the lines of: “If something doesn’t work, try something else that doesn’t work”.
I think the EU have finally woken up to what needs to be done. I read on Labourlist that the EU have just created the post of “Vice-President for Jobs, Growth, Investment and Competitiveness” and it’s been filled by Jyrki Katainen, the former Prime Minister of Finland.
In addition “The UK’s Commissioner, Lord Hill, will work under the Vice-President for Jobs, Growth, Investment and Competitiveness as part of the ‘A New Boost for Jobs, Growth and Investment’ project team.”
Bill should have got something by rights, but as unemployment in the EU is so high these post have had to have been filled by EU nationals.
Still, I’m sure if they follow Bill’s freely available advice it will only be a matter of months before we see some results.
http://labourlist.org/2014/09/lord-hills-appointment-must-signal-the-beginning-of-a-clear-eu-reform-agenda/
Bill,
From your graph the PIGS (excluding Italy) all appear to have a tax wedge lower than EU17 so how does reducing it further help ? Does Germany have the average tax wedge level?
Regards
I fail to see how jobs control the movement of capital which overpowers all life.
What we have seen in Europe is a failure of the production ,distribution and consumption chain for most.
If we see how real physical capital is allocated within and between these vassal union jurisdictions of London we can begin to understand the problem.
Look even now Irish jet kerosene consumption is 21 % of total………(one of the highest in the world)
So 21 % of total oil capital inputs go into this airborne back and forth economy.
Its therefore a Brownian motion economy with no apparent purpose whatsoever.
Certainly there is very liitle basic local production.
When there was a loss of purchasing power of the UK economy in 2009 discretionary spending was no more.
The tourists and system managers flying the Dublin to London route decreased rapidly.
It experienced the biggest fall of all major routes in Europe.
The irish capital “investments” used to absord this top down demand system were left high and dry.
Now the world is on fire British tourists have little choice but to fly to Ireland or Spain.
Irish based employment & tourist numbers is begining to recover because of this reduction in the size of the EU scarcity engine although wages continue to decline.
As long as capital is allocated by banks and not given freely & equally to all this weird & wasteful production , distribution and consumption chain will continue.
Rab C Nesbitt – the Galswegian social creditor.
Starts at 4.30
http://www.youtube.com/watch?v=foky9oxWwSE
Very little production happens in any part of the UK , this is eurolands function.
However very little consumption happens in Glasgow and the western highlands , much of it by Canadian tourists anyhow.
Indeed I suspect despite its lack of jobs its in dramatic physical surplus in contrast to the rest of the UK “service” economy.
Dork,
It doesn’t even have to be free and equal. Just MORE free and equal. Co-operatives need to be given cheap loans to form their own workplaces. At the moment it is very hard to set one up.
I think alongside public works program, co-operatives need a serious look in as well.
http://www.mondragon-corporation.com/eng/about-us/
Why aren’t there more like this (in Europe especially)?
The Troika principals should be hanging upside down on a gate somewhere. …. anywhere.
@Jeff
We live in a world of surplus.
Why do we need loans for more stuff ???
Let me give a real world example.
We are told there is a shortage of houses in Ireland ( this is really not true, even in urban areas but lets play along with this urban scarcity meme)
In South Kerry where I generally live for the summer there is a massive surplus of holiday houses which remain occupied for only a few months in the year at best.
However people who hold such units need a rental yield to pay taxes (its mainly consumption based taxes in Ireland) and to have enough remaining tokens after inflation and taxes have done their worst.
They therefore hold on to these units which many would not do if there was a unconditional basic income.
In such a case they would sell these units – this would drive down the price to very low levels which would inable local / young people to buy these houses and live in them (most likely you would need capital controls also)
You see we are dealing with the consequences of this absurd long distance trade where the local economy depends on people flying into Dublin , driving a hired new car down to SW Ireland and giving the locals what remains after the corporate sector has taken / destroyed the bulk of the wealth.
As for loans to people.
I was fortunate in having some savings. (why not a basic income ?)
Therefore no need for a loan.
I decided to do a experiment for the summer season.
I bought myself a 13 foot plastic (oil based) boat.
I got to know the local coast , tides and snags etc etc etc these past 6 months.
I am not capable of catching many 1000s of fish using long line methods if I so choose – using extremely limited energy inputs.
I have no real market for this given the local lack of purchasing power so give away the surplus to old people in the village and passing tourists on the beech.
That is the world we live in.
A time where the vast surplus must be wasted as quickly as possible so as to preserve the illusion of scarcity.
Correction
“I am not”
Should read – I am now.
I am not quite a apostle of Jesus yet but I am coming around to his way of thinking.
Question for Bill
Is tourist income subtracted or added from what Seamus Coffee |(see Irish economy blog posting on GDP risies) calls REAL Domestic demand ?
To be honest I am not sure.
for example : A firms investment in a bus to carry external tourists to Sneem constitute real domestic investment ?
As the Irish have lost purchasing power via loss of job / wage declines (1.1% in Q2) their external travel numbers have remained static , meanwhile external visitors has increased.
Obviously this trade for trade sake is highly destructive of general wealth but it does serve the purpose of concentrating it again (this has always been the prime directive of capitalism in my opinion)