In the annals of ruses used to provoke fear in the voting public about government…
Pre-crisis dynamics building again in Britain
The UK Guardian article – Britain’s economy returns to pre-crisis strength earlier than expected (June 30, 2014) was interesting, especially in the light of the major revisions that the Office of National Statistics has announced, which suggest the loss of real output during the crisis was somewhat less (but still very large) than was previously indicated in the official data. One commentator was quoted as saying that the “recession was still huge even if it has now gone from perhaps 10 to 9.9 on the Richter scale”. But when a national statistical agency makes announcements like that people with vested interests in talking the economy up jump and the Government is no exception. The problem is that while growth has firmed over the last three quarters it is mostly due to an increase in private sector debt and a dramatic drop in household saving. There is still support for growth from the Government, which suggests that the austerity hasn’t been as severe at the macroeconomic level as the rhetoric might have indicated. The growth dynamics in the UK are looking decidedly like the pre-crisis build-up, which doesn’t augur well.
The British Office of National Statistics released the latest Balance of Payments release for the first-quarter 2014 on June 27.
The ONS reported that:
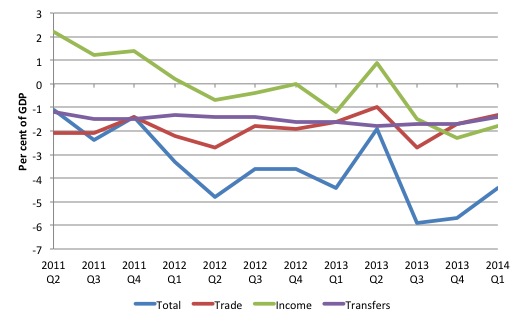
The United Kingdom’s (UK) current account deficit was £18.5 billion in Quarter 1 2014, down from a revised deficit of £23.5 billion in Quarter 4 2013. The deficit in Quarter 1 2014 equated to 4.4% of GDP at current market prices, down from 5.7% in Quarter 4 2013.
The ONS tell us that the “narrowing of the current account deficit was due to all three components improving”. The three components are the Balance of Trade (Exports of goods and services less imports), the income component (recording payments received from and sent to the rest of the world for interest, dividends, profits, etc), and current transfers component (
The statement is a bit misleading because it clouds the fact that exports of goods and services have fallen sharply over the last three quarters (in seasonally adjusted terms).
In the second-quarter 2013, Britain exports were worth £129,014 million. In the March-quarter 2014 they had fallen to £123,372 million, a decline of 4.4 per cent.
Over the same period, imports of goods and services have also fallen sharply from £133,195 million to £128,871 million, a decline of 3.24 per cent.
So the contraction in the trade deficit from 1.7 per cent of GDP in the fourth-quarter 2013 to 1.3 per cent of GDP in the current quarter, is down to declining exports and declining imports, the latter reflecting a slowing domestic economy.
The following graph charts the components of the Current Account (as a percentage of GDP) from the March-quarter 2008 to the March-quarter 2014.
Remember back to when the Conservative government was first elected (May 2010) and the Chancellor George Osborne thought that Britain would enjoy an export-led recovery – IMF style. Well that didn’t happen.
Remember the braggadocio in the Budget 2012 Statement – when Osborne said:
We want to double our nation’s exports to one trillion pounds this decade.
The stuff of dreams. There is no hope that British exports will go close to that target by 2020. In 2012, total exports were £495,284 million. By 2013, they were £505,634 million. Based on the first-quarter 2014, the full-year figure would be £493,488 million and heading in the wrong direction George.
In fact, Britain hasn’t received an overall growth boost from its external sector since the early 1980s and then it was only a temporary phenomenon.
What else is happening that is interesting? The saving ratio is falling again.
The ONS tell us that:
The saving ratio is a key indicator of households’ willingness and ability to purchase goods and services … Given that consumer expenditure accounts for more than 60 per cent of all spending in the UK economy, the importance of the saving ratio and its constituent components is apparent. (Source)
We also have to link movements in the saving ratio with the household sector balance sheet, which is the relationship between household assets and liabilities.
In the pre-crisis period, total household assets rose significantly in the UK mostly by the rising homeprices. The ONS tell us that the “investment in residential wealth has been financed by a corresponding growth in financial liabilities, in particular loans secured on dwellings.
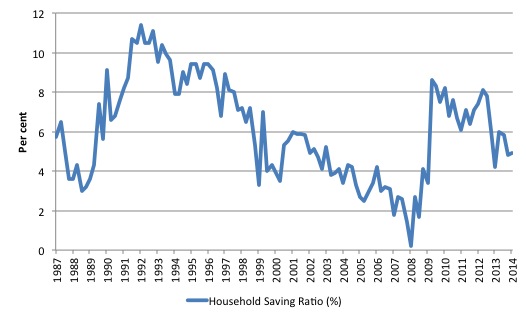
As the credit binge was in full swing, the household saving ratio hit about zero.
The evolution of the British households’ saving ratio (defined by ONS as “Households’ saving as a percentage of total available households’ resources”) since the March-quarter 1997 to the March-quarter 2014 is shown in the next graph. It is really a stunning visualisation of the way neo-liberalism operates – squeeze public sector spending and grow on the back of rising private indebtedness.
The decline towards zero is looking very much like the credit-binge decline prior to the crisis. It has now dropped 3.2 percentage points since June 2012 and 3.7 percentage points since June 2009.
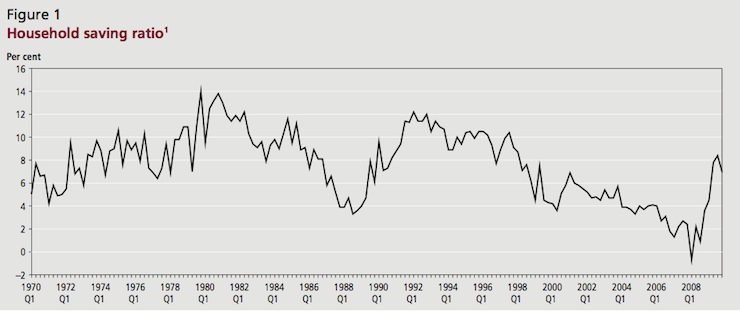
The next graph shows a longer time-series for the saving ratio taken from the ONS publication – Recent developments in the household saving ratio. Note it stops at 2010.
The saving ratio can rise due to a decline in consumption expenditure and/or and an increase in disposable income.
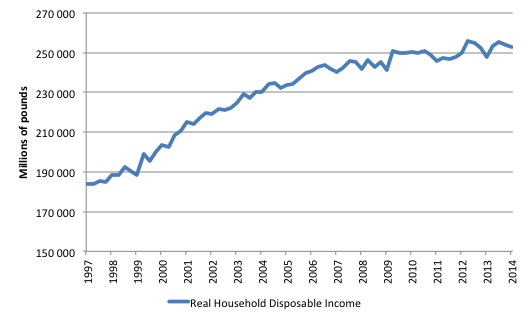
The following graph shows movements in Real Household Disposable Income since the March-quarter 1997 to the March-quarter 2014 in £millions.
There has been very little growth since the onset of the crisis and households are worse off in real terms now than they were in the June-quarter 2012 – by 1.1 per cent.
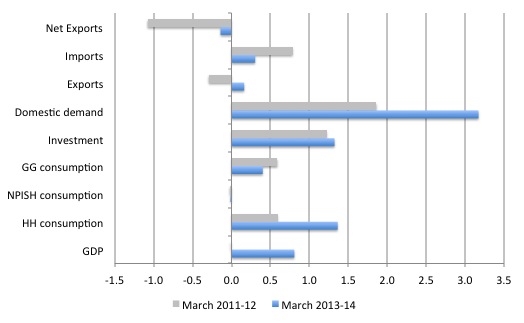
It is clear that household consumption and investment is currently driving real GDP growth in Britain. The following graph shows the contributions to real GDP growth by the National Accounts expenditure components (HH is households, NPISH is not for profit sector, GG is general government) for the year to March 2012 and the year to March 2014.
It is interesting to note that government is still contributing to growth despite all the talk of austerity. While austerity measures can harm people at the individual and household level, it is the macroeconomic impact that matters for total growth and the UK government is still consuming. The investment outcome is also the sum of the public and private investment.
Growth in the UK is coming from domestic demand sources and the external economy is subtracting from growth. So all the Government’s talk about ‘rebalancing towards manufacturing’ to pave the way for an export boom is just hot air really.
The UK is once again floating on the growth in private debt and the decline in household savings. That is not a sustainable growth path.
Finally, I had a quick look at the Sectoral Balances for the UK to verify my understanding of what is going on at present. These balances are derived from the National Accounts data (and the Balance of Payments data).
Skip the following if you know the derivation. The basic income-expenditure model in macroeconomics can be viewed in (at least) two ways: (a) from the perspective of the sources of spending; and (b) from the perspective of the uses of the income produced. Bringing these two perspectives (of the same thing) together generates the sectoral balances.
From the sources perspective we write:
GDP = C + I + G + (X – M)
which says that total national income (GDP) is the sum of total final consumption spending (C), total private investment (I), total government spending (G) and net exports (X – M).
From the uses perspective, national income (GDP) can be used for:
GDP = C + S + T
which says that GDP (income) ultimately comes back to households who consume (C), save (S) or pay taxes (T) with it once all the distributions are made.
Equating these two perspectives we get:
C + S + T = GDP = C + I + G + (X – M)
So after simplification (but obeying the equation) we get the sectoral balances view of the national accounts.
(S – I) = (G – T) + (X – M)
That is the three balances have to sum to zero. The sectoral balances derived are:
- The private domestic balance (S – I) – positive if in surplus, negative if in deficit. A surplus means the private sector overall is spending more than it is earning.
- The fiscal Deficit (G – T) – negative if in surplus, positive if in deficit.
- The current account balance (X – M) – positive if in surplus, negative if in deficit.
These balances are usually expressed as a per cent of GDP but that doesn’t alter the accounting rules that they sum to zero, it just means the balance to GDP ratios sum to zero.
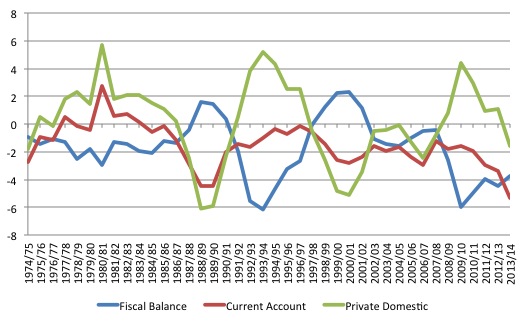
The following graph of the UK sectoral balances is for the period 1974/75 to 2013/14. The final quarter for the financial year 2014 is an estimate.
The traditional near-mirror image between the fiscal balance and the private domestic balance is evident over this relatively long period. When the government deficit rises, the private domestic sector is able to save overall, which means that household saving is greater than investment. The opposite happens when the public sector goes into surplus (look at what happened in the late 1990s.
At present the public deficit is being squeezed by the attempted austerity and the current account is expanding as exports fail to deliver the growth premium forecasted by the Government.
The private domestic sector is now back in deficit.
But the fiscal deficit is still substantial and supporting growth. That is a fact that should be emphasised. The austerity cycle has not been severe enough to eliminate that on-going fiscal support.
There is no recent household debt data for the UK. The last data I have is for 2012 and showed that as a percentage of net disposable income debt had fallen to 150 per cent from its peak in 2007 of 179.8 per cent. As the household saving ratio falls and disposable income growth moderates, that ratio will rise again.
Conclusion
The dynamics are very similar to the pre-crisis period and if the same trends continue then this growth phase may come crashing down again.
That is enough for today!
(c) Copyright 2014 Bill Mitchell. All Rights Reserved.
Bill,
People in the UK have learned not to leave savings in the bank with ZIRP and boomlng house prces but try to spend wisely. Now in pre-election mode tears after the election as nasty medicine doled out!
Bill
Thanks for turning your attention to the Old Country.
The UK appears to be at least at the start of a housing bubble. The concensus on the Macro Prudential Measures introduced by the Bank of England is that they will not be effective.
Do you have a view?
Bill
Although government consumption has contibuted to growth, there has been a reduction in public investment – roughly £1.5bn over the period you show above.
If anyone wants to download the ONS spreadsheet showing all the key info, it is the large (3472kb) download at the botton of this page:
Quarterly National Accounts, Q1 2014
It’s interesting that when he current government started its austerity ambitions, it made the easiest cuts first – these happened to be public investment. In 2010 real public investment was £36.6 bn. By 2013 it had fallen to £30.3 bn. This fall of £6.3 bn was offset by a rise in govt consumption of about £7bn.
So taking the comparision back a year, government has hardly contributed to growth at all.
I think it is still right to think of this as austerity because demand for NHS treatment etc has grown considerably leading to decline in service levels to individual patients and similar things going on in other public services.
Kind regards
The Old Country ?????
The UK was never a nation state , it was & remains a extreme banking fiefdom and is therefore the most extreme example of the globalized financialized concentration of capital claims.
Its primary hinterland is no longer the commonwealth but the EU market state / entrepot.
Its services export is a illlusion of its real goods imports which is now £100 billion + per year.
This is real money as it equates to external resource burn.
If for example only a few billion Sterling was added to Greek basic goods consumption it would make a huge difference to the standard of living.
But it cannot as the goal of capitalism as defined by Belloc is to concentrate wealth and not create or God forbid distribute it.
The second American consumer materialist revolution forced on European culture was nothing more then a con job on behalf of the financial elite – much of whom reside in the shires.
This shows up in a quite contrasty fashion when looking at UK real goods imports.
The real revolution orbits around practical methods to return to the village and not to define the nation you happen to live in within a Imperialist framework.
This would of course amount to a total disaster for the UK given its extreme population density as a result of stripping the worlds hinterland and allowing the subsequent refugees to move in so as to hunt and forage in its strange scarce money ecosystem / glasshouse.
Bill,
You can get the “Quarterly total lending to individuals (including student loans) ” from the BoE website. Look for “Statistics”, “Interactive database”, “tables”, “A Money and Lending”.
And the real net disposable income from the link in my previous comment to the ONS spreadsheet. It appears on the tab labelled “J2 HH Secondary” – in the last column.
CharlesJ
What previous comment about the ONS? Could you elaborate?
Dear CharlesJ (2014/07/02 at 4:56)
Yes, I am aware of that data. But the time series to scale the credit data are less available – like net assets etc
But thanks for the help.
best wishes
bill
Commentors,
Are there times when the private finds it reasonable to go into deficit? Since (S – I) defines the fiscal position of the private sector, Is it possible that firms have many good projects and so are investing heavily? Or should we always expect the private sector to collectively desire outcomes with a positive balance of (S – I)?
Also what are the influences that affect household saving rates? What is the maximum rate at which households are willing to save? I see the factors that drive down savings rates, but in the opposite direction, is there a ceiling to the saving rates of households? That would seem to be an important question for a MMT-following goverment, so they could predict rates of consumption and how much spending will drive the economy. I suspect the answer lies in factors such as: need to plan for illness, need to prepare for retirement, how available is insurance for various events, social and cultural norms, &c.
Thanks, Joel
Joel S,
there was about 30 years after ww2 when private sector was investing heavily and on good projects. I think that was a direct consquence of massive “pump priming” during the war.
Hello PZ,
Thank you for your comment, and you bring up a good point. During the war, the US government only allowed companies to invest in new plant and equipment whose purpose supported the war effort. For example, during the war, US automobile manufacturers produced a miniscule number of passenger cars, instead devoting their plant and equipment to building military vehicles and aircraft.
Also, the US government strongly encouraged households to buy war bonds and save their income, and also rationed goods, which also encouraged saving (through lack of products to buy).
After the war, as wartime restrictions eased, firms invested in new equipment (increasing I) and households ran down saving to buy new homes, cars, and consumer goods (decreasing S).
So maybe you helped me to answer my own question, that is, the fiscal position of the private sector (S – I) may be positive or negative, depending upon many factors, including the location within the business cycle.
But if that is true, doesn’t that make analysis of the economy’s sources and uses of GDP more difficult to analyse? Although the arithmetic is obvious, and the accounting balance is obvious, it’s not obvious if the private sector wishes to live in deficit or surplus at any given time. A private sector position must be examined in the context in which it occurs.
Sincerely, Joel
But Dave says Labour need to apologise for running deficits before the financial crisis. He’s wrong again then, they should have ran larger deficits and not relied on a private borrowing boom and fiscal policy was too tight in the late 1990s.