I started my undergraduate studies in economics in the late 1970s after starting out as…
Treasury boss defending the wrong thing!
Yesterday we had the rather unusual situation of the Treasury Head presenting a robust defence of his Department’s work after various commentators have suggested the forward estimates were flaky to say the least. Overall, it is an amazing exercise given that the issue is about how quickly the federal budget balance will return to surplus. So instead of a robust debate about why the Government is allowing unemployment to blow out and long-term unemployment to become entrenched again, all the hot air is about how quickly the federal government can start trashing the saving capacity of the private sector again. You get some feel for how low brow the debate actually is out there in expert media commentary and interview land by reading the ABC 7.30 Report transcript from last night when the presenter tried to question the Opposition Treasury spokesperson. It was as bad as it gets.
The Treasury Head said in Sydney yesterday that he was defending the budget forecasts which estimate that the recovery will bring above-trend GDP of 4.5 per cent in 2011-12 and beyond. These forecasts have been widely derided by all and sundry, including, probably me! The Treasury Head was more aggressive than usual in what is an annual post-budget presentation. He said that the opponents “seemed to think we must have simply plucked the numbers out of the air”.
He claimed the Treasury modelling was sound and reflected the experience of the most recent recessions. He said that forward growth estimates were typical of the performance that Australian economy had achieved in previous recoveries. The Treasury case is based on Budget Statement No. 2 where the discussion and rationale for the forward estimates is presented in some detail – well not enough for my liking but enough to see what they are thinking.
You can read about their Medium-Term Analysis Methodology which explains how they produce the forward estimates.
The Treasury says:
The fiscal aggregates in the 2009-10 Budget are underpinned by projections of the economy formulated through updated methodology, under which GDP is forecast to grow below trend in the year following the budget year, and projected to grow above trend in the projection years of 2011-12 and 2012-13 …
The medium-term projections extend this methodology by projecting GDP to grow above trend for a further four years, having the effect of bringing the unemployment rate down by half a percentage point each year until it reaches the non-accelerating inflation rate of unemployment (NAIRU) of 5 per cent in 2016-17 … This is consistent with the pace of the mid-1980s and mid-1990s recoveries. Once the NAIRU is reached, GDP is assumed to grow in accordance with changes in population, participation and productivity, just as in the intergenerational reports.
While the entire analysis dies on its assumption that the NAIRU is fixed at 5 per cent and not cyclically sensitive we won’t go into that travesty of logic and evidence here. Please read my blog – The dreaded NAIRU is still about! for a full critique of this nonsense.
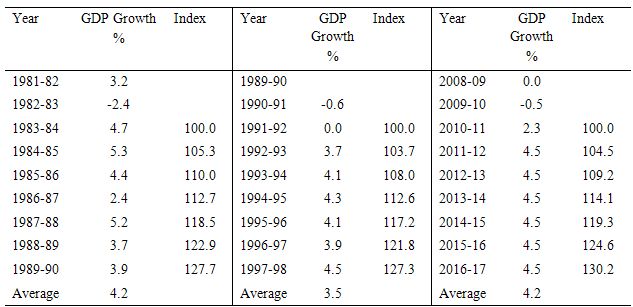
Anyway, I created the following table and graph to show you how the current forward estimates sit with the growth phases of the previous recessions in 1982 and 1991. The analysis is less exact given I used fiscal years to accord with the Treasury approach (aligned to budget outcomes). So I just assumed that growth began again in the first year it was positive after the trough. The GDP growth column is then the annualised percentage growth in real GDP for each of the next 6 years into the recovery, with the average growth over that period also shown.
The Index column for each recovery just makes it easier to see what happened in each. We just set the first growth year to 100 and then express each subsequent year relative to that base. I am assuming without question here that all the estimates of when growth resumes this time are as the Treasury indicates. I think there is risk in accepting those at face value but that is the topic of another blog.
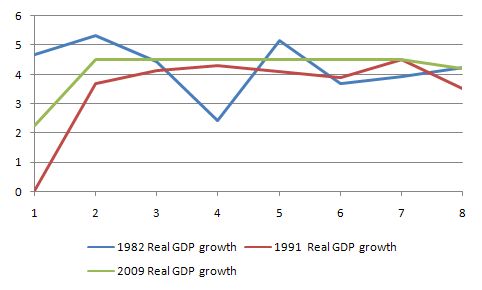
You can see that the 1982 and 1991 recoveries reached an index value of 127 (odd) after 6 years of recovery although the profile of the recoveries was a little different. For the projected recovery after we hit this bottom the estimated growth path is above those of the previous two recoveries. The cumulative difference is not insignicant. I tested the sensitivity of the overall average to the later year forecasts of 4.5 per cent and growth could be somewhat lower in those years and still be above the averages achieved in previous recoveries. Astute readers will realise that the base year selection also matters in this exercise because in 1991 the first year of recovery was in fact no growth whereas in the 1982 recovery there was a strong bounce-back which died fairly quickly. With fiscal year data is it difficult to pin this down.
You can get a better impression of the differences by consulting the following graph which just charts the actual (or estimated) growth rates for the three recoveries. You can see that the projected recovery this time lies at the optimistic end of the previous experiences.
So the data itself doesn’t really blast the Treasury out of the water. However, I will provide some more analysis of this in a later blog when I get some more data from the US. There is still some more financial anguish to come out of there which will impact on the global recovery. But the fiscal stimulus is pumping lots of demand into the Australian economy and this is likely to work in our favour.
The problem with all of this however, is that the debate is focusing on these unknowables because of the obsession with getting the government back into budget surplus. My feeling is that if they actually try to enforce a 2 per cent spending growth rule they will impact significantly on the growth performance in the years ahead.
But moreover, why isn’t there a chapter in the Budget papers on getting the economy back to full employment? The Treasury will say that it what this analysis is all about because they equate full employment to the NAIRU. However, the NAIRU is so not equal to full employment that it means once again all the policy design that has gone into this Budget are entrenching persistently high unemployment for the next growth cycle.
For that, this Government deserves to have only one-term.
And I won’t even comment on the performance on the ABC 7.30 Report last night. Averages, growth rates, babble babble. It was shocking!
Public Policy lecture on macroeconomics
Tonight we are running the second of three public lectures in Newcastle on macroecomics. Professor Randy Wray who I am working with on a number of projects at present is visiting CofFEE at the University and together we are presenting three lectures the second which will be tonight and the last next Wednesday.
All are welcome if you live in Newcastle or can travel.
You can find further information from the CofFEE Page.
For those that cannot travel we will have video and audio podcasts available soon.


Labelled axes, please?
Yes, I forgot – rushing to finish it. The text explanation makes it clear what the axes are. To be clear x-axis = fiscal years after growth resumed; y-axis = annualised fiscal year real GDP growth.
best wishes
bill
Ah. Many thanks.
Dear Bill,
It appears to me that even though we have had a change of government from Coalition to ALP we have not had a change of economic advisors (public service or externall) and therefore we remain trapped in economic neverland.
The growth projections from treasury, real or imagined are a waste of space. As soon as economic growth becomes strong they will be using unemployment as a weapon to fight what they wrongfully declare as inflationary pressures.
I have not looked at the so-called treasury model for a long long time but from what I remember employment is assumed to be determined endogenously. This is clearly wrong because the impact government has upon employment through changes in its budgetary position (surplus or deficit) must make unemployment an exogenous variable.
Cheers, Alan