Last Friday (December 5, 2025), I filmed an extended discussion with my Kyoto University colleague,…
Australia – falling inflation belies all the boom talk
The Australian Bureau of Statistics released the Consumer Price Index, Australia data for the September 2011 quarter today and it revealed that the easing in the inflation rate detected in the June quarter has continued. The last three quarters have delivered inflation rates of 1.6 per cent in March 2011, 0.9 per cent in the June quarter and now 0.6 per cent in the September quarter. If that trend continues the annualised rate will fall below the Reserve Bank of Australia’s (RBA) lower inflation targetting bound. The annualised inflation rate fell from 3.6 per cent in the June quarter to 3.5 per cent in the 12 months to September 2011. The ephemeral factors associated with the impacts of the natural disasters (floods and cyclones) that our food growing areas endured earlier this year are now dissipating. The major factors driving inflation now are utility price increases, travel and accommodation. The RBA’s preferred inflation measure (explained below) grew by 0.3 per cent. That will put downward pressure on interest rates. You might ask whether the “bank economists” (the private sector mavens who always think inflation is about to accelerate out of control) predicted this significant easing. The answer is that they predicted that inflation for the September would be running at twice the actual rate. That is, a 100 per cent error – which raises the question yet again – why does the mainstream media rely on their input to guide the public on where the economy is heading.
The summary results for the June 2011 quarter are as follows:
- The All Groups CPI rose by 0.6 per cent in the September quarter 2011 down from 0.9 per cent in the June quarter 2011.
- The All Groups CPI rose by 3.5 per cent over the 12 months to the September quarter 2011 up from an annualised rise of 3.6 per cent over the 12 months to June quarter 2011.
- The largest price rises were for electricity (+7.8 per cent), international holiday travel and accommodation (+5.1 per cent), rents (+1.2 per cent), water and sewerage (+8.6 per cent) and property rates and charges (+5.2 per cent)..
- The most largest price falls were for pharmaceutical products (-5.0 per cent), audio, visual and computing equipment (-3.3 per cent), automotive fuel (-1.4 per cent), vegetables (-2.5 per cent), motor vehicles (-1.0 per cent) and fruit (-1.2 per cent).
Last quarter we saw a small rise in the headline inflation as a result of a shortage of food supplies (principally fruit) due to the floods earlier in the year. I said at the time that this rise would be relatively short-lived and that the underlying inflation rate was falling as the economy was slowing.
It is amazing how the rhetoric has shifted in the last 12 months. A year ago the “bank economists” and media commentators generally were all supporting the view that the Australian economy was in the midst of a once-in-a-hundred year mining boom and that the government had to act quickly to get its budget back into surplus to stop inflation accelerating out of control.
The RBA was also urged to put up interest rates to ease the inflation rate.
The Government played along with this narrative claiming that the Australian economy was close to or at full employment and public spending cuts were required to keep inflation under control.
If you go back through my commentary on the local scene you will find a consistent argument contesting the “full-employment-boom-accelerating-inflation” story. It has been clear that the fiscal stimulus was withdrawn far too early and growth slowed in 2010. The labour market has barely created any new (net) jobs over the course of this year.
It was also clear that the modest inflation push was due to special (one-off) events like floods and cyclones and that the underlying inflation trend (that is, the inflation driven by core factors) was for moderation.
Unemployment and underemployment is rising and there is a general gloomy mood.
The Treasurer responded to today’s figure by saying that:
Today’s result is encouraging, but we know we have many households still doing it tough,
It is clear that the market sentiment is for a fall in interest rates at the next RBA board meeting this coming Tuesday. The Australian dollar fell quickly on the “surprise” (not!) that inflation was at its lowest quarterly rate for more than a decade.
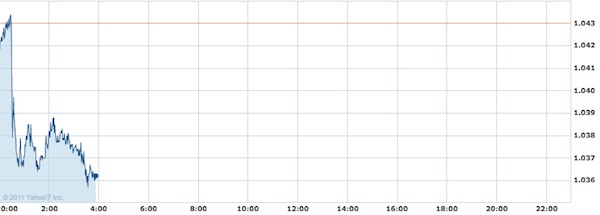
The following graph shows the reaction on currency markets today. The graph opens at 9.00 and the ABS released the data at 11.30 (as the value drops – by about 0.65 percent) and stayed lower (it is now 15:00). Compare this to last quarter’s reaction by the markets. They are both classic announcement effects.
The reason the “markets” and the bank economists keep being “surprised” is because they have bought into the hype about government deficits causing inflation and that the Australian economy is being excessively stimulated by the deficit in the face of the record level terms of trade. We are continually being told how much the mining sector is driving growth.
The reality not often mentioned is that the growth is going overseas – the current account is still in deficit and so the growing export income is allowing imports to grow and the overall contribution of the external sector to local GDP growth is negative.
If the commentators really delved into what has been going on in the labour market – near zero employment growth, rising labour underutilisation and no significant wages growth, then they would not be surprised at all by the moderating inflation. They would have realised that the small spike in inflation in the earlier part of 2011 was almost all down to rising agricultural prices as a consequence of the natural disasters.
Trends in inflation
The headline inflation rate increased by 0.6 per cent in the September quarter translating into an annualised increase of 3.5 per cent for the year to September which is down from the March quarter result of 3.6 per cent.
What does it mean for monetary policy?
The Consumer Price Index (CPI) is designed to reflect a broad basket of goods and services (the “regimen”) which are representative of the cost of living. You can learn more about the CPI regimen HERE.
The ABS say that:
The CPI is a temporal price index for consumption goods and services acquired by Australian resident households. It is an important economic indicator, providing a general measure of price change … The principal purpose of the Australian CPI is to measure inflation faced by consumers to support macroeconomic policy decision making. This is achieved by providing a measure of household consumer inflation by the acquisitions approach.
There are various ways of assessing the general movement in prices depending on the purpose that the measure is being used for. The document I linked to above details some of the approaches. One of these approaches – the “acquisitions approach” – attempts to measure “household consumer inflation” and defines the basket of goods and services as “consisting of all consumer goods and services actually acquired by households during the base period.” The ABS use “market prices for goods and services” (including taxes etc) and make no imputations for “non-monetary transactions” (such as imputed rents). They also exclude “interest rate payments”.
So is a headline rate of CPI increase of 0.6 per cent for the September quarter significant? To examine its lasting significance we have to dig deeper and sort out underlying structural inflation pressures and ephemeral price facts. As the introductory summary shows the price rises are being driven largely by ephemeral factors (and once-off type adjustments – utility prices etc).
The RBA’s formal inflation targeting rule aims to keep annual inflation rate (measured by the consumer price index) between 2 and 3 per cent over the medium term. Their so-called “forward-looking” agenda is not clear – what time period etc – so it is difficult to be precise in relating the ABS data to the RBA thinking.
What we do know is that they do not rely on the “headline” inflation rate. Instead, they use two measures of underlying inflation which attempt to net out the most volatile price movements. How much of today’s estimates are driven by volatility?
To understand the difference between the headline rate and other non-volatile measures of inflation, you might like to read the March 2010 RBA Bulletin which contains an interesting article – Measures of Underlying Inflation. That article explains the different inflation measures the RBA considers and the logic behind them.
The concept of underlying inflation is an attempt to separate the trend (“the persistent component of inflation) from the short-term fluctuations in prices. The main source of short-term “noise” comes from “fluctuations in commodity markets and agricultural conditions, policy changes, or seasonal or infrequent price resetting”.
The RBA uses several different measures of underlying inflation which are generally categorised as “exclusion-based measures” and “trimmed-mean measures”.
So, you can exclude “a particular set of volatile items – namely fruit, vegetables and automotive fuel” to get a better picture of the “persistent inflation pressures in the economy”. The main weaknesses with this method is that there can be “large temporary movements in components of the CPI that are not excluded” and volatile components can still be trending up (as in energy prices) or down.
The alternative trimmed-mean measures are popular among central bankers. The authors say:
The trimmed-mean rate of inflation is defined as the average rate of inflation after “trimming” away a certain percentage of the distribution of price changes at both ends of that distribution. These measures are calculated by ordering the seasonally adjusted price changes for all CPI components in any period from lowest to highest, trimming away those that lie at the two outer edges of the distribution of price changes for that period, and then calculating an average inflation rate from the remaining set of price changes.
So you get some measure of central tendency not by exclusion but by giving lower weighting to volatile elements. Two trimmed measures are used by the RBA: (a) “the 15 per cent trimmed mean (which trims away the 15 per cent of items with both the smallest and largest price changes)”; and (b) “the weighted median (which is the price change at the 50th percentile by weight of the distribution of price changes)”.
While the literature suggests that trimmed-mean estimates have “a higher signal-to-noise ratio than the CPI or some exclusion-based measures” they also “can be affected by the presence of expenditure items with very large weights in the CPI basket”.
The authors say that in the RBA’s forecasting models used “to explain inflation use some measure of underlying inflation (often 15 per cent trimmed-mean inflation) as the dependent variable”.
The special measures that the RBA uses as part of its deliberations each month about interest rate rises – the trimmed mean and the weighted median – also showed moderating price pressures.
So what has been happening with these different measures?
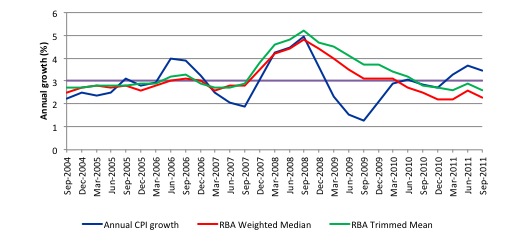
The following graph shows the three main inflation series published by the ABS – the annual percentage change in the all items CPI (blue line); the annual changes in the weighted median (red line) and the trimmed mean (green line). The horizontal purple line (at 3 per cent) denotes the upper bound of the RBA’s target range.
The annual growth in the weighted median fell to 2.6 per cent in the September quarter (from 2.9 per cent in the June 2011 quarter). The trimmed mean fell to 2.3 per cent in the September quarter (from 2.6 per cent in the June quarter). The trend in each series is down.
First, it is clear that the RBA-preferred measures are still well within the inflation-targeting band of 2-3 per cent and falling towards the lower band of the targetting range. That is why the currency fell after today’s announcement – the markets expect the RBA to lower interest rates next Tuesday and therefore reduce the profitability of Australian-dollar denominated financial assets.
Second, the underlying price pressures (say from wages) are declining as the economy slows. There is no inflation threat in Australia at present. The problems are all real – that is declining growth and rising unemployment. They should be the policy emphasis.
The Treasurer’s obsession with getting the federal budget back into surplus is now well and truly out of kilter with what is happening in the broader economy. One of the big risks that commentators claim was behind the alleged need to withdraw the fiscal stimulus – inflation – is declining. The other risk – higher interest rates (notwithstanding that the RBA sets the rates anyway) – are now looking like they will fall.
The indications are that the budget deficit should be higher not lower – given that 12.5 per cent of available workers in Australia are either unemployed or underemployed. That is not to mention the fact that teenage employment has contracted overall since February 2008, when the crisis started to impact negatively on the Australian economy.
The underlying outlook remains relatively benign and the data remains well within the RBA’s targeting range. The swaps market which provides some indication of what the traders think will happen to interest rates is still (when I looked at 14:02) thinking rates will fall over the next 12 months.
My conclusion – there is no case that can be made for an interest rate hike in the foreseeable future notwithstanding the opinions of some of the more gung-ho financial market commentators.
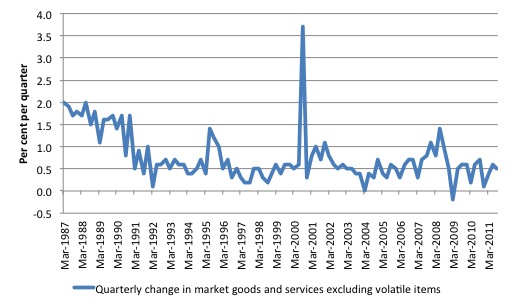
To put the result in perspective consider the following graph which is the quarterly change (per cent) in prices for market goods and services excluding volatile items from the June quarter 1987 to the September quarter 2011.
This series excludes Fruit and vegetables and Automotive fuel and Utilities, Property rates and charges, Child care, Health, Other motoring charges, Urban transport fares, Postal, and Education. So not only the likely ephemeral price items but also government-imposed charges which usually represent step increases in the price level rather than on-going price pressures.
There is no doubt that these non-market impulses can spark a wage-price inflation but that is another story and not relevant for assessing what today’s results mean.
Even the most cursory examination of the graph suggests that today’s data continues a period of relatively low inflation.
What is driving inflation in Australia?
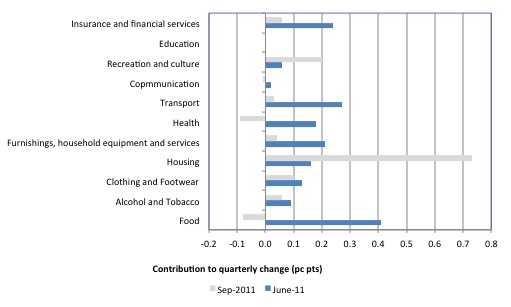
The following bar chart compares the contributions to the quarterly change in the CPI for the June quarter (blue bars) to the September quarter (grey bars). The ABS has just made significant revisions to the CPI in the September quarter.
The ABS say:
This issue introduces the 16th Series Australian Consumer Price Index (CPI), that incorporates an updated weighting pattern, new commodity classification, some new analytical series and some other changes. For more details of changes resulting from the introduction of the 16th series CPI, refer to Information Paper: Introduction of the 16th Series Australian Consumer Price Index, Australia, September 2011 (cat. no. 6470.0), which was released on 22 September 2011. Details of the new weighting pattern have also been released in Consumer Price Index, 16th Series Weighting Pattern (cat. no. 6471.0). As a consequence of reweighting, the points contribution for the June quarter 2011 shown in Tables 7, 8 and 14 differ from that published in the previous issue of this publication.
In other words, there is a break in the series and one should not engage in comparisons with past quarter contributions to total CPI changes by component. I provided the graph spanning the last two quarters because I didn’t want to reconstruct it next quarter. But the comparison between the bars is indicative only rather than exact.
The ABS reports that for the September quarter, the most significant price rises this quarter were for electricity (+7.8 per cent), international holiday travel and accommodation (+5.1 per cent), rents (+1.2 per cent), water and sewerage (+8.6 per cent) and property rates and charges (+5.2 per cent).
The ABS reports that for the September quarter, the most significant price falls this quarter were for pharmaceutical products (-5.0 per cent), audio, visual and computing equipment (-3.3 per cent), automotive fuel (-1.4 per cent), vegetables (-2.5 per cent), motor vehicles (-1.0 per cent) and fruit (-1.2 per cent).
It is clear that food which has been a significant driver of inflation in recent quarters as a result of the floods etc is now not an issue as farm supplies improve.
The transport group (mostly petrol) which has also been driving price movements is also abating. These impacts are beyond the influence of the Australian economy but history shows that recessions generally follow surges in oil prices.
The ABS said that:
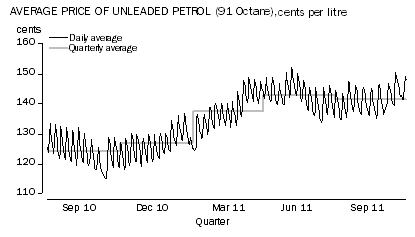
Automotive fuel rose in April (+1.4%), then fell in May (-0.1%) and June (-3.4%), rose in July (+0.5%), fell in August (-0.2%) and then rose in September (+1.8%).
The ABS provided a very interesting graph which showed “the pattern of the average daily prices for unleaded petrol for the eight capital cities over the last fifteen months”. I reproduce that graph next.
The early part of the quarter was dominated by some hefty oil price rises but more recently there has been an easing. The OPEC barons are now much more aware of the damage that a recession can inflict on their revenues and tend to ease more quickly than say in the 1970s.
At present, there is no evidence that demand pull factors emanating from within Australia are driving the inflation trend.
Conclusion
The inflation rate has fallen steadily over the last two quarters after rising earlier in the year due to transitory factors such as natural disasters and external factors (petrol prices).
Related data shows there are no significant generalised wage pressures in the economy at present. It is also clear that the overall economy is slowing and more commentators are finally getting the message that the Australian economy is not overheating and facing an inflationary spiral.
The madness in Europe and the US at present is also conditioning a negative outlook. The real game at present is Europe and the EMU stands on the brink of oblivion giving the appallingly incompetent leadership – they are juggling too many incompatible marbles including their egos.
Tomorrow we will head back to Europe to see what the leadership has come up with!
That is enough for today!
A slightly different thing; political access is worth £112k a year when lobbying.
http://www.youtube.com/watch?v=2XLuaebpdAA&feature=player_embedded#!
I accept Bill’s arguments about the relative weakness of inflation currently. And I do say “relative”. However, I contend and have contended for some time that the ABS consistently under-measures inflation in general and by a considerable margin. I further contend that this under-measurement is the deliberate (though unstated policy) of all recent Federal governments, Liberal and Labor, in Australia. Political and administrative direction and pressure are brought to bear on the ABS to under-measure inflation.
A Federal Government (of any persuasion) has clear incentives, via clear conflicts of interest, to under-measure inflation;
1. It is politically advantageous at all times to announce a low “official” inflation rate.
2. Pensions, superannuation and other government paid benefits which inflation adjusted are adjusted at the rigged inflation rate rather than the real inflation rate. This allows the government to surreptiously retrench these payments over time.
The inflation rate is rigged by using unrepresentative baskets of goods (being especially unrepresentative for the lowest quintile) and temporarily taking out or under-weighting items which are inflating rapidly under the pretext of smoothing volatility.
The top end of town also has a stake in under-measureing inflation while simultaneously claiming that it is always in danger of taking off. Assets inflation driven by the glut of lending and general profiteering can be denied but the tiniest wage rise can decried as inflationary.
The current system is now cleverly designed to remove all money savings from wage earners and put all these monies in the pockets of the plutocrats. Holding wages back and inveighing against budget deficts while using high lending to wage earners to maintain aggregate demand was the masterstroke to strip all wage earners of net assets.