I started my undergraduate studies in economics in the late 1970s after starting out as…
Misrepresentations, misunderstandings and plain factual errors
The Sydney Morning Herald disgraced itself today (July 28, 2011) with two very poor articles about the current debt debate in the US. The ratio of articles on the “conservative-do-not-know-what-the-economics-is-about” side of the debate to the alternative is infinite. There is no progressive commentary at all. Two articles today – Clever money haunts the US and Drowning in red ink – reveal how easy it is to call yourself an expert and get people to listen to you. They are full of misrepresentations, misunderstandings and plain factual errors.
Taking the second article first, there was a graphic at the header of it depicting George Washington sort of swimming in some red fluid with a US dollar bill in the background. I reproduce it below.
If you think about it for one second or less you will realise this is a totally fraudulent representation of the situation in the US. The “red ink” jargon is accounting and auditing terminology which refers typically to the recording of a financial loss or revenue deficit for a private firm. The implication is that insolvency is possible.
There is no application of that concept to a sovereign government – one that issues its own currency and floats it on international markets. The accounting record of a budget deficit for such a government does not mean the government has made a “loss”. There is no such thing as a sovereign government “losing” when it comes to fiscal policy flows.
Further, the only way a government such as the US can “go broke” is if the politicians deliberately and wilfully decide not to use the financial capacity of the government and refuse to credit relevant bank accounts in the non-government sector. That would be an extraordinary conspiracy against the people of their own land and against peoples in other lands that had acquired US dollar-denominated assets. That would represent an act of a failed state and would rival the worst behaviour that we witness in dictatorships where the polity loses its connection with the welfare of its own people.
The article by one Michael Barone (listed as an American political analyst and journalist) began by waxing lyrical about his recollections of the “various currency and debt crises” in the 1960s and 1070s and recalling his central thought – “What a curious thing, I thought, for a great democratic government to be unable to pay its bills”.
He might have learned then that the “democratic” status of a nation (whatever that is) has nothing to do with the capacity of a national government to service all liabilities in its own currency. The only essential (necessary and sufficient) financial condition is that the government issues its own currency. Note, I am talking about liabilities in its own currency.
To ensure a government can honour all its liabilities it must not borrow in a foreign currency or tie its currency to another. But that is a more general condition. The US government, for example, has all the financial capacity it needs to honour any US-liability at any time irrespective of what other circumstances co-exist.
The fact that the US people elect their government has nothing to do with it. Not that I am suggesting the US is a democratic government – that is another debate and I don’t have any particular qualifications to write about it. You would only be getting opinion if I did.
Barone then claimed that:
Now it is the United States that is threatened with inability to pay its bills … To understand what is going on, I think it is helpful to keep in mind two figures. One is 25 per cent. The other is 9 per cent.
In 2009 and 2010 the US government, by the actions of the Obama administration and the heavily Democratic Congress, spent 25 per cent of gross domestic product.
That is an increase – a huge increase – from the average 20 to 21 per cent of GDP spent over the past several decades, under administrations and Congresses of both parties. Part of that increase results from a smaller than usual denominator: GDP that has been sputtering. But part of it results from a vast increase in spending: 84 per cent in discretionary non-defence spending, if you count the US$787 billion (A$721 billion) stimulus package passed in 2009.
In effect, the Obama Democrats have been shifting from the traditional American level of spending to a level much more like that of Europe. Their more sophisticated defenders will tell you that this is necessary in an ageing country with fast-increasing healthcare needs paid for in large part by government. If you are on good terms with them, they will go on to tell you, sotto voce, that if that results in somewhat slower economic growth, well, that’s the price you pay for greater security.
The reference to the 9 per cent relates to the swing in votes from Democrats to Republicans and is discussed in the context of Obama being a failure and so the voting public moved against his thus setting up the budget impasse. That is not the point I wish to discuss – clearly Obama is losing the politics but that is because he was too conservative in the face of the biggest economic threat in 80 or so years.
But the rendition of recent fiscal events provided by Barone which is more or less the “Tea Party” line is not accurate. One might suggest wilfully so.
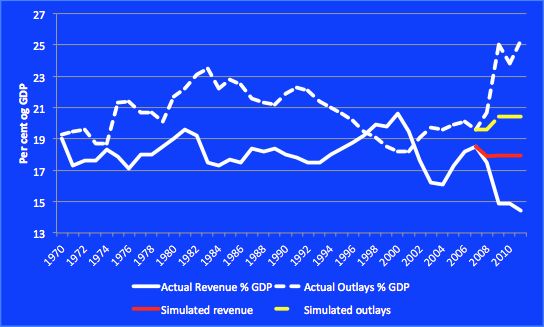
The data from the US Office of Management and Budget does indeed shows that US federal outlays have reached 25 per cent of GDP having risen from around 21 per cent in 2008.
In my recent blog – The financial press mostly reinforces the lies – I analyse that data in some detail.
In that blog I noted that US federal revenue had average 17.9 per cent between 1950 and 2008 but only 14.4 per cent from 2009 to 2011. I also noted that the US Congressional Budget Office considered the real GDP Gap to be averaging 6.2 per cent (of potential output) between 2008 and 2011, which was probably an understatement. The average CBO-estimated output gap between 1962 and 2007 was was -0.3 per cent.
I showed that if the output gap closed back to its long-term average the revenue side of the US budget would increase dramatically (relative to now) and get back towards the 18 per cent of GDP mark.
It is difficult to make an argument – along Tea Party lines – that since 2000 there has been a structural deterioration in the revenue side of the US federal budget. More formal regression analysis confirmed that claim.
Closing the output gap would push US federal revenue back to around 17.9 per cent – in other words, most, if not all of the decline in tax revenue at present is cyclical.
What that means is that if you really want to increase federal revenue you should be fostering growth rather than trying to increase tax rates.
The automatic stabilisers will generate more tax revenue if growth occurs but if the government increases tax rates it will certainly slow down economic growth which will lead to a further decline in tax revenue.
I also analysed the US federal outlays side. The average outlays as a per cent of GDP between 1950 and 2008 was 19.8 per cent. From 2000 to 2008 it was 19.8 per cent (so no discernible increase in the scale of outlays). Since 2008 the ratio has been 24.7 per cent as the graph suggests.
The question is whether that increase is structural or cyclical in nature. Barone is asserting it is structuring notwithstanding the “smaller than usual denominator”.
I showed using regression analysis that if the CBO-estimated Output gap closed back to its average then US federal outlays as a proportion of GDP would return to 20.1 per cent. In other words, most, if not all of the rise in outlays as a proportion of GDP at present is cyclical.
I provided this graph to depict what would happen if the output gap closed back to its long-term average. It reproduces the actual US budget data but from 2007 forecasts revenue and outlays as a per cent of GDP by removing the cyclical fluctuation from the data. It is a very rough indication of the structural balance.
The extra simulated outlays (red) and simulated expenses (yellow dashed) show that if the real US economy had have performed up to its average between 2000 and 2008 the budget aggregates would have followed the red and yellow paths. The deviation between those paths and the white paths after 2008 is all due to the major slowdown in real output growth.
Further, the implied budget deficit is a bit over 2 per cent of GDP which when compared to the average balance over the period 1950-2008 of 1.8 per cent is about on trend. That size budget deficit normally (when private spending is stronger) is about right to maintain strong growth and high levels of employment. The deficit will have to be a little larger these days because the external sector records larger deficits than in the 1950s and 1960s etc.
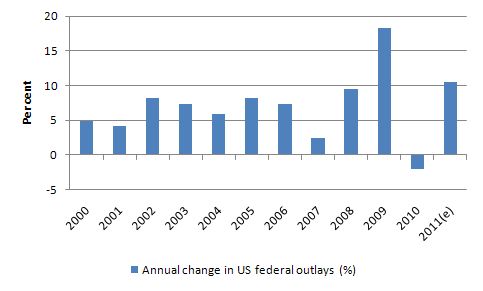
The following graph is from the US OMB data and shows the annual change (%) in federal government outlays. The 2011 (e) refers to the OMB estimate for this year. It is hard to reconcile this official data with the claims made by Barone. His use of the data is questionable in the extreme. Certainly there was a rapid change in the growth in 2008 and 2009 but that was almost all down to the cyclical downturn.
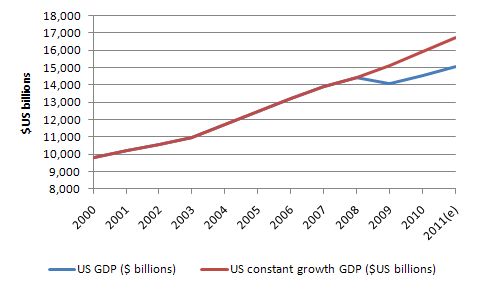
The following graph shows the nominal GDP ($US billions) from 2000 to 2011 (blue line) and the “constant growth” GDP based on my own calculations which took the average growth from 2000 to 2008 (the last peak) of 5.1 per cent and taking 2009 onwards out at this rate. So what if there not been a global financial crisis and the US economy just kept on keeping on?
Now think about what outlays consistent with 20.7 per cent of the simulated GDP would amount to in 2011. The 20.7 proportion was the 2008 figure for US federal outlays.
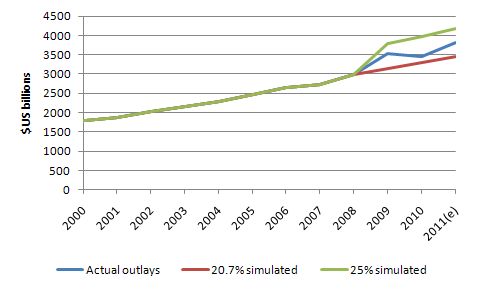
The next graph extrapolates three spending scenarios which share a common path from 2000 to 2008 and then deviate according to the different assumptions made. The blue is actual US federal spending ($US billions) from 2000 to 2011.
The red line shows what would have happened if the US economy grew at the average rate for 2000-2008 in 2009, 2010 and 2011 and US federal outlays were the same proportion of GDP as they were in 2008 (20.7 per cent).
The green line shows what would have happened if US GDP maintained the average 2000-2008 growth and spending was at its current ratio (25 per cent).
In 2010, for example, total federal outlays were $US3,492 billion and if GDP had have maintained constant growth and the 20.7 proportion was maintained then spending would have been $US3,291 billion.
That difference does not represent a blow out in discretionary spending in good times.
In fact the average since 1970 has been 20.9 percent. In that case, 2010 spending would have been $US3,322 billion at a 20.7 per cent ratio of the higher GDP.
Another way of thinking about this is to go back to the forward estimates provided by the CBO prior to the onset of the crisis as a guide to what the spending and revenue settings would be in the absence of the crisis.
As late as early 2008, the CBO forecast the budget deficit would be 1.4 per cent of GDP. It was in fact 3.2 per cent and then rose to 10 per cent in 2009. There was no brain-snap on behalf of the US government. They were facing a crisis that could have destroyed the World’s financial system and caused a dramatic rise in unemployment and poverty. As it is the rise in unemployment is terrible.
The second article was written by one David Llewellyn-Smith who is an Australian writer and claims to be on the progressive side of the debate.
The article initially discusses the mis-behaviour of the Wall Street financial conglomerates – “Wall Street took the plain vanilla process of securitisation, twisted and stretched it, to produce a batch of ruinous financial instruments: securitisations of securitisations, which bore no resemblance to the goals and form of their constituent parts”.
He talks about “greed, housing bubbles and global imbalances” and the “sophistication and scale of clever money embedded in shadow banking” as characteristics of the “GFC boom and bust cycle”.
His thesis is that governments “have established to determine the value of money” but that in the lead up to the GFC, the Wall Street bankers “seized control of those rules and in doing so, made untold wealth”.
This led to “giant asset bubbles” which “simply burst” and “the whole collateralised house of cards fell in on itself”.
He supported the US government fiscal intervention – they “had no choice” – and if they had not done so and propped up the financial system there would have been a “complete collapse in the rules that constitute money”.
He doesn’t actually outline what these “rules” are.
But his intent in the article is to relate this to the rise in public debt in the US and provide input into the debt ceiling debate.
He considers the debate is about:
… the same ghostly lineaments that defined the actions of Wall Street in the years that they seized power. The debt-ceiling debate is about power and abusing the rules of money to get it.
And that “the Obama administration” has offered a range of budget deficit cutting concessions to the Republicans “to resolve the impasse”. A list was provided.
He concludes that:
The sticking point for Republicans is that they simply will not raise taxes to help close the very deficit they so despise. Even though tax rates are at historically record lows as a percentage of GDP.
This writer understands the need for a balanced Budget to keep the rules of value intact. But, I also know a bald-faced grab for power when I see one.
I agree with him that the Republicans (funded by the Wall Street bankers) are playing an ideological game in the US and haven’t much idea of the economics that are involved. They are infested with evangelistic ideas which curiously divorce them in an empathetic way from the most disadvantaged citizens in their nation (the poor and unemployed).
But I also don’t consider the writer has much idea of the economics involved either. His statement that “a balanced Budget” is required “to keep the rules of value intact” (that is, maintain value in the US currency) is an extraordinarily mistaken thing to say. The fact that he didn’t even consider it worth debating is even more extraordinary.
The value of the US dollar is determined by what can be purchased with it. A rising price level relative to real GDP decreases the value of the currency. A real exchange rate depreciation also reduces the value of the currency in terms of foreign goods because it alters the real terms of trade – an American can buy less imported things per $US dollar of export.
But there is no credible research evidence that suggests that budget balances are related to either event – rising inflation or real exchange rate depreciations.
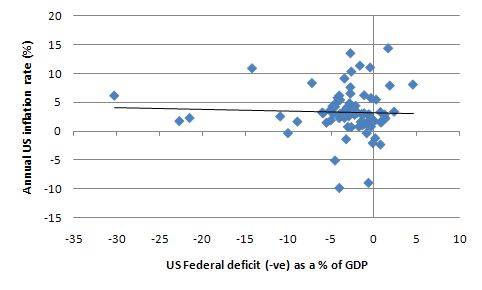
Consider the following graph which uses OMB data and CPI data from the US Bureau of Labor Statistics from 1930 to 2011. It shows on the x-axis the US federal budget deficits as a per cent of GDP (negative is a deficit) and the annual inflation rate in the US on the vertical axis. The black line is a linear regression relation between the two time series – which indicates no relationship at all (effectively flat).
The picture doesn’t alter much if you use lagged inflation rates (1-year, 2-year) to capture “build-up” effects of past budgets on price inflation. There is no significant relation at all.
I also note that since 1930 there have been federal budget deficits 85 per cent of the time in the US and as my friend Randy Wray points out:
… since the founding of our nation, the federal government has spent “more money than we take in” virtually every year. And the few times that we have spent less money “than we take in”, the economy tanked.
There has not been a secular trend towards inflation and the destruction of the value of the US dollar over that period.
The point is that budget deficits might be inflationary if they push the nominal aggregate demand in the economy beyond the real capacity of the economy to respond by increasing real output. Under certain conditions – which are definitely in place at present – a rising budget deficit will not be inflationary.
And for the unemployed a rising budget deficit will provide them with enhanced real capacity to consume because jobs will become more plentiful.
It is true that the pursuit of budget surpluses at present will probably be deflationary (therefore increasing the value of the currency). But that doesn’t imply that budget deficits do the opposite. The irony of-course is that fiscal austerity will increase the real output gap and drive up unemployment and the decline in aggregate demand leads to falling prices. But fewer people then are able to access the currency to facilitate purchases at the lower prices. Deflation is not a desirable outcome for a nation with low inflation and very high labour underutilisation.
The issue is not inflation or a loss of value in the US dollar. The major problem facing the US is that chronic output gap and concomitant high unemployment. That signals to me that the budget deficit is too small relative to the economy (which means other spending aggregates).
Conclusion
The current debt ceiling debate is destructive enough but until the experts that are providing input have an inkling of what the underlying economics is the American people will continue to be duped.
Aside – ABS Census 2011
The five-yearly Census is about to be conducted in Australia and the Australian Bureau of Statistics has released an information tool to demonstrate the importance of this data gathering exercise.
You can see it here – Census Spotlight. I liked it.
That is enough for today!

Perhaps the red in the first picture should have been brown, which would be jargon for what flows of the mouths of tee vee news economist.
I’m 100% with you here as far as this goes, but you’ve confined yourself to demand-side inflation, and said nothing about supply-side, which I see as a FAR greater threat. While I understand that in general, governments use the threat/excuse of demand-side inflation to improperly suppress the creation of needed money, the only serious inflation I’ve experienced in my lifetime (60 years) is the 70s (US, of course), and even though that was mostly supply-side, the US has operated as if it were demand-side ever since. I guess what I’m asking is, what good is it to prove that there is no demand-side pressure, if we can’t demonstrate that the pressure we do see and the REAL threat is from the supply side? I haven’t seen that MMT has anything much to say about that, and if not, it’s a serious gap IMHO.
[But I would also note that I haven’t seen that ANYONE has much to say about that. I suspect that’s because the rich really wish we’d all pretend that their huge piles of money don’t have any negative macro impacts or potentials.]
Benedict,
I would treat a supply side signal as an incentive for the economy to substitute away. We should avoid any insitutional indexing of wages and pensions to CPI which can lead to positive feedbacks. They are the problem, not the price signal. In absence of those, a supply side price spike should lead to substitution and innovation and die away in time.
fwiw.
@ Benedict @ Large
I agree that MMT needs to be much more explicit and vocal regarding supply side inflation if we are to gain inroads with the people concerned with this, like the environmentalists. I sometimes comment on their blogs and it would be useful to have more MMT references on this to cite. This is going to be becoming an increasingly pressing problem going forward, especially as abundant cheap energy dwindles and there is increasing pressure on global food supply.
@ Benedict @ Large
The NEP blog today may help:
http://neweconomicperspectives.blogspot.com/2011/07/two-theories-of-prices.html
Bill: excellent piece. All those who claim some tremendous “structural” change that has somehow changed the shape of our economy so as to generate “unsustainable” structural deficits remind me of the Real Business Cycle folks who claim every downturn is due to some technology shock. Those technology shocks are supposedly huge, but never noticed in the press–as Mankiw famously noted. There have been no major structural changes since Clinton and no major changes to the budget. So–deficit hysterians–how did an economy that generated massive budget surpluses under Clinton with only moderate growth suddenly become an economy that will generate massive budget deficits even should our economy recover? Bill proves they are wrong. Our tax and spending system are still biased toward austerity. LRWray
Bill –
Apparently Scott F. (UM-KC) and Scott Sumner have been battling about MMT and his economic ideas. Scott S. seems to be looking for:
“I’m still looking for the MMT model of different trend rates of inflation; 5%, 10%, 20%, 40%, 80%, etc, in different countries. And I’m not seeing anyone present such a model.”
I follow your blog daily and can’t readily recall a blog post on this specific issue.
As I understand it, supply side inflation can really only be offset by implementing political / social policy to allocate resources according to perceived needs eg the winter fuel allowance for pensioners in the UK, food stamps for the less well off in the US etc. The alternative is to develop substitutes where possible eg wind energy to reduce demand for fossil fuels, grow more apples to reduce demand for bananas etc. Have I got this right?
@ Benedict@Large
Agreed. I have been doing some thinking about supply side (cost-push) inflation recently as well. The bottom line is that it is not a “monetary problem” (as most are likely to attribute it to), but rather a (fiscal) policy failure. Here are a few thoughts:
http://caps.fool.com/Blogs/the-danger-is-from-the/620224#comment620307
all is not lost….yet
http://www.eurekalert.org/pub_releases/2011-07/rpi-mrs072511.php
Supply side inflation is really demand side inflation from entities your domestic policies can’t affect.
Raising interest rates in Washington or London is unlikely to directly affect the demand for oil in China. (In fact its likely to make it worse as imports into the US and UK would likely increase if the rise affects the exchange rates).
As the world’s financial resources tighten up during this century we’re going to have to get better at doling out the pain.
“I’m still looking for the MMT model of different trend rates of inflation; 5%, 10%, 20%, 40%, 80%, etc, in different countries. And I’m not seeing anyone present such a mode”
Why would you have trend rates of inflation that high? And what has that got to do with the price of fish anyway?
Just because Scott S asks for something doesn’t mean it has to be provided. What he needs to state is what relevance that has to a real world country that is targeting stable prices and stable employment levels via a flexible exchange rate.
@ Ron T. on this thread.
Were you the caller “Ron” who made the valiant attempt, on MnPR’s Eichten program this morning, to explain that reducing the issuance of government securities (via MMT procedures) would increase bond prices (i.e. depress rates)…and who was summarily blown off by Eichten and his un-listening guest as being “mixed up, as all economists would agree” because rates will climb because USTs are on the cusp of losing their AAA?
LR
Lee Rosin,
No, that wasn’t me.
@ 7:07. Thanks Ron. I’m not stalking you, but I wanted to check since I have seen your commentary in a lot of places with the Mpls notation attached. I have been thinking that it would be good to somehow assemble a little caucus of MMT afficionados here to share thoughts/wallow in the misery of the overlooked/channel outrage/diffuse anger. I suppose we could paint ourselves purple or something as an identifier…oh wait, that won’t work in Minnesota.
RG and Neil
First, there’s Eric’s post at the KC blog on this. Bill also has some good posts on inflation.
But more important are the following
a. As Neil says, just because someone asks for such a theory doesn’t mean it’s worth providing him with it (though we generally have, as I noted)
b. He asks for such a theory using a tone suggesting that our description of the monetary system is somehow invalid without out it. Complete rubbish.
c. His own theory of all of this–monetary base growth–is completely inapplicable to the real world. Hypocrisy then to evaluate us on whether or not we have a competing theory.
d. I already provided an explanation for the more abstract MMT view on this issue in my post and in comments to it.
I do agree that some type of policy paper on supply side, cost push inflation, specifically energy would possibly get a wide reading and provoke some wider discussions. Bill did a v.good post a while back on the 70s energy crises and the redistributional struggles involved in that period.
The environmental folks should be MMT allies in that the private sector is woefully behind on alternative energy investment and the government needs to step up to fill that gap. But they need a coherent counter to the deficit hysteria. But also I think there is an unstated fear that any increase in economic activity will necessarily lead to increased energy consumption, so there is a tendency for environmentalists to be “real austerians” and don’t distinguish that from financial austerity.