I started my undergraduate studies in economics in the late 1970s after starting out as…
Low pay workers dudded again in Australia
On Friday (June 3, 2011) Fair Work Australia which is the body that formally sets the minimum wage in Australia handed down its Annual Wage Review 2010-11 decision. The Minimum Wage Panel of FWA released its second Annual Wage Review under the Fair Work Act 2009 and awarded minimum wage workers an additional $19.40 per week which amounted to a 3.5 per cent rise. With inflation running around the same rate or higher, the decision fails to provide for a real wage increase especially given productivity growth is running at around 1.5 per cent at present. The decision will apply over from July 1, 2011 to June 30, 2012. The decision further cements the real wage losses that low-paid workers have endured over the decade and is not sufficient to arrest the deterioration of low-pay outcomes relative to average earnings in the economy.
Fair Work Australia conducts formal hearings via public consultations across Australia and accepts formal submissions from interested parties which include unions, government and the business sector.
There is a panel that is “required to conduct an annual review of minimum wages in modern awards and to make a national minimum wage order.”
The annual decision become operational on July 1 (next financial year after the decision) and must be consistent with the so-called “minimum wages objective” that is set out in Section 284(1) of the Fair Work Act 2009.
The objective is as follows:
284 The minimum wages objective
What is the minimum wages objective?
(1) FWA must establish and maintain a safety net of fair minimum wages, taking into account:
(a) the performance and competitiveness of the national economy, including productivity, business competitiveness and viability, inflation and employment growth; and(b) promoting social inclusion through increased workforce participation; and
(c) relative living standards and the needs of the low paid; and
(d) the principle of equal remuneration for work of equal or comparable value; and
(e) providing a comprehensive range of fair minimum wages to junior employees, employees to whom training arrangements apply and employees with a disability.
These guidelines were introduced when the current Labor government took office in 2007 and abandoned the short-lived Fair Pay Commission which the conservatives had put in place to usurp the power of the Australian Industrial Relations Commission in setting the minimum wage. The FPC was a real wage cutting institution which was faithful to it conservative remit.
Please read my blog – Federal minimum wage increase not generous enough – for a discussion of the last decision by FWA (June 3, 2010) which contains some of this history.
FWA was meant to replace the “real wage cutting” bias of the FPC and restore some equity into the wage setting process. In that context the broader minimum wage guidelines were a considerable improvement and introduced considerations of equity (relative living standards, social inclusion, equal pay for equal work etc into the decision making environment.
But the performance of FWA – now having handed down its second minimum wage decision – is less than acceptable.
I have had a long involvement over my career in the setting of minimum wages in Australia and have often provided consulting reports to the unions and appeared as an expert witness to the AIRC.
In terms of minimum wage setting my view is simple. I would not have a “capacity to pay” guideline in the set of principles upon which the minimum wage is set. I would ignore cyclical patterns when considering what the level of the minimum wage should be.
Instead, I see the minimum wage as a statement of how sophisticated you consider your nation to be or aspire to be. Minimum wages define the lowest standard of wage income that you want to tolerate. In any country it should be the lowest wage you consider acceptable for business to operate at. Capacity to pay considerations then have to be conditioned by these social objectives.
If small businesses or any businesses for that matter consider they do not have the “capacity to pay” that wage, then a sophisticated society will say that these businesses are not suitable to operate in their economy. Such firms would have to restructure by investment to raise their productivity levels sufficient to have the capacity to pay or disappear.
This approach establishes a dynamic efficiency whereby the economy is continually pushing productivity growth forward and in tat context material standards of living rise.
I consider that no worker should be paid below what is considered the lowest tolerable standard of living just because low wage-low productivity operator wants to produce in a country.
On Pages 86-87 of the Decision we read that:
[333] In the 12 months since the last review, Australia’s economy has continued to perform strongly despite the impact of the recent floods and Cyclone Yasi which detracted from GDP growth. Production should recover, creating stimulus for GDP growth in the June and September quarters. Earnings and employment continued to grow and, despite increases in headline inflation, underlying inflation is currently at an acceptable level, although forecast to gradually increase over the next two years. The forecasts for 2011-12 and 2012-13 suggest that Australia’s immediate overall outlook is positive, although not all sectors are doing equally well and there are some risks to the international economy.
[334] The economy is performing reasonably well, labour productivity is growing, the profit share remains at historically high levels and underlying inflation is well within the RBA’s medium-term target band. Employment is growing, unemployment is reducing and labour force participation remains high. In the circumstances a significant increase is appropriate which will improve the real value of award wages and assist the living standards of the low paid. For the reasons discussed … we have adopted a uniform percentage increase. The increase in modern award minimum wages we have decided on is 3.4 per cent. Weekly wages will be rounded to the nearest 10 cents.
[335] … The national minimum wage will be $589.30 per week or $15.51 per hour … This constitutes an increase of $19.40 per week or 51 cents per hour.
So FWA awarded a 3.5 per cent increase or $A19.40 per week for Federal Minimum Wage recipients. How does that stack up?
The ABC News ran the story (June 3, 2011) that – Unions say wage increase not enough.
I agree with that assessment.
The report said that:
Workers on the minimum wage have been handed a modest wage increase of $19.40 a week … Today’s 3.4 per cent increase to the minimum wage has been criticised by unions, who say it barely keeps up with the rising cost of living and does little to close the gap between low-paid workers and the rest of the workforce.
There is a considerable dysjunction between this decision and the other narratives that are being spun out at present in relation to the economy.
We are entering a period of fiscal austerity despite there being 12 per cent underutilised labour resources (sum of unemployment and underemployment) because the Government claims we are on the brink of an inflationary surge as a result of the so-called “once-in-a-hundred-year” mining boom.
According to this narrative, business profits are high, business investment is high and growth will be rocketing ahead.
Of-course the reality is somewhat different – not only has employment growth stalled but last week the National Accounts showed a staggeringly large contraction in the national economy. The boom-narrative has dismissed that result as being temporary and due to the natural disasters (floods and cyclone) earlier this year.
There are 1.4 million workers in Australia (total employment is 11.4 million) who rely on the minimum wage.
As usual there were disparate claims made by unions, social service organisations and employers. The unions wanted a rise of $28 per week which would have, at least kept real minimum wages constant (at the point of adjustment but not in between the adjustment cycles).
The employers declared they would tolerate $9.50 per week increase (Australian Chamber of Commerce and Industry submission) so once again demanding a significant real wage cut for the bottom end of the labour market.
Sometimes the dishonesty of journalists who are trying to squeeze a point is so patent that it makes me laugh.
Consider this article on June 4, 2011 in the News Limited rag – The Australian – Wage rise threatens to push up interest rates – by the economics editor Michael Stutchbury. He has led the charge against the fiscal stimulus and his recent line has been that the alleged “once-in-a-hundred-year” mining boom that he continually reminds us is threatening to blow the lid of inflation and so government has to push to surplus now.
His other line of argument has been that with inflation about to explode because of the boom, any budget deficit will provoke the Reserve Bank into pushing up interest rates more quickly than otherwise.
So boom, boom, boom!
After Fair Work Australia put up the minimum wage by a pitiful 3.4 per cent last Friday (June 3, 2011) his line has become:
THE biggest slump in national output since Paul Keating’s early 1990s recession seems an awkward time to be contemplating a hefty across-the-board wage rise or higher interest rates.
So Michael has the boom evaporated? In which case, we probably need a greater fiscal stimulus, no?
Soon after in the article, Stutchbury was once again promoting the boom argument but with a twist. He said:
The risk that mining boom wage pressures spill over into the wider job market already worries Reserve Bank of Australia governor Glenn Stevens. So Giudice’s centralised award wage rise will encourage the Reserve Bank to lift its official interest rate to prevent inflation breaking up through its 2 per cent to 3 per cent target zone.
The RBA will not increase interest rates next month given last week’s National Accounts data.
The increase in the Federal Minimum wage from July 1, 2011 will not add any pressures to the price level given how far behind labour productivity growth the FMW has been. See my analysis later.
I agree with Stutchbury though that there is a dislocation between the policy-setting institutions in Australia. He notes that the central bank has its own agenda which does not include pay equity. The RBA has been sabotaging growth and employment for years now as it follows its so-called “independent” inflation-first monetary policy agenda.
It would be far better to abandon the pretense of an “independent” central bank and incorporate all macroeconomic policy setting within the realm of the democratically elected government.
But in terms of federal minimum wages I do not consider them to be an “economic” concept. I explain that below.
Parity
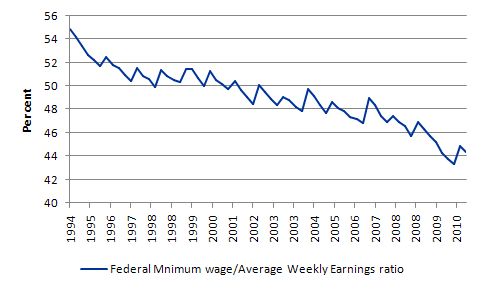
In terms of parities with other wage earners, the following graph shows the ratio of the Federal minimum wage to the Full Time Adult Ordinary time earnings series provided by the ABS (the latest being for the first quarter 2011).
I simulated this series out to June 2012 (the date of the next FWA Annual Wage decision) based on a constant growth in earnings (assessed over the last 12 months). The new FMW applies from July 1, 2011 so will be constant over the rest of the 2011-12 financial year.
The logic of the neo-liberal period which encompasses the data sample shown (and then some) was to cut at the bottom of the labour market.
Last Friday’s FWA decision, despite all the rhetoric to the contrary, continues that trend and forces workers at the bottom of the wage distribution to fall further behind in relative terms.
In 1993, minimum wage workers earned around 55 per cent of the Full Time Adult Ordinary time earnings. By June 2012, I estimate that this ratio will have fallen to 43.5 per cent. There has been a serious erosion of parity over the last 18 years.
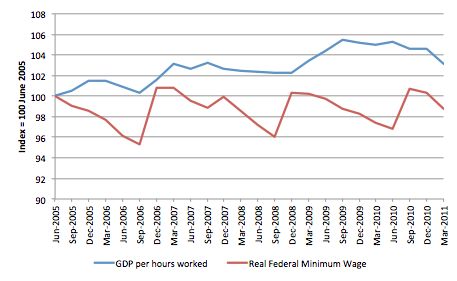
Another way of looking at this dismal outcome is to compare the movement in the federal minimum wage with growth in GDP per hour worked (which is taken from the National Accounts). GDP per hour worked is a measure of labour productivity and tells us about the contribution by workers to production.
Labour productivity growth provides the scope for non-inflationary real wages growth and historically workers have been able to enjoy rising material standards of living because the wage tribunals have awarded growth in nominal wages in proportion with labour productivity growth.
That relationship has been severely disrupted by the neo-liberal attacks on unions, wage fixing tribunals and other legislative initiatives that have eroded the capacity of workers to share in labour productivity growth.
The widening gap between wages growth and labour productivity growth has been a world trend (especially in Anglo countries) and I document the consequences of it in this blog – The origins of the economic crisis.
But the attack on living standards has been accentuated at the bottom end of the labour market. The following graph shows the evolution of the real Federal Minimum Wage (red line) and GDP per hour worked (blue line) since June 2005 up until March 2011 (indexed at 100 in June 2005).
By March 2011, the respective index numbers were 103.1 (GDP per hour worked) and 98.8 (real FMW).
Staggered wage decisions and real wages
An annual adjustment cycle without indexation means that minimum wage workers have to endure systematic cuts in their real wages more than they would if the adjustments were indexed through the year after an annual review decision.
With inflation being a continuous process (more or less), the annual adjustments by Fair Work Australia hand employers huge gains and deprive the workers of real income. The following discussion and diagram explain why.
Assume that at the time of policy implementation, the real FMW wage was wi and there was no inflation. The wage setting authority (in this case Fair Work Australia) manipulates a nominal minimum wage (the $ weekly value) and the real wage equivalent of this nominal wage is found by dividing the nominal wage by the inflation rate. Assume that inflation assumes a positive constant rate at Point 0 onwards.
The nominal wage is the $-value of your weekly wage whereas the real wage equivalent is the quantity of real goods and services that you can purchase with that nominal wage. For a given nominal wage, if prices rise then the real wage equivalent falls because goods and services are becoming more expensive.
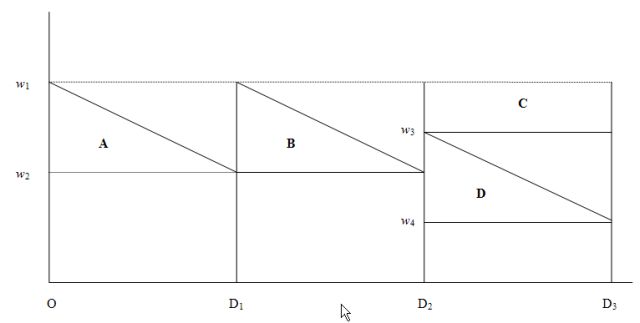
The following diagram depicts the real income losses that arise when indexation is not continuous, that is, when the AFPC makes, say, an annual adjustment in the FMW (you may want to click it to get it in a new window so you can print it while you follow the description):
Over the period O-D1 the inflation rate continuously erodes the real value of the nominal wage and immediately before the next indexation decision, the real wage equivalent of the fixed nominal FMW is w2. The real income loss is computed as the area A, which is half the distance (0-D1) times distance (w1-w2).
At point D1 the wage setting authority increases the nominal wage to match the current inflation rate which restores the real wage to w1, but the workers do not recoup the deadweight real income losses equivalent to area A.
The same process occurs in the period between the D1 and the next decision D2, resulting in further real income losses equivalent to area B. These losses are cumulative and are greater: (a) the higher is the inflation rate; (b) the longer is the period between decisions; and (c) the higher is the real interest rate (reflecting the opportunity cost over time).
Clearly, the patterns of real income loss are different if the wage setting authority adopts a decision rule other than full indexation (that is, real wage maintenance). For example, say it decides not to adjust nominal wages fully at the time of its decision (or in fact at the implementation date of its decision) to the current inflation rate then the real income losses increase, other things equal.
So at time D1 the authority decides to discount the real wage (less than full indexation) and increases the nominal wage rate such that the real wage at that point is equal to w3.
Over the next period to D3, the real wage falls to w4 and at the time of the next decision (implementation time D3) the real income losses would be equal to the triangle D (reflecting the inflation effect over the period D2- D3, plus the rectangle C, which reflects the losses arising from the decision to partially index at D2.
Similarly, one can imagine that the adjustment at a particular time might involve a real wage increase (more than full compensation for the current inflation rate) which would then partially offset some of the real income loss borne in the previous period when nominal wages were unadjusted but inflation was positive.
So if you understand the saw tooth pattern of indexation shown here you will see that the triangles A and B represent real losses for the workers between wage setting points even if real wage maintenance is the preferred policy. These losses are worse (areas C and D) if there is only partial adjustment. These losses occur because inflation is a more continuous process than the adjustments in FMW and accrue to the employer. The employers are pocketing these wage losses every day because their revenue is geared to the price rises and they are paying constant nominal wages to the workers.
Staggered adjustments in the real world
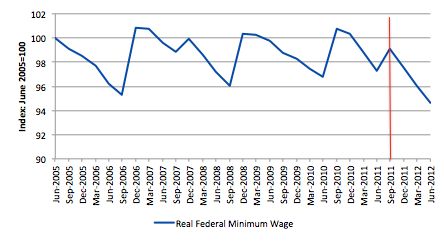
The following graph shows the evolution of the real Federal Minimum Wage (FMW) since July 2005 extrapolated out to June 2012 (the date of the next FWA Annual Review decision) based on a constant (current) inflation rate. You can see the saw-tooth pattern that the theoretical discussion above describes.
Each period that curve heads downwards the real value of the FMW is being eroded. Each of the peaks represents a formal wage decision by the wage setting tribunal (now Fair Work Australia).
When the workers get the pay rise on July 1, 2011 their real wage equivalent of the nominal FMW will be significantly reduced on its level one year ago. Compared to five years ago, the real wage is now much lower (around 1 per cent) and over the next twelve months it will be more than 4.5 per cent lower on its 2005 level.
So while each adjustment provides some real wage gain for workers the duration between the wage determination decisions means that their purchasing power is being cut significantly – these are permanent losses.
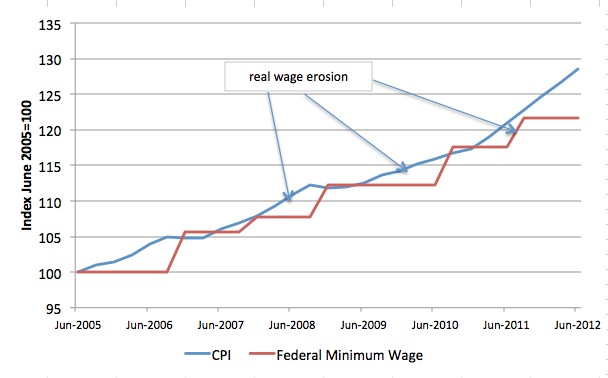
The next graph shows the erosion of the real wage more clearly. The red line is the inflation index and the blue line the nominal Federal Minimum Wage index (June 2005=100). The saw-tooth gaps between the red and blue lines indicate permanent real wage losses.
You can see than in past decisions, the FMW has caught up with the CPI whereas in the current decision that has not been the case.
As an aside, the CPI is also a very limited measure of the cost of living. In May 2011, the ABS published their – Analytical Living Cost Indexes for Selected Australian Household Types – which provided more detailed analysis of the impact of price rises on different household and worker cohorts.
Those on low pay are likely to be significantly worse off than the raw CPI figures suggest.
An interesting article on this was written by The Age economics correspondent Peter Martin on May 17, 2011 – Reckon your own personal rate of inflation’s way high?.
Minimum wages and employment
Many academic studies have sought to establish the empirical veracity of the neoclassical relationship between unemployment and real wages and to evaluate the effectiveness of active labour market program spending. This has been a particularly European and English obsession. There has been a bevy of research material coming out of the OECD itself, the European Central Bank, various national agencies such as the Centraal Planning Bureau in the Netherlands, in addition to academic studies. The overwhelming conclusion to be drawn from this literature is that there is no conclusion. These various econometric studies, which have constructed their analyses in ways that are most favourable to finding the null that the orthodox line of reasoning (that wage rises destroy jobs) is valid, provide no consensus view as Baker et al (2004) show convincingly.
In the last 10 years, partly in response to the reality that active labour market policies have not solved unemployment and have instead created problems of poverty and urban inequality, some notable shifts in perspectives are evident among those who had wholly supported (and motivated) the orthodox approach which was exemplified in the 1994 OECD Jobs Study.
In the face of the mounting criticism and empirical argument, the OECD began to back away from its hardline Jobs Study position.
In the 2004 Employment Outlook, OECD (2004: 81, 165) admitted that “the evidence of the role played by employment protection legislation on aggregate employment and unemployment remains mixed” and that the evidence supporting their Jobs Study view that high real wages cause unemployment “is somewhat fragile.”
The winds of change strengthened in the recent OECD Employment Outlook entitled Boosting Jobs and Incomes, which is based on a comprehensive econometric analysis of employment outcomes across 20 OECD countries between 1983 and 2003. The sample includes those who have adopted the Jobs Study as a policy template and those who have resisted labour market deregulation. The report provides an assessment of the Jobs Study strategy to date and reveals significant shifts in the OECD position. OECD (2006) finds that:
- There is no significant correlation between unemployment and employment protection legislation;
- The level of the minimum wage has no significant direct impact on unemployment; and
- Highly centralised wage bargaining significantly reduces unemployment.
This statement from the OECD confounds those who have relied on its previous work including the Jobs Study, to push through harsh labour market reforms, retrenched welfare entitlements and attacked the power bases on trade unions. It makes a mockery of the arguments that minimum wage increases will undermine the employment prospects of the least skilled workers.
In their decision on Friday, Fair Work Australia reiterated their conclusions laid out in the 2009-10 decision. They said:
Our attention was drawn to extensive literature and studies concerning the relationship between minimum wage rises and employment levels … The relevance of some of the studies is limited insofar as they are directed to the effects of increasing a single minimum wage in circumstances which are quite different to those which characterise the Australian industrial relations systems, including the range of minimum rates at various levels throughout the award system. Although a matter of continuing controversy, many academic studies found that increases in minimum wages have a negative relationship with employment, but there is no consensus about the strength of the relationship.
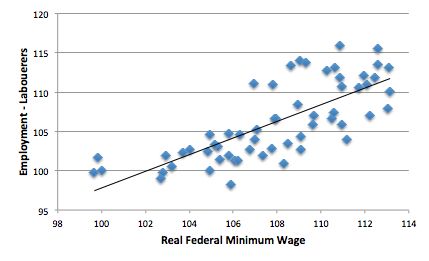
To get some idea of what the data looks like I created a scatter plot of the real federal minimum wage (indexed to 100 at September 1996) (horizontal axis) and the Employment of labourers (vertical axis). You can get employment by occupation from the ABS – HERE.
The red line is a simple regression which if anything indicates a postive relationship (higher real FMWs are associated with higher employment at the bottom end of the labour market. But when you run the regression in change form (don’t worry about what this means if you don’t know) one concludes there is no relationship.
Conclusion
While the $19.40 per week increase is welcome it is insufficient to restore the relativities at the bottom of the labour market which have been eroded over recent years. It is also significantly lower than the $26 per week awarded in the last Annual Review in June 2010 even though inflation is higher at present.
In that regard, last Friday’s decision does not redress the significant erosion of real purchasing power that low-paid workers have suffered over the last decade. I would have used the next several minimum wage decisions to ramp up the level and restore the previous relativities with the average earner and the FMWs purchasing power.
I would also note that a sophisticated society requires a decent minimum wage that is determined on the basis of what we want the floor in living standards to be. In the absence of regulation it is almost certain that the “market” would drive the wage below that level.
In such cases, the employment is not desirable and so a Job Guarantee could set the minimum alternative employment that the private employers then have to better. They need to invest and ensure productivity can support the higher wage level. Its called a win-win.
I am running early today as I have a plane to catch and will be travelling the next few days.
That is enough for today!
Then I’m glad FWA ignored your opinion!
If raising productivity is profitable, why aren’t they doing it anyway? And do you really think low paid jobs disappearing would help workers? If there are higher paid jobs available, why are those people still on minimum wage jobs?
I think governments should increase opportunities. You seem to think they should decrease them!
Equating wages with standard of living is an easy trap that many nations have fallen into, with Britain probably the most affected. But it takes no account of the cost of living nor the price of land.
So if you start graphing it a year later, the sawtooth gaps between the red and blue lines would indicate permanent real wage gains?
Dear Bill
In the Netherlands there used to be an age-related minimum wage. The highest minimum wage was the one for people over 23. I’m not sure whether it still is there. That strikes me as a good idea. one minimum wage for people under 18, one for the age bracket 18 -22 and the highest one for people who are 23 or older. I think that’s a good idea.
We might also exempt all people under 25 from pension and unemployment premiums, but make them ineligible for unemployemnt. It seems that in every country, youth unemployment is very high. Exempting people under 25 from pension and unemployment premiums might help them enter the labor market more easily. Of course, the real solution to massive unemployemnt is stimulation of aggregate demand.
Regards. James
Bill, My response is similar to Aidan above. You claim that refusing to allow employers to create jobs with an output below some minimum “…establishes a dynamic efficiency whereby the economy is continually pushing productivity growth forward…”
I suggest this “dynamic” exists anyway: i.e. since the world began, employers have worked out for themselves that they benefit from increased productivity (as does society at large).
As for employers who create very unproductive and low wage jobs when more productive jobs are EASILY created, such employers will not be able to hold on to their employees. That problem solves itself in a free market.
In contrast, where it is DIFFICULT to create more productive work, it is better (from the strictly economic point of view) to allow very low output work than forbid it. Thus as far as strictly economic matters go, I don’t see that minimum wage legislation achieves much.
The real problem comes where low wages are allowed and the state makes up take home pay to socially acceptable levels. That results in employees having no incentive to seek more productive work. One solution to that is to allow such unproductive work with regular employers, public and private, but limit the time a given employee stays with a given employer.
One advantage of something like the latter over JG is that the private sector is better at creating relatively unskilled work than the public sector. Second, the temporary or “low output” employees experience genuine work environments, rather than the “make work” environment that JG consists of. Third, the low output employees work alongside more or less normal amounts of capital equipment and skilled labour. Thus the low output labour is more productive than on JG.
While I am fully on board with minimum wage and its increases I have serious doubts that the “productivity growth” is the way to argue. I understand that one needs a somewhat objective benchmark, this one seems to be very misleading. On one hand, it is highly disputable that minimum wage workers *positively* contribute to overall economic productivity (like GDP per hour). Intuitively they would rather tend to drag the average productivity growth down. On another hand in many cases the direct contribution of minimum wage workers to conventional measures of GDP is a poor reflection of (broadly defined) value added.
Aidan;
I don’t understand your reference to the wage-price graph. No matter what year you start with, the question is whether the total area above the blue line but below the red line is greater or less than the total area above the red line but below the blue line. The minimum-wage worker is obviously chasing nominal wage / real wage parity year after year, and obviously seeing it disappear into the distance on the right-hand side of the graph.
Minimum wage is a lie! There is no minimum wage for workers under 21, so it’s a misnomer to call this a “minimum wage” since there are workers working for significantly less than this. Keep in mind they are performing exactly the same work as “minimum wage” earners.
Worker cooperatives don’t require minimum wage laws because there is no class warfare.
Dale –
The red line and the blue line are in the positions they are because Bill chose to start the graph with then together in June 2005. If he had instead chosen June 2006 as the basis of his indexing, the red line would be above the blue line nearly all the time.
bill (or anyone else), does this chart from the St. Louis FRED “titled” So, how are Americans doing? Here’s the history of the series (PRS85006173 – Nonfarm Business: Labor Share): [of national income]
http://www.ritholtz.com/blog/wp-content/uploads/2011/06/Labor-share.png
at this post:
http://www.ritholtz.com/blog/2011/06/whither-and-withering-demand/
match up with the data and/or charts you have? Thanks!
Dear Aidan (at 2011/06/06 at 23:29) and Dale
I agree that the starting point for an index matters. To resolve any doubts about the direction of the real Federal Minimum Wage in Australia (the declared nominal minimum deflated by the CPI) I provide this graph from December 1993 out to June 2012 (based on a constant inflation rate as of March quarter 2011.
The real FMW is lower now than it was 8 years ago as a result of the work of the Fair Pay Commission and then the current Fair Work Australia decisions.
best wishes
bill
Bill, I agree with some of your analysis, but it seems to me that you have glossed over the point that the 3.5 per cent increase applies to all award workers, not just those on minimum wages. Perhaps it would have been better for the FWA to award a larger dollar amount but to have made it a flat rate increase, as they did last year.
“If small businesses or any businesses for that matter consider they do not have the “capacity to pay” that wage, then a sophisticated society will say that these businesses are not suitable to operate in their economy. Such firms would have to restructure by investment to raise their productivity levels sufficient to have the capacity to pay or disappear.”
There are lots of things that are clearly beneficial but don’t make much of a commercial contribution. Recycling or even better reusing what currently goes into landfill is a good example. Another is much of scientific research especially potential research that isn’t currently funded. Currently such things are either done for free, for a state subsidy or not at all. I’d rather have a citizen’s dividend instead of welfare/job guarentee/minimum wage- then people could do such stuff and possibly get paid for it for the money it earned and that pay be extra on top of the citizens’ dividend that everyone would get any way. If someone came up with a machine or whatever that did the same work in a much more productive way- then there would be no perverse incentives not to move to that method.
Trivia about min wage:
Two years ago, Haiti unanimously passed a law sharply raising its minimum wage to 61 cents an hour. That doesn’t sound like much (and it isn’t), but it was two and a half times the then-minimum of 24 cents an hour.
This infuriated American corporations like Hanes and Levi Strauss that pay Haitians slave wages to sew their clothes. They said they would only fork over a seven-cent-an-hour increase, and they got the State Department involved. The U.S. ambassador put pressure on Haiti’s president, who duly carved out a $3 a day minimum wage for textile companies (the U.S. minimum wage, which itself is very low, works out to $58 a day).
The Nation (very recent)