I am late today because I am writing this in London after travelling the last…
Australian labour force data – some positive signs
The Australian Bureau of Statistics (ABS) released the Labour Force data today for March 2011 which sends some very positive signals unlike the mixed news we have been receiving over the last few months. Overall, my interpretation of the data is that the labour market is adding jobs and providing some modest scope to reduce the huge pool of unemployed. Full-time and part-time employment growth was positive and the participation rate rose slightly – a virtuous duet. Total hours of work rose for the month. But despite the media narrative that we are now “below” full employment. The bank economists were claiming this meant that the RBA should put interest rates up. My view is that there is a lot of slack left in the economy. A stunning aspect of this observation is that teenagers continue to suffer employment losses having lost 86 thousand jobs overall since the crisis then recovery began. The other reality is that employment growth is barely keeping pace with population growth so unemployment is hovering at high levels – at at time when we should be really eating into it. Given related data series recently, the RBA would be mad to increase the interest rate.
The summary ABS Labour Force (seasonally adjusted) estimates for March 2011 are:
- Employment increased – 37,800 (0.3 per cent) with the net gains in full-time employment of 32,100 and part-time employment of 5,700.
- Unemployment decreased 10,200 to 592,900.
- The official unemployment rate fell by -0.1 points to 4.9 per cent.
- The participation rate increased by 0.1 percentage points to 65.8 per cent reversing the fall last month of the same proportion.
- Aggregate monthly hours worked increased 13.1 million hours (0.8 per cent).
- The quarterly labour underutilisation estimates will next be published in May. In February, underemployment was easing and stood at 6.9 per cent and the further growth in full-time employment in March suggests that modest downward trend will continue. Total labour underutilisation (computed by the ABS as the sum of underemployment and unemployment) was estimated to be 11.9 per cent in February. I expect it to be slightly lower now.
Overall, today’s data release was good news and tells us that the Australian economy is growing although not as strongly as many claim it to be.
The ABC news report today (April 7, 20110 carried the headline – Unemployment at a two-year low – which is true but not the point that I would have emphasised.
One bank economist quoted by the ABC news report claimed the “figures are strong across the board”. No they are not (see below with respect to teenagers).
Another ABC feature today – a lunchtime interview with some bank economist and it was claimed that the unemployment rate was now below “what economists call full employment”. As you will see the situation hides some very disturbing trends, particularly with respect to teenager labour market outcomes. The reality is that we are not close to full employment at this point in the cycle.
The ABC news report, however, did offer some respite however from the strong growth message most commentators are providing. The quoted one bank economist who noted that the employment growth is not keeping up with population growth. That is largely true (depending on which time span you measure it over – see below for more analysis).
Another bank economist quoted by the ABC also noted that “In the context of the past few months, there’s still a clear slowdown, though the intensity of that slowdown (particularly excluding Queensland) has moderated”. I largely agree with that assessment.
There are also broader indicators that suggest the Australian economy is not growing as robustly as the politicians would have us believe. For example, the ABC reported today that the economy is enduring the – Biggest construction slump in two years.
The Housing Finance data for February 2011 released by the ABS yesterday (April 6, 2011) showed a dramatic drop in commitments to housing finance.
The ABC report said that:
The rate of contraction in house building slowed, but the sector was still shrinking in March
The construction industry has suffered its biggest contraction in two years in March, with steep falls in activity, new orders and employment.
A major survey of the sector found that “construction businesses are experiencing low levels of incoming work, a shortage of tender opportunities and low buyer confidence” while “employment levels in the sector continued to fall”.
The combination of interest rate rises and the withdrawal of the fiscal stimulus is driving this contraction. The survey shows there is plenty of excess capacity in this sector alone – despite many tradespersons being diverted to Queensland as part of the flood reconstruction effort.
Even in the mining boom-state of Western Australia there are some disturbing reports of poor growth.
The ABC reported yesterday (April 6, 2011) that Western Australia has recently been in a “technical recession”. Western Australia is the state where our so-called “once-in-a-hundred-years” mining boom is playing out? It has been held out as the growth engine state of the Australian economy?
What needs to be understood is that the Mining industry is expert at self-promotion and making a contribution to real GDP of around 5 per cent look 10 times that.
While this report is compromised somewhat by measurement issues it remains that domestic demand (excluding exports) went backwards in the last two quarters of 2010 in Western Australia – which indicates that while exports might be growing, the other sectors of the economy are not.
The data clearly tells us that the Australian economy is nowhere near full employment nor about to run against the inflation barrier.
Employment growth positive
The March data shows that employment growth (0.3 per cent) rebounded from the negative result from February and ends three relatively poor months since December 2010. However, last month I had some optimism given the strength of full-time employment growth which continued (at a slower pace) in March (up 0.4 per cent). Unlike last month, the sharp decline in part-time employment was reversed with some modest growth (0.2 per cent).
With participation up slightly, the fall in the unemployment rate was less than the employment growth suggested. But when you get positive employment growth and rising participation it is a good sign. More later on the participation effect.
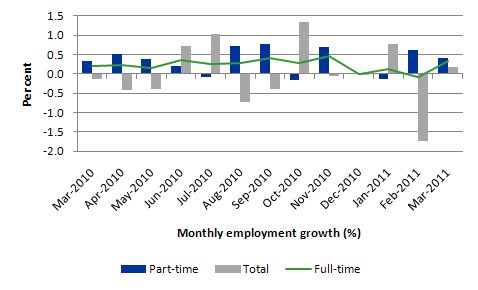
The following graph shows the month by month growth in full-time (blue columns), part-time (grey columns) and total employment (green line) for the 12 months to March 2011 using seasonally adjusted data. It is clear that the picture has been mixed over the last 12 months with employment growth averaging 0.2 points per month (full-time 0.3 points; part-time 0.0 points).
While full-time and part-time employment growth are fluctuating around the zero line, total employment growth is still well below the fiscal-stimulus boosted growth we saw in the middle of 2010.
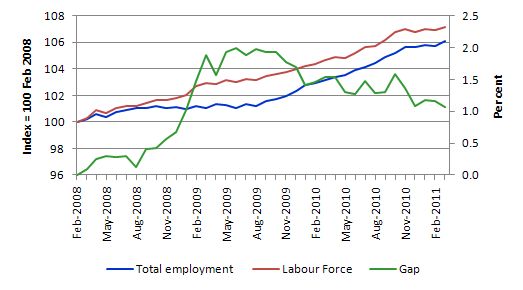
To put the recent data in perspective, the following graph shows the movement in the labour force and total employment since the low-point unemployment rate month in the last cycle (February 2008) to March 2011. The two series are indexed to 100 at that month. The green line (right-axis) is the gap (plotted against the right-axis) between the two aggregates and measures the change in the unemployment rate since the low-point of the last cycle (when it stood at 4 per cent).
The Gap series gives you a good impression of the asymmetry in unemployment rate responses even when the economy experiences a mild downturn (such as the case in Australia). The unemployment rate jumps quickly but declines slowly.
It also highlights the fact that the recovery is still not strong enough to bring the unemployment rate back down to its pre-crisis low. You can see clearly that the unemployment rate fell in late 2009 and very little improvement has been made in the course of this year.
After some months of being stuck in a period of weak growth, the Australian labour market showed signs in March of pushing unemployment down another notch.
Negative employment growth for teenagers continues
While the aggregates are sending good signals, when you dig below the surface not all is what it seems.
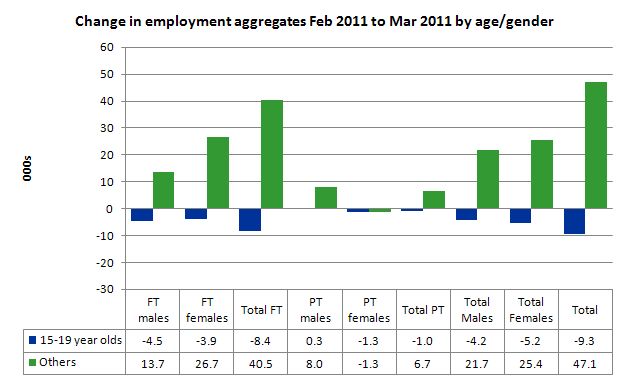
The evidence continues to show that the Australian labour market continues to exclude teenagers (15-19 year olds) from the employment growth. Teenage employment growth in the last month was negative losing 9,300 jobs (net) and that has been a continuing trend over the last few years.
While the rest of the workforce enjoyed full-time and part-time jobs growth, teenagers lost 8.4 net full-time employment jobs and 1.3 thousand part-time jobs.
At a time when we keep emphasising the future challenges facing the nation in terms of an ageing population and rising dependency ratios the economy still fails to provide enough work (and on-the-job experience) for our teenagers who are our future workforce.
The following graph shows the distribution of net employment creation in the last month by full-time/part-time status and age/gender category (15-19 year olds and the rest).
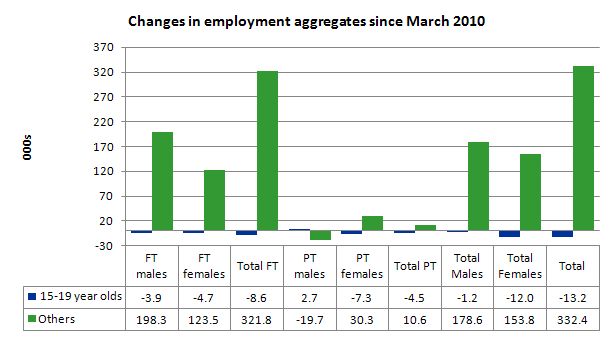
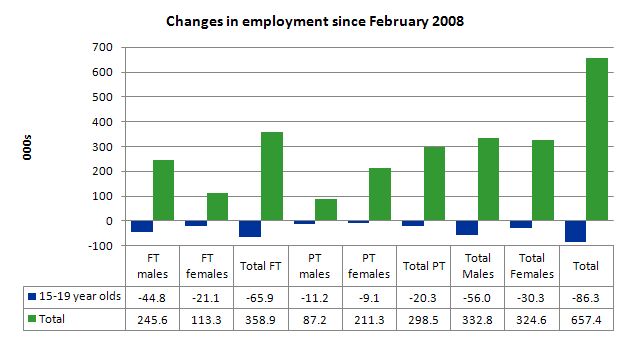
To put this month’s figures in perspective though, the following graph shows the change in aggregates over the last 12 months. Teenagers have gone backwards in this so-called period of recovery – the jobs market has been shrinking for them.
To further emphasise the plight of our teenagers I compiled the following graph that extends the time period from the February 2008, which was the month when the unemployment rate was at its low point in the last cycle, to the present month (March 2011). So it includes the period of downturn and then the “recovery” period. Note the change in vertical scale compared to the previous two graphs. That tells you something!
The results are stunning really. Teenagers have lost 66 thousand full-time jobs, 20 thousand part-time jobs and 86 thousand jobs overall in that time. The comparison with the rest of the employed labour force is staggering.
There is nothing good that you can say about any of that. It makes a mockery of those (like the bank economists and our politicians) who claim we are close to full employment. An economy that excludes its active teenagers from any employment growth at all is not one that is using its existing capacity to its potential. An economy that sheds 86 thousand jobs that were formerly held by teenagers (including 66 full-time jobs) is no-where near full employment.
The longer-run consequences of this teenage “lock out” will be very damaging.
In the February quarter broad labour underutilisation data released by the ABS, the underemployment rate for 15-24 year olds was 12.8 per cent (a slight decrease from the November quarter). Total labour underutilisation for 15-24 year olds was 24.6 per cent.
So that should be a headline in the news today and tomorrow – 24.6 per cent of our 15-24 year olds (who are seeking work) but are idle at present (sum of unemployment and underemployment). That is an indictment of government policy and represents a lot of excess capacity that can be tapped via the creation of appropriate job/training slots.
At present, my summary is that the recovery that is occurring in the Australian economy is not providing any significant opportunities for our youngest workers. These workers are our future. We talk of the intergenerational demands on public spending and rising dependency ratios. But then we allow 25 odd percent of our active youth to remain idle and outside the skill development process. This waste ensures our future productivity growth will be lower than it otherwise could be.
How can we be happy about an economy that shuts out our youth from the recovery?
Unemployment
The unemployment rate fell by 0.1 points in March to 4.9 per cent. This outcome reflects the happy combination of rising employment and rising participation. As I show later the fall in the unemployment rate would have been larger if the if the participation rate had not risen.
But before we start believing the media spin that we are now “below full employment” remember that in February 2008, at the low-point of the last cycle the unemployment rate was 3.9 per cent and falling. The idea that full employment is equated with a 5 per cent unemployment rate is just an ad hoc myth propagated by mainstream economists using flawed econometric models.
Overall, the labour market still has significant excess capacity available in most areas.
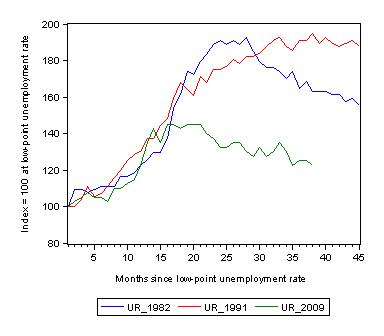
The following graph updates my 3-recessions graph which depicts how quickly the unemployment rose in Australia during each of the three major recessions in recent history: 1982, 1991 and 2009 (the latter to capture the 2008-2010 episode). The unemployment rate was indexed at 100 at its lowest rate before the recession in each case (June 1981; November 1989; February 2008, respectively) and then indexed to that base for each of the months as the recession unfolded.
I have plotted the 3 episodes for 45 months after the low-point unemployment rate was reached (although the current episode has only endured for 38 months). For 1991, the end-point shown is the peak unemployment which was achieved some 38 months after the downturn began although the recovery was painfully slow. While the 1982 recession was severe the economy and the labour market was recovering by the 26th month. The pace of recovery for the 1982 once it began was faster than the recovery in the current period.
It is significant that the current situation while significantly less severe than the previous recessions is dragging on which is a reflection of the lack of private spending growth and declining public spending growth.
The graph provides a graphical depiction of the speed at which the recession unfolded (which tells you something about each episode) and the length of time that the labour market deteriorated (expressed in terms of the unemployment rate).
From the start of the downturn to the 38-month point (to March 2011), the official unemployment rate has risen from a base index value of 100 to a value 122.5 – peaking at 145 after 21 months. At the same stage in 1991 the rise was 194 (which was its peak) and in 1982 – 162 (and falling in spurts).
The trend in unemployment at present is slightly downward (in spurts).
Aggregate participation rate rises
The participation rate rose by 0.1 percentage points in March 2011 taking us back to the December 2010 level. This month the extra workers coming into the labour force attenuated (very slightly) the fall in the unemployment that would have been evident given the employment growth.
The labour force is a subset of the working-age population (those above 15 years old). The proportion of the working-age population that constitutes the labour force is called the labour force participation rate. So changes in the labour force can impact on the official unemployment rate and so movements in the latter need to be interpreted carefully. A rising unemployment rate may not indicate a recessing economy.
The labour force can expand as a result of general population growth and/or increases in the labour force participation rates.
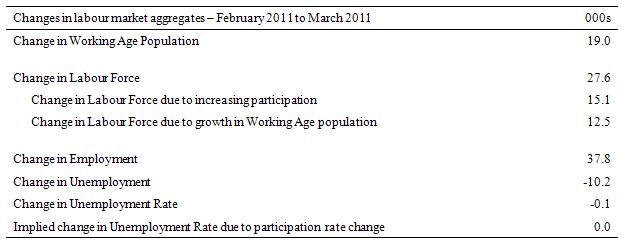
The following Table shows the breakdown in the changes to the main aggregates (Labour Force, Employment and Unemployment) and the impact of the fall in the participation rate.
In March 2011, employment rose by 37.8 thousand and the labour force rose by 27.6 thousand which meant that unemployment fell by 10.2 thousand. The impact of the rise in the participation rate was to add an extra 15.1 thousand workers from the labour force. Growth in the working age population added an extra 12.5 thousand to the labour force – this impact is steady from month to month.
The net result was a decimal point impact on the unemployment rate.
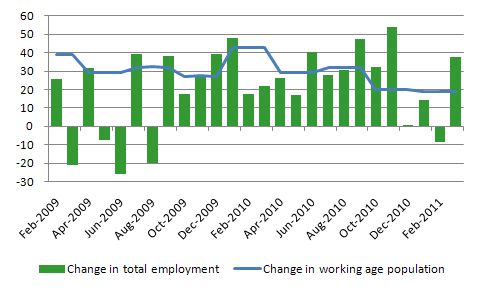
Another way of thinking about the strength of employment growth is to compare the change in employment each month with the change in the working age population (WAP). The change in the WAP is the underlying number of workers that enter the labour force month to month. The labour force fluctuates also due to participation rate changes but they tend to be volatile and cyclical.
So is the Australian economy adding jobs faster than the growth of its population? The answer is no.
The following graph plots the two series from February 2009. Over that period, the WAP has expanded on average by 26 thousand per month which is the average net employment increase over the same period. That is why unemployment is hovering at its high levels. The fluctuations in unemployment are on average largely due to participation rate volatility over this period.
I think that is an important observation that is largely overlooked in the public debate.
Hours worked rise in March
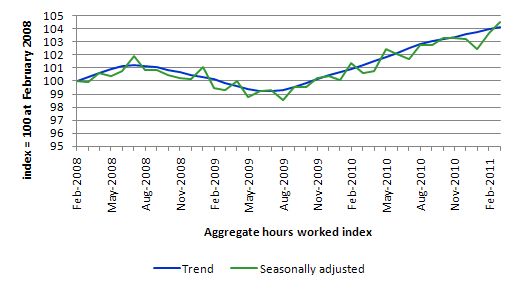
Total monthly hours worked rose in March (13.1 million hours or 0.8 per cent). After several months of flattening trend, the official ABS data is now showing a modest positive trend.
The following graph shows the trend and seasonally adjusted aggregate hours worked indexed to 100 at the peak in February 2008 (which was the low-point unemployment rate in the previous cycle).
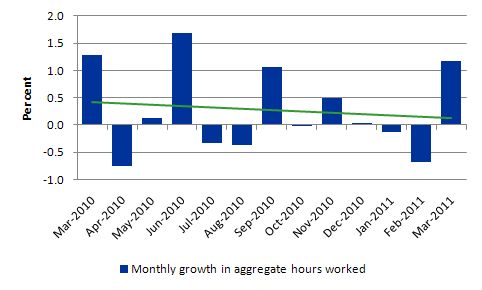
The next graph shows the monthly growth (in per cent) over the last 12 months. The green linear line is a simple regression trend and it is suggesting monthly growth rates have been in decline all year.
Once again the data doesn’t support the notion of a fully employed labour market that is bursting against the inflation barrier.
Conclusion
The March Labour Force data shows that the Australian economy is adding net jobs and slowly eating into the large pool of unemployment. Compared to what we see in other advanced nations, this is a standout result.
I also think this is a clearer result than we have been seeing over the last few months which have been tarred with the natural disasters. But with monthly data you always have to be careful to look at the trends over several months. They are positive but modest.
However, we should not get lulled into thinking that all is well.
There is still a lot of slack left to be mopped up and the teenage employment problem is manifest and should be a policy priority.
In saying that I do not mean the wan participation policies that the Government and Opposition are proposing. 86 thousand teenage jobs have disappeared – that is, they were already working and have now been squeezed out.
That is enough for today!
I have question, if unemployment is looking so good and all is rosy. Why does job and financial security seem more uncertain than ever before.
Dear Bill,
You wrote “Nomenclature is important and the neo-liberals developed a lexicon that purported to legitimise the illegitimate. Language and text is an interest of mine and I might write a blog about that.”
I think that economics nomenclature has not been defined strictly by ideology (although the discipline is, of course, full of loaded terms).
Mainstream economists have been using the term “spending”, for example, whenever one entity (person, gov’t, firm) gives money to another. We do the same, so there is no distinction between me spending money on a new car and the government spending money on a new bridge.
And nomenclature is, I believe, one major stumbling block towards an understanding of the basic, descriptive tenets of MMT by a wider audience. (We see polls where a significant part, sometimes the majority, of respondents agree that ‘the government had no choice’ but to follow the ‘fiscal austerity’ path.)
Cheers.
This is the other alternative to the ABS figures, interesting reading
http://www.roymorgan.com/news/polls/2011/4650/
Jack, it is an alternative to the ABS figures and interesting reading but I have never fathomed why Roy Morgan polling results for unemployment are so volatile
The government needs to stand up to the mining industry and make them lift their weight. Instead of bleating about a lack of skilled workers the Gov should attack the mining industry for not training young people to fill the so called skilled jobs now going to imported workers. The miners are about 50% owned by international investors who are getting fat on a diminishing resource.
Its a political disgrace that we have 85,000 teens that have lost jobs. These poor kids have to listen and read about politicians and government fat cats crowing about the once in 100 years terms of trade boom. The terms of trade boom is a wast if we cant put these kids in long term secure jobs. A major failure of policy and it stinks. Cheers Punchy