Go back to the headlines in 2010 - – “Countries with debt over 90 percent…
Australian inflation rate remains on a downward trajectory
Today (February 28, 2024), the Australian Bureau of Statistics (ABS) released the latest – Monthly Consumer Price Index Indicator – for January 2024, which showed that the inflation rate steadied at 3.4 per cent but remains in a downward trajectory in Australia as it is elsewhere in the world. Today’s figures are the closest we have to what is actually going on at the moment and show that the inflation was 3.4 per cent in January 2024 but many of the key driving components are now firmly declining. The trajectory is firmly downwards. As I show below, the only components of the CPI that are rising are either due to external factors that the RBA has no control over and are ephemeral, or, are being caused by the RBA rate rises themselves. All the rate hikes have done is engineer a massive shift in income distribution towards the rich away from the poor. The slowdown the Australian economy is experiencing is largely due to fiscal drag not higher interest rates.
The latest monthly ABS CPI data shows for January 2024 that:
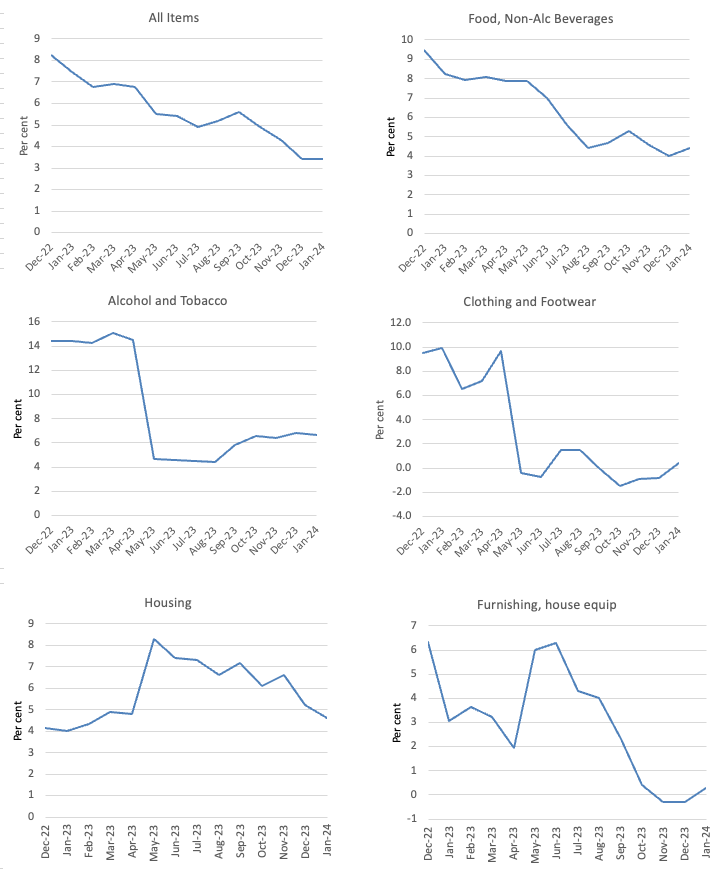
- The All groups CPI measure was steady at 3.4 per cent.
- Food and non-alcoholic beverages rose by 4.4 per cent (4 per cent in December).
- Clothing and footwear 0.4 per cent (-0.8 per cent in December).
- Housing 4.6 per cent (5.2 per cent in December).
- Furnishings and household equipment 0.3 per cent (-0.3 per cent in December).
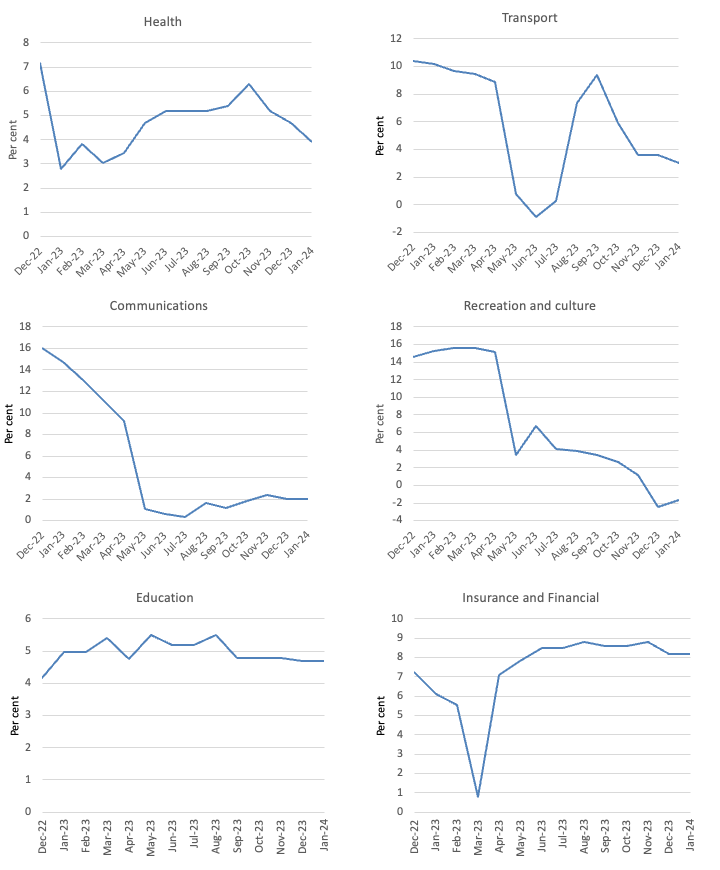
- Health 3.9 per cent (4.7 per cent in December).
- Transport 3 per cent (3.6 per cent in December).
- Communications 2 per cent (2 per cent in December).
- Recreation and culture -1.7 per cent (-2.4 per cent in December).
- Education 4.7 per cent (4.7 per cent in December).
- Insurance and financial services steady at 8.2 per cent.
The ABS Media Release (February 28, 2024) – Monthly CPI indicator rose 3.4 per cent in the year to January 2024 – noted that:
The monthly Consumer Price Index (CPI) indicator rose 3.4 per cent in the 12 months to January 2024 …
Annual inflation for the monthly CPI indicator was steady at 3.4 per cent and remains the lowest annual inflation since November 2021 …
The most significant contributors to the January annual increase were Housing (+4.6 per cent), Food and non-alcoholic beverages (+4.4 per cent), Alcohol and tobacco (+6.7 per cent) and Insurance and financial services (+8.2 per cent). Partially offsetting the annual increase is Recreation and culture (-1.7 per cent) primarily due to Holiday travel and accommodation (-7.1 per cent) …
Rent prices rose 7.4 per cent in the 12 months to January, reflecting a tight rental market and low vacancy rates across the country …
Annual electricity prices rose 0.8 per cent in the 12 months to January 2024. The introduction of the Energy Bill Relief Fund rebates for eligible households from July 2023 has mostly offset electricity price rises from annual price reviews in July due to increases in wholesale prices.
So a few observations:
1. The inflation situation has stabilised and will continue to decline over the next several months.
2. Housing inflation has fallen from 5.2 per cent in December to 4.6 per cent in January with rent inflation still a problem.
3. The rent inflation is partly due to the RBA’s own rate hikes as landlords in a tight housing market just pass on the higher borrowing costs – so the so-called inflation-fighting rate hikes are actually driving inflation.
4. Note that fiscal policy measures with respect to electricity prices has effectively eliminated that pressure.
The Federal government could have done much more to relieve the pressure on households of these temporary cost-of-living rises over the last two years.
Note the rise in FIRE services which is, in part, due to the banks gouging profits.
The general conclusion is that the global factors that were responsible for the inflation pressures are abating fairly quickly as the world adapts to Covid, Ukraine and OPEC profit gouging.
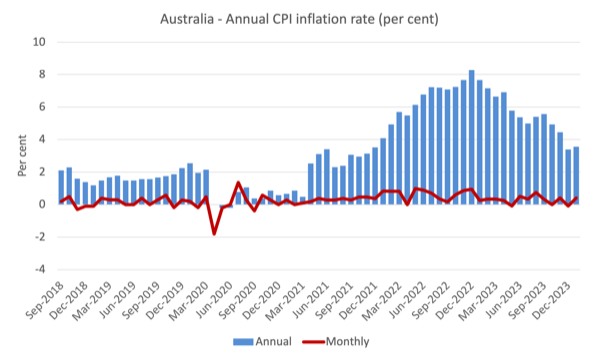
The next graph shows, the annual rate of inflation is heading in one direction – down with month-to-month variations reflecting special events or adjustments (such as, annual indexing arrangements etc).
The blue columns show the annual rate while the red line shows the month-to-month movements in the All Items CPI.
The next graphs show the movements between December 2022 and January 2024 for the main components of the All Items CPI.
In general, most components are seeing dramatic reductions in price rises as noted above and the exceptions do not provide the RBA with any justification for further interest rate rises.
For example, the Recreation and Culture component that was driving inflation in 2023 is now deflating – this just reflected the temporary bounceback of travel and related activities after the extensive lockdowns and other restrictions in the early years of the Pandemic.
It was always going to adjust back to more usual behaviour.
Overall, the inflation rate is declining as the supply factors ease.
The food component is also sensitive to the behaviour of the supermarkets.
Just yesterday, it was reported that price gouging in the retail sector supplying food and groceries was delivering massive profit margins.
The ABC news story (February 27, 2024) – Coles accused of gouging shoppers as they struggle to put food on the table – reported that the Coles Group, one of two major supermarket companies in Australia that control around 64 per cent of the total market in Australia, with Aldi coming in around 10 per cent, posted another massive profit result for the 6 months to December 2023.
The gross profit margin for Coles and Woolworths is around 26 to 27 per cent, which for companies that provide food (a stable commodity) is ridiculously high.
The margin has risen for Coles over the inflationary period, which is prima facie evidence of profit gouging.
The company claimed that:
Our profits allow us to continue to invest in our business and deliver for our stakeholders — whether they are our customers, suppliers, team members, community partners or shareholders — we are working hard to deliver good outcomes across the board.
But the evidence is that there is more return to shareholders and less investment going on and also squeezing of their suppliers is common.
Further, trying to claim that the sort of returns they have been generating are good for their “customers” (which is really stretching the meaning of “stakeholders”) is disengenous in the extreme.
The point is that if these two dominant companies – which effectively form a oligopoly – had less discretion to push up profit margins under the cover of general price pressures in the economy, then the CPI inflation rate would be much lower than it currently is.
That has nothing to do with wages or excessive demand pressures and all to do with excessive concentration in the sector which should be more closely regulated.
The asymmetry of monetary policy
Economists who support the use of interest rates to alter spending levels in the economy (which means most economists) have argued that the declining inflation is the direct result of the RBA’s interest rate hikes.
They point to the slowdown in GDP growth and the declining retail sales figures as evidence to support their contention.
However, they ignore the fact that fiscal policy has shifted from producing deficits to surpluses over the last 12 months.
During the GFC, the Australian Treasury conducted research to estimate the relative contributions of monetary and fiscal policy to the modest recovery in GDP after the massive global financial shock that we imported.
The RBA had cut rates while the Treasury had overseen a major increase in the fiscal deficit as a result of several discretionary spending initiatives by the Federal government.
In the first four quarters of the GFC (December-quarter on), they estimated that the fiscal stimulus had contributed significantly to the quarterly growth rate.
On December 8, 2009 the Federal Treasury made a presentation entitled – The Return of Fiscal Policy – to the Australian Business Economists Annual Forecasting Conference 2009.
I wrote about that in this blog post – Lesson for today: the public sector saved us (December 21, 2009).
While I disagree with most of the theorising presented by the Treasury in the paper, the graphs they provided were interesting.
They noted:
Chart 10 shows Treasury’s estimates … of the effect of the discretionary fiscal stimulus packages on quarterly GDP growth. These estimates suggest that discretionary fiscal action provided substantial support to domestic economic growth in each quarter over the year to the September quarter 2009 – with its maximal effect in the June quarter …
The estimates imply that, absent the discretionary fiscal packages, real GDP would have contracted not only in the December quarter 2008 (which it did), but also in the March and June quarters of 2009, and therefore that the economy would have contracted significantly over the year to June 2009, rather than expanding by an estimated 0.6 per cent.
While many economists at the time claimed there was no need for any fiscal response, it is obvious that Australia would have been in a 3-quarter recession if the intervention had not have occurred.
The other interesting part of their work was the estimates of the impact of the rapid reduction in interest rates by the Reserve Bank on GDP growth rates
This analysis provided a direct comparison between expansionary fiscal policy and loosening of monetary policy.
The conclusion was clear:
… this fall in real borrowing rates would have contributed less than 1 per cent to GDP growth over the year to the September quarter 2009, compared with the estimated contribution from the discretionary fiscal packages of about 2.4 per cent over the same period.
So discretionary fiscal policy changes was estimated to be around 2.4 times more effective than monetary policy changes (which were of record proportions).
Think about now.
Interest rates have been hiked 11 times since May 2022.
But at the same time, the fiscal balance has shifted from a deficit of 6.4 per cent of GDP in 2020-21 and a deficit of 1.4 per cent of GDP in 2021-22, to a surplus of 0.9 per cent of GDP in 2022-23.
The Federal government is projecting another surplus in the current financial year.
That is a major fiscal shift and the fiscal drag explains most of the slowdown in growth and expenditure.
But there is an asymmetry also operating in monetary policy, which relates to the spending propensities of the different income groups that are affected by interest rate changes.
High income groups have lower marginal propensities to consume (meaning they save more per extra dollar of disposable income) than low income households.
They also have more financial wealth.
When interest rates rise, total spending by low income households doesn’t change much because they are already spending all their income.
Only the composition changes.
They also own very little financial wealth so do not get any income boosts via the rising returns.
For high income households, they gain a massive boost in income from their financial assets and even though they save more than low income households, their spending increases somewhat via the wealth effect.
These changes do not operate in reverse.
So, it is much more likely that slowdown in GDP is the result of the fiscal drag rather than the interest rate increases.
Conclusion
The latest CPI data demonstrates that inflation is now contained and in a downward trajectory in Australia as it is elsewhere in the world.
The reason for the decline is simple – the factors that were driving the inflation are abating.
And those factors – supply constraints, shock from Russian invasion, OPEC price gouging – were not sensitive to RBA rate hikes.
All the rate hikes have done is engineer a massive shift in income distribution towards the rich away from the poor.
The slowdown the Australian economy is experiencing is largely due to fiscal drag not higher interest rates.
That is enough for today!
(c) Copyright 2024 William Mitchell. All Rights Reserved.
How sloppily inaccurate are financial journalists in conveying a false message when hearing them report that “prices are coming down” in response to a fall in the rate of inflation? Prices are doing no such thing, of course, as that would be deflation.
It’s clearly above their pay grade to be able to explain that it is the rate of rise in prices that is coming down while prices are still going up. Alternatively, a statement that price increases have slowed from x to y on average over the last period would be suitable. All too difficult to say, I guess.