The recent extreme weather in the northern hemisphere, the twin monster tropical storms in Japan,…
Australian labour market – slight weakening in September as hidden unemployment rises
The Australian Bureau of Statistics released the latest – Labour Force, Australia – for September 2023 today (October 19, 2023). My overall assessment is that the the labour market is now looking subdued although relatively stable. The decline in full-time employment is a worry. Almost all the net change in employment over the last six months has been part-time. In September, employment growth was not strong enough to absorb the underlying population growth. The only reason unemployment fell in the context of the weak employment growth was because the fall in the participation rate meant more workers left the labour force. There are now 9.9 per cent of the available and willing working age population who are being wasted in one way or another – either unemployed or underemployed. The fact that the broad underutlisation rate fell is not a cause for celebration because it was driven by the decline in participation, which just means hidden unemployment rose. Australia is not near full employment despite the claims by the mainstream commentators.
The summary ABS Labour Force (seasonally adjusted) estimates for September 2023 are:
- Employment rose 6,700 (0.0 per cent) – full-time employment decreased by 39,900 and part-time employment increased by 46,500. Part-time share of total was 30.5 per cent.
- Unemployment fell 19,800 to 520,500 persons.
- The official unemployment rate fell 0.1 point to 3.6 per cent.
- The participation rate fell 0.2 points to 66.7 per cent.
- The employment-population ratio fell 0.1 point to 64.4 per cent.
- Aggregate monthly hours fell 8 million hours (-0.4 per cent) – second consecutive month.
- Underemployment fell 0.2 points to 6.4 per cent (-24.3 thousand). Overall there are 931.3 thousand underemployed workers. The total labour underutilisation rate (unemployment plus underemployment) fell 0.3 points to 9.9 per cent. There were a total of 1,451.8 thousand workers either unemployed or underemployed.
In its – Media Release – the ABS noted that:
The unemployment rate fell 0.1 percentage point to 3.6 per cent in September (seasonally adjusted) …
The fall in the unemployment rate in September mainly reflected a higher proportion of people moving from being unemployed to not in the labour force.
The participation rate fell 0.2 percentage points to 66.7 per cent …
Monthly hours worked fell 0.4 per cent in September 2023, following a fall of 0.5 per cent in August, while employment was relatively flat (rising less than 0.1 per cent) …
The recent softening in hours worked, relative to employment growth, may suggest an easing in labour market strength, though it also follows particularly strong growth over the past year.
Conclusion: The September result demonstrates indicates a slight weakening although taken over a longer period there is still no sign of any major slowdown emerging.
While the RBA has been trying to push the unemployment rate up to 4.5 per cent, the data shows how ineffective conventional monetary policy (interest rate changes) is as a counter-stabilisation tool.
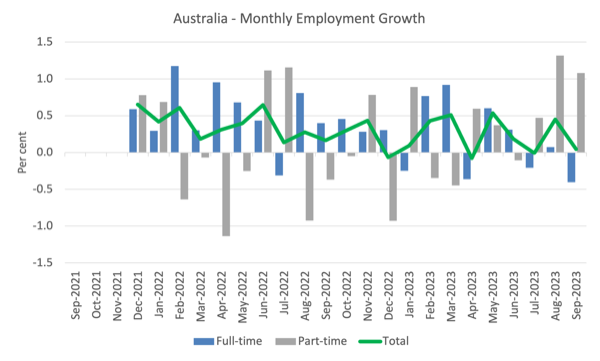
Employment rose just 6,700 (0.0 per cent) in September 2023
1. Full-time employment decreased by 39,900 (-0.4 per cent) and part-time employment increased by 46,500 (1.1 per cent).
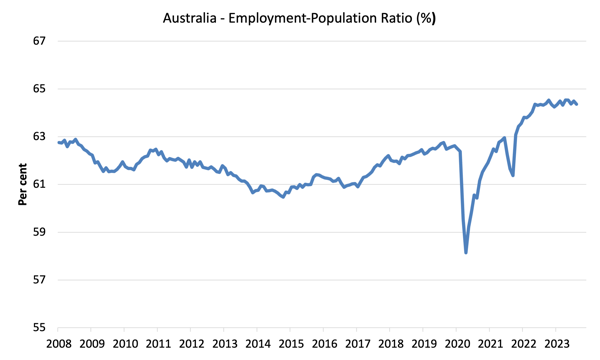
2. The employment-population ratio fell 0.1 point to 64.4 per cent.
The following graph shows the month by month growth in full-time (blue columns), part-time (grey columns) and total employment (green line) for the 24 months to September 2023 using seasonally adjusted data.
I took out the observations from September to January 2021 – they were outliers due to the Covid wave at that time.
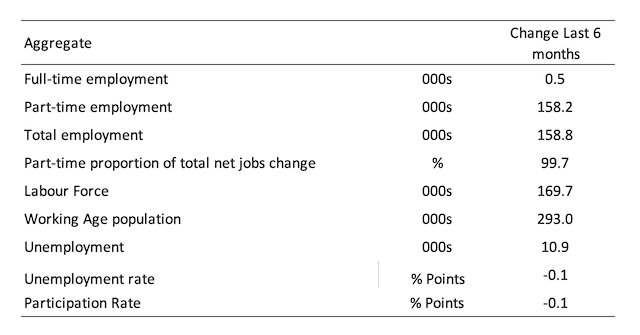
The following table provides an accounting summary of the labour market performance over the last six months to provide a longer perspective that cuts through the monthly variability and provides a better assessment of the trends.
Given the variation in the labour force estimates, it is sometimes useful to examine the Employment-to-Population ratio (%) because the underlying population estimates (denominator) are less cyclical and subject to variation than the labour force estimates. This is an alternative measure of the robustness of activity to the unemployment rate, which is sensitive to those labour force swings.
The following graph shows the Employment-to-Population ratio, since January 2008 (that is, since the GFC).
The ratio fell 0.1 point to 64.4 per cent in September 2023.
Overall, employment growth has slowed markedly and all the new (net) employment growth is coming from part-time employment.
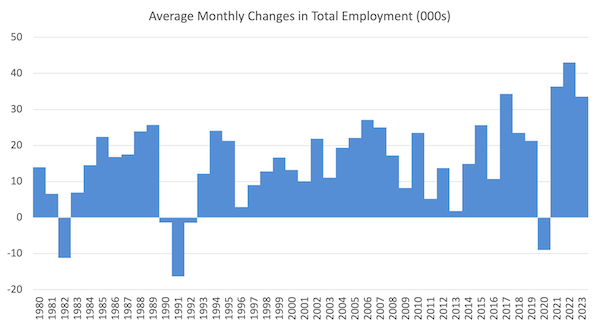
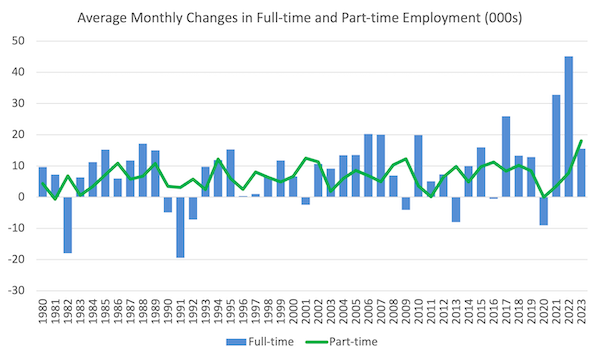
For perspective, the following graph shows the average monthly employment change for the calendar years from 1980 to 2022 (to date).
1. The average employment change over 2020 was -9 thousand which rose to 36.3 thousand in 2021 as the lockdowns eased.
2. For 2022, the average monthly change was 43 thousand.
3. So far, in 2023, the average change is 37.7 thousand.
The following graph shows the average monthly changes in Full-time and Part-time employment (lower panel) in thousands since 1980.
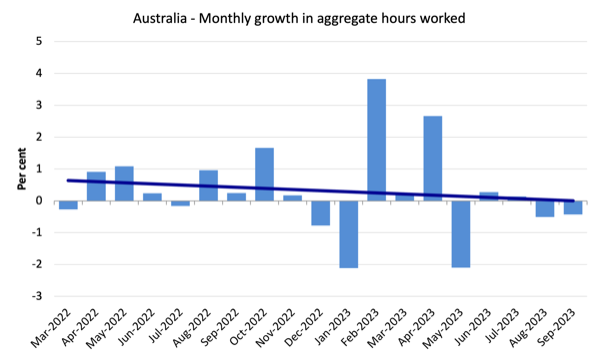
Hours worked fell 8.5 million hours (-0.44 per cent) in September 2023
This is the second consecutive monthly decline, which suggests the slowdown has begun.
The following graph shows the monthly growth (in per cent) over the last 24 months (with the pandemic restriction period omitted).
The dark linear line is a simple regression trend of the monthly change.
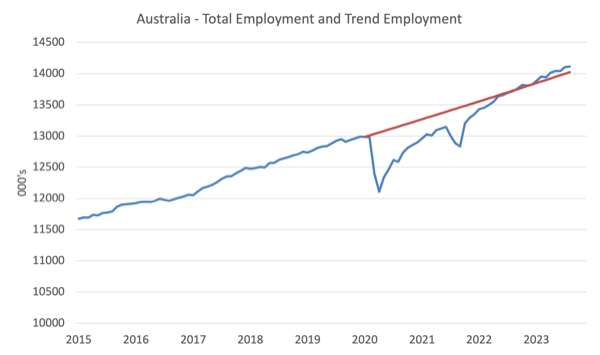
Actual and Trend Employment
The following graph shows total employment (blue line) and what employment would have been if it had continued to grow according to the average growth rate between 2015 and April 2020.
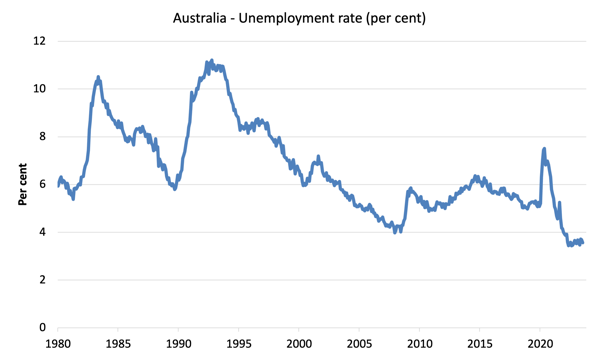
Unemployment fell 19,800 to 520,500 persons in September 2023
Unemployment fell this month but only because participation fell (see below for analysis).
In fact, employment growth was not sufficient to match the underlying population growth.
The following graph shows the national unemployment rate from January 1980 to September 2023. The longer time-series helps frame some perspective to what is happening at present.
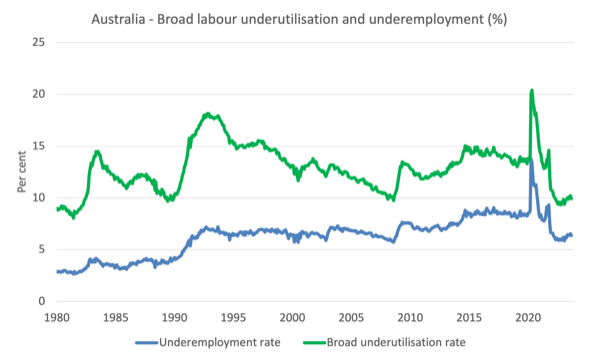
Broad labour underutilisation fell 0.3 points to 9.9 per cent in September 2023
1. Underemployment fell 0.2 points to 6.4 per cent (-24.3 thousand).
2. Overall there are 931.3 thousand underemployed workers.
3. The total labour underutilisation rate (unemployment plus underemployment) fell 0.3 points to 9.9 per cent.
4. There were a total of 1,451.8 thousand workers either unemployed or underemployed.
Caution though: the decline is associated with a fall in participation.
The following graph plots the seasonally-adjusted underemployment rate in Australia from April 1980 to the September 2023 (blue line) and the broad underutilisation rate over the same period (green line).
The difference between the two lines is the unemployment rate.
Aggregate participation rate decreased by 0.2 points to 66.7 per cent
The fall in unemployment was the result of less workers being counted in the labour force.
The labour force is a subset of the working-age population (those above 15 years old). The proportion of the working-age population that constitutes the labour force is called the labour force participation rate. Thus changes in the labour force can impact on the official unemployment rate, and, as a result, movements in the latter need to be interpreted carefully. A rising unemployment rate may not indicate a recessing economy.
The labour force can expand as a result of general population growth and/or increases in the labour force participation rates (and vice versa).
The following Table shows the breakdown in the changes to the main aggregates (Labour Force, Employment and Unemployment) and the impact of the fall in the participation rate.
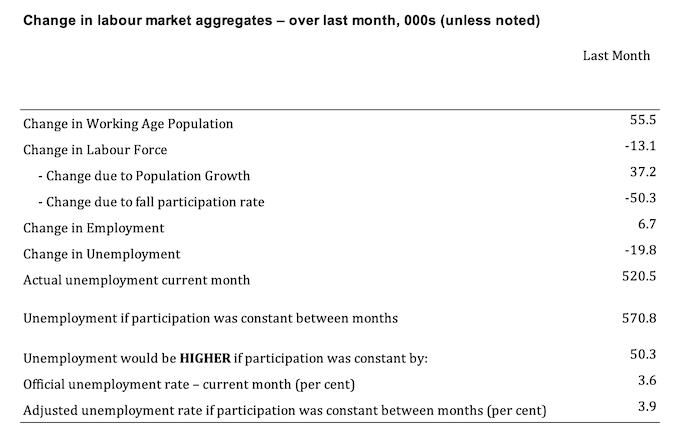
The change in the labour force in September 2023 was the outcome of two separate factors:
- The underlying population growth added 37.2 thousand persons to the labour force. The population growth impact on the labour force aggregate is relatively steady from month to month; and
- The fall in the participation rate meant that there were 50.3 thousand workers exiting the labour force (relative to what would have occurred had the participation rate remained unchanged).
- The net result was that the labour force fell by 13.1 thousand.
Assessment:
1. If the participation rate had not have fallen in September 2023, total unemployment, given the current employment level, would have been 570.8 thousand rather than the official count of 520.5 thousand as recorded by the ABS – a difference of 50.3 thousand workers (the ‘participation effect’).
2. Without the fall in the participation rate, the official unemployment rate would have been 3.9 per cent (rounded) rather than its current value of 3.6 per cent).
3. In other words, the rise in labour underutilisation is being hidden outside the official labour force count.
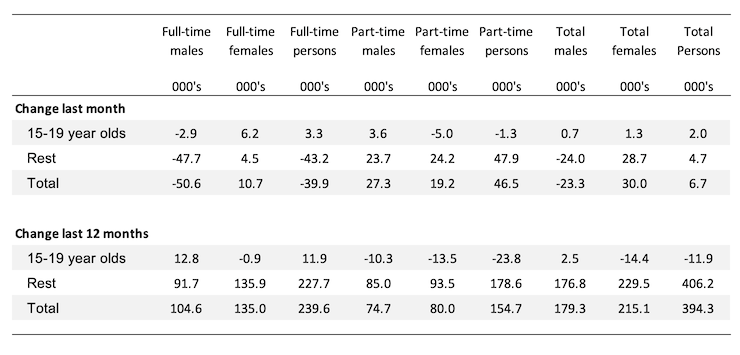
Teenage labour market improves slightly in September 2023
A very modest employment boost for teenagers in September, the notable aspect being the growth in full-time work running against the overall significant loss of full-time employment.
The following Table shows the distribution of net employment creation in the last month and the last 12 months by full-time/part-time status and age/gender category (15-19 year olds and the rest).
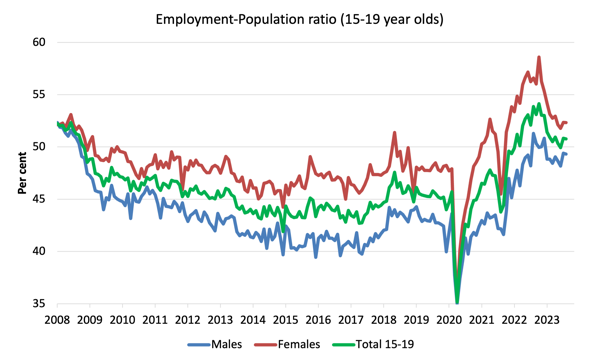
To put the teenage employment situation in a scale context (relative to their size in the population) the following graph shows the Employment-Population ratios for males, females and total 15-19 year olds since July 2008.
You can interpret this graph as depicting the change in employment relative to the underlying population of each cohort.
In terms of the recent dynamics:
1. The male ratio fell 0.1 point over the month.
2. The female ratio was steady.
3. The overall teenage employment-population ratio fell 0.1 point over the month.
Conclusion
My standard monthly warning: we always have to be careful interpreting month to month movements given the way the Labour Force Survey is constructed and implemented.
My overall assessment is:
1. The labour market is now looking subdued although relatively stable.
2. Employment growth was not strong enough in September to absorb the underlying population growth.
3. The only reason unemployment fell in the context of the weak employment growth was because the fall in the participation rate meant more workers left the labour force.
4. There are now 9.9 per cent of the available and willing working age population who are being wasted in one way or another – either unemployed or underemployed.
5. The fact that the broad underutlisation rate fell is not a cause for celebration because it was driven by the decline in participation, which just means hidden unemployment rose.
6. Australia is not near full employment despite the claims by the mainstream commentators.
That is enough for today!
(c) Copyright 2023 William Mitchell. All Rights Reserved.
Denial of the need to transition away from coal prevents Australia from making the necessary investments to maintain employment as coal exports inevitably decline (as Asia increasingly turns to nuclear energy, even for steel production).
Full employment as defined by the metric taken to its logical conclusion = everyone employed worked only 1 paid hour per week and noone looking for work. With a stat like that Chalmers could shout that Australia has ZERO unemployment. As if that were a good thing where everyone was in poverty and we had a land of the working poor. Never mind the quality of the jobs nor the livability possible from the wages earned. The more that give up looking for paid work the better the employment figures look.
The fraudulent use of headline numbers and percentages is a stock-in-trade for politicians and their sycophantic commentators. Nominal versus real world significance become disregarded by most MSM.
The Bullock at the gate at the RBA was finger wagging about a further rate rise by pointing to supply side problems (as if they can be managed by interest rate rises rather than price controls) while the MSM dutifully followed up with its churnalism pumping out what she said (“may be FORCED to deliver a further rate rise”) to soften up the ignorant masses for when it comes. The neoclassicals like nothing better than building in the expectation which is later confirmed as a self-fulfilling prophecy. Got to get that unemployment up to their latest NAIRU belief level of 4.5% “Some further tightening of monetary policy may be required to ensure that inflation returns to target in a reasonable timeframe.” Tightening = Increasing the interest rate but “tightening” sounds so much more insider speak at the expense of plain speaking.
If/when a further rate rise occurs on instruction from the US Fed it will do even more damage as the timeline is so far along the path of increasing numbers of expiring fixed rate mortgages there will be more of the damaged mortgagors and low paid than perhaps anticipated by the RBA. As if they cared. No considered MSM analysis or critique of what Bullock has said in light of reality when they can just act as her stenographers.
Hello… My name is Fachri Ranu and i am Indonesian. My question is not about the articel topic so i apologizing in advance.
In 2017 i hear about MMT and by 2019 i decide to completely revise my academic plan and enter Economics as undergraduate student in one of my country uni with aspiration to be an Economist. Why i did that? Because i feel my country didnt have any heterodox economist let alone MMT one. The only popular source is YouTube personality that very misleading in presenting MMT. I have small circle of MMTers but the highest degree in our community is Master level. Thats why i feel it important to have at least some Doctoral level MMTers so that we have the chance to be heard at least a little. I completed my undergraduate this semester, enduring very thick neo classical lecture no less, and i am planning to try study heterodox economy specifically MMT strand at graduate level, preferably a program that allow student to jump to PhD degree straight from undergraduate degree. So if anyone here can point out to me a list of MMT friendly graduate level programs in US, Australia, UK or Canada i would really appreciate it, thank you very much in advance and once again i am sorry because my comment out of topic of the article.
Bill, or anyone, please reply to this comment and explain why I’m wrong. I have nobody else to ask.
AFAIK, banks could lend huge amounts of money to invest in innovation, and not worry about if the loans were repaid as long as the interest was paid. Banks got the principal for free when they created it out of thin air. So, why are they so demanding that it be repaid? Is there some bookkeeping thing that makes them care? In the end all the banks get out of a loan is the interest. AFAIK, the principal disappears whey a payment is made because it is matched against the value of the repayment contract and the numbers cancel out, so poof the money is gone. If this were not so, all the accumulated repaid principal from all the loans since 1913 or 1914 would have added to the money supply, but it did not do that.