Economics and business correspondents regularly serve as apologists for poor policy. Their motivation is to…
Australia’s inflation rate continues to fall despite RBA inflationary rate hikes
Today (July 26, 2023), the Australian Bureau of Statistics released the latest – Consumer Price Index, Australia – for the June-quarter 2023. It showed that the CPI rose 0.8 per cent in the quarter (down 0.6 points) and over the 12 months by 6.1 per cent (down 0.9 points). The annual inflation rate in Australia was significantly lower again in the June-quarter as the supply-side drivers abate. This was always going to be a transitory adjustment phase after the massive disruption from Covid and the exacerbating factors associated with the Ukraine situation and the OPEC price gouge. There was never any justification for the RBA pushing up interest rates. The correct policy response should have been to provide fiscal support for lower-income households to help them cope with the cost of living rises and wait for the adjustment after the disruption to come. The approach taken by the Bank of Japan and the Japanese government was the correct one and that is now clear even though the mainstream economists still cannot see past their textbooks.
The summary, seasonally-adjusted Consumer Price Index results for the June-quarter 2023 are as follows:
- The All Groups CPI rose by 0.8 per cent for the quarter – 0.6 points down from the last quarter.
- The All Groups CPI rose by 6.1 per cent over the 12 months (a decline from 7 per cent in the December-quarter 2022).
- The major determinants were were Rents (+2.5 per cent), International holiday travel and accommodation (+6.2 per cent), Other financial services (+2.5 per cent), and New dwelling purchase by owner-occupiers (+1.0 per cent).
- The Trimmed mean series rose by 0.9 per cent for the quarter (down 0.2 points) and 5.9 per cent over the previous year.
- The Weighted median series rose by 1 per cent (down 0.2 points) for the quarter and 5.5 per cent over the previous year.
The ABS Media Release notes that:
CPI inflation slowed in the June quarter, with the quarterly rise being the lowest since September 2021. While prices continued to rise for most goods and services, there were some offsetting price falls this quarter including for domestic holiday travel and accommodation and automotive fuel …
The most significant contributors to the rise in the June quarter were rents (+2.5 per cent), international holiday travel and accommodation (+6.2 per cent), other financial services (+2.5 per cent) and new dwellings purchased by owner occupiers (+1.0 per cent) …
Underlying inflation measures reduce the impact of irregular or temporary price changes in the CPI. Annual trimmed mean inflation was 5.9 per cent, down from 6.6 per cent in the March quarter.
Short assessment:
1. The inflation rate continues to fall as the supply factors that drove its rise abate.
2. Note that a significant factor now is the rising rent costs, which are driven, in part, by the RBA rate hikes – so interest rate hikes are themselves inflationary even though the Bank denies that.
Trends in inflation
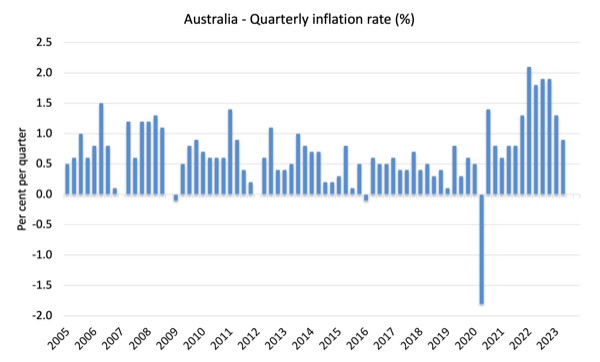
The headline inflation rate increased by 0.8 per cent in the June-quarter 2023 a 0.6 points fall over the quarter.
Over the 12 months to December the inflation rate was 6.1 per cent (down 0.9 points).
The peak was in the December-quarter 2022 when the inflation rate high 7.8 per cent.
The following graph shows the quarterly inflation rate since the December-quarter 2005.
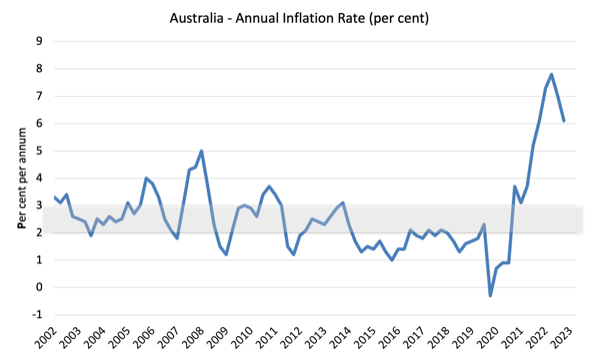
The next graph shows the annual headline inflation rate since the first-quarter 2002. The shaded area is the RBA’s so-called targetting range (but read below for an interpretation).
What is driving inflation in Australia?
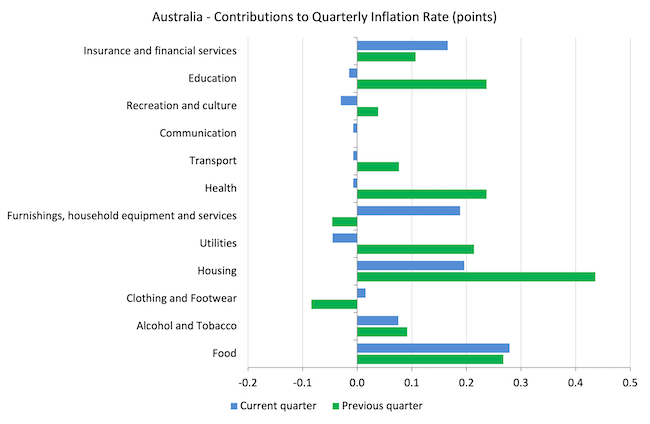
The following bar chart compares the contributions to the quarterly change in the CPI for the June-quarter 2023 (blue bars) compared to the March-quarter 2023 (green bars).
Note that Utilities is a sub-group of Housing and not insignificantly reflects government administrative decisions
The impacts of the climate chaos on food prices remains a problem.
The non-competitive financial sector is also going for broke and should be more tightly regulated,
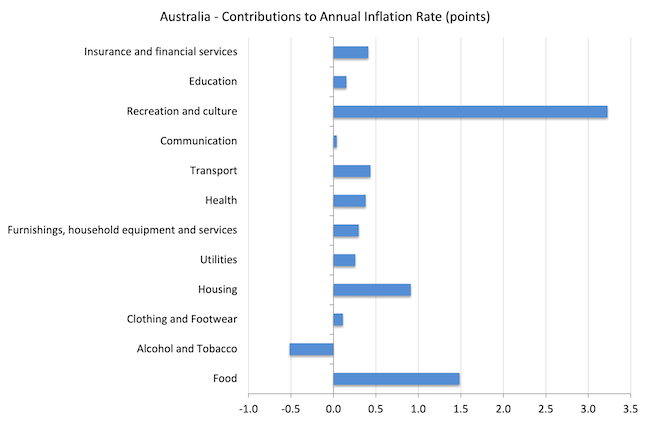
The next graph shows the contributions in points to the annual inflation rate by the various components.
The Recreation and culture components reflects the boom in international travel following the Covid restrictions easing and that will normalise soon.
The main drivers will disappear in coming quarters given their origin (see above).
Inflation and Expected Inflation
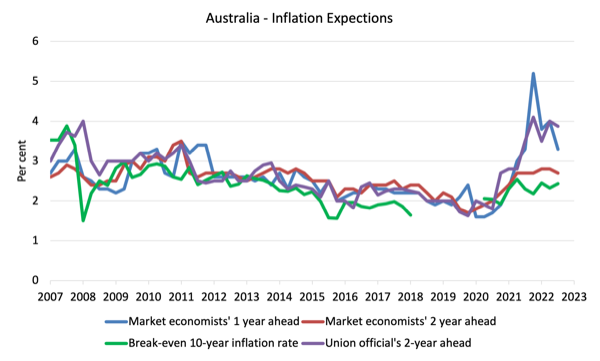
The following graph shows four measures of expected inflation produced by the RBA – Inflation Expectations – G3 – from the December-quarter 2005 to the June-quarter 2023.
The four measures are:
1. Market economists’ inflation expectations – 1-year ahead.
2. Market economists’ inflation expectations – 2-year ahead – so what they think inflation will be in 2 years time.
3. Break-even 10-year inflation rate – The average annual inflation rate implied by the difference between 10-year nominal bond yield and 10-year inflation indexed bond yield. This is a measure of the market sentiment to inflation risk. This is considered the most reliable indicator.
4. Union officials’ inflation expectations – 2-year ahead.
Notwithstanding the systematic errors in the forecasts, the price expectations (as measured by these series) are now falling or relatively stable.
In the case of the Market economists’ inflation expectations – 2-year ahead and the Break-even 10-year inflation rate, the expectations remain well within the RBA’s inflation targetting range (2-3 per cent) and show no signs of accelerating.
So all the talk now is that inflation is not falling fast enough – and that claim is accompanied by claims that the longer it remains above the inflation targetting range, the more likely it is that a wage-price spiral and/or accelerating (unanchored) expectations will drive the rate up for longer.
Neither claim can be remotely justified given the data.
Implications for monetary policy
What does this all mean for monetary policy?
The Consumer Price Index (CPI) is designed to reflect a broad basket of goods and services (the ‘regimen’) which are representative of the cost of living. You can learn more about the CPI regimen HERE.
The RBA’s formal inflation targeting rule aims to keep annual inflation rate (measured by the consumer price index) between 2 and 3 per cent over the medium term.
However, the RBA uses a range of measures to ascertain whether they believe there are persistent inflation threats.
Please read my blog post – Australian inflation trending down – lower oil prices and subdued economy – for a detailed discussion about the use of the headline rate of inflation and other analytical inflation measures.
The RBA does not rely on the ‘headline’ inflation rate. Instead, they use two measures of underlying inflation which attempt to net out the most volatile price movements.
The concept of underlying inflation is an attempt to separate the trend (“the persistent component of inflation) from the short-term fluctuations in prices. The main source of short-term ‘noise’ comes from “fluctuations in commodity markets and agricultural conditions, policy changes, or seasonal or infrequent price resetting”.
The RBA uses several different measures of underlying inflation which are generally categorised as ‘exclusion-based measures’ and ‘trimmed-mean measures’.
So, you can exclude “a particular set of volatile items – namely fruit, vegetables and automotive fuel” to get a better picture of the “persistent inflation pressures in the economy”. The main weaknesses with this method is that there can be “large temporary movements in components of the CPI that are not excluded” and volatile components can still be trending up (as in energy prices) or down.
The alternative trimmed-mean measures are popular among central bankers.
The authors say:
The trimmed-mean rate of inflation is defined as the average rate of inflation after “trimming” away a certain percentage of the distribution of price changes at both ends of that distribution. These measures are calculated by ordering the seasonally adjusted price changes for all CPI components in any period from lowest to highest, trimming away those that lie at the two outer edges of the distribution of price changes for that period, and then calculating an average inflation rate from the remaining set of price changes.
So you get some measure of central tendency not by exclusion but by giving lower weighting to volatile elements. Two trimmed measures are used by the RBA: (a) “the 15 per cent trimmed mean (which trims away the 15 per cent of items with both the smallest and largest price changes)”; and (b) “the weighted median (which is the price change at the 50th percentile by weight of the distribution of price changes)”.
So what has been happening with these different measures?
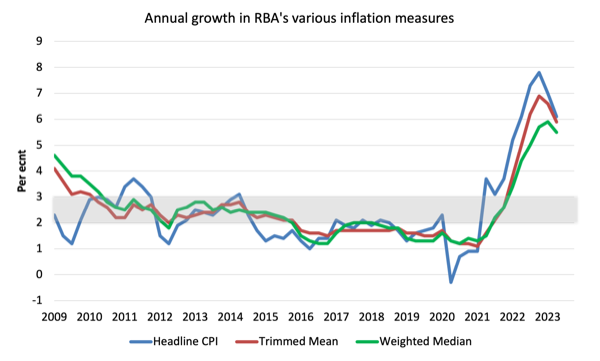
The following graph shows the three main inflation series published by the ABS since the December-quarter 2009 – the annual percentage change in the All items CPI (blue line); the annual changes in the weighted median (green line) and the trimmed mean (red line).
The RBAs inflation targetting band is 2 to 3 per cent (shaded area). The data is seasonally-adjusted.
The three measures are in annual terms:
1. CPI measure of inflation rose by 6.1 per cent (down from 7 per cent last quarter). For the quarter it rose by 0.8 points (down from 1.4)
2. The Trimmed Mean rose 5.9 per cent (down from 6.6 per cent last quarter). For the quarter it rose 0.9 points (down from 1.3).
3. The Weighted Median rose 5.5 per cent (up from 5.9 per cent last quarter). For the quarter it rose by 0.9 points (down from 1.3).
How to we assess these results?
1. The RBA’s preferred measures are now outside the targetting range and they have been using that fact to justify their rate hikes since May 2022 even though the factors that have been driving the inflation until late 2022 were not sensitive to the interest rate increases.
2. They also claimed the NAIRU was 4.5 per cent and with unemployment stable at around 3.5 per cent, they considered that justified further rate rises. However, if inflation is falling consistently with a stable unemployment rate then the NAIRU must be below the current rate of 3.5 per cent.
2. There is no evidence that inflationary expectations are accelerating – quite the opposite and that has been the case for some months now.
3. All the analytical CPI measures are in decline now.
4. There is no significant wages pressure.
5. The other major contributors to the current situation are also not sensitive to interest rate rises.
6. Rent inflation is being caused by the RBA rate hikes.
7. There is no major structural bias towards persistently higher inflation rates.
Conclusion
The annual inflation rate in Australia was significantly lower again in the June-quarter as the supply-side drivers abate.
This was always going to be a transitory adjustment phase after the massive disruption from Covid and the exacerbating factors associated with the Ukraine situation and the OPEC price gouge.
There was never any justification for the RBA pushing up interest rates.
The correct policy response should have been to provide fiscal support for lower-income households to help them cope with the cost of living rises and wait for the adjustment after the disruption to come.
The approach taken by the Bank of Japan and the Japanese government was the correct one and that is now clear even though the mainstream economists still cannot see past their textbooks.
That is enough for today!
(c) Copyright 2023 William Mitchell. All Rights Reserved.
Thanks Bill. You’ve been consistently vindicated and a beacon of clarity these last few years. More power to you. La lucha continua.