I started my undergraduate studies in economics in the late 1970s after starting out as…
Employment falls – better put interest rates up again
Here is today’s mystery question: when is it imperative that interest rates should rise? Answer according to most business economists in Australia: when official unemployment creeps up, underemployment rises; participation remains subdued, 88 per cent of the modest employment rise measured in persons is part-time, total employment in hours falls, and you have 26.4 per cent of your 15-24 year olds idle. The real answer: none of these commentators have the slightest sense of national priorities in terms of advancing public purpose and providing an adequate future for our youth. Talk about intergenerational burdens. All the focus is on the so-called debt overhang we are leaving our children. The biggest overhang we are leaving is our support for a government that refuses to provide enough jobs for them.
First, the facts from today’s Labour Force data published by the ABS:
- Employment (measured in persons) increased 24,500 with full-time employment rising by a modest 2,900 and part-time employment rising by 21,500 (88 per cent of total change.
- Unemployment increased 11,100 to 670,100.
- The official unemployment rate (persons) increased 0.1 percentage points to 5.8 per cent. The male unemployment rate increased 0.2 percentage points to 6.0 per cent and the female unemployment rate remained at 5.6 per cent.
- The labour force participation rate was steady at 65.2 per cent but still well down from its most recent peak (April 2008) of 65.6 per cent. So the approximate number of workers that have dropped out due to falling hours of work in the downturn (that is the rise in hidden unemployed) is 46 thousand persons.
- Aggregate monthly hours worked decreased 1.9 million hours – around a 1.7 per cent decrease since December last year. Not insigificant.
- Total labour underutilisation (sum of official unemployment rose to 13.6 per cent (from 13.5 per cent).
- Total labour underutilisation for 15-24 year olds is 26.4 per cent. Our gift to the next generation courtesy of an idle government.
Some of the reactions reported in the press today include:
“For the RBA it’s another bit of evidence to suggest the downturn is not as severe as they first thought it might be. It’s another reason to push on with interest rates higher, so we’re comfortable with our forecast of 25 basis point [rise] in December.”
“Today’s news should reassure the RBA that its determination to get rates back to normal is the correct path. Expect another rate rise in December, and it won’t be the last.”
The News Limited commentary by right-wing columnist Michael Stutchbury – Resilient jobs to fuel RBA rate rises was representative.
He said:
THE Australian economy’s resilience continues to surprise. The 24,500 job gain in October, just reported, and the slight rise in the jobless rate to 5.8 per cent is another strong result which will encourage the Reserve Bank to keep lifting interest rates … Financial market economists had … expected that employment would fall, if only on the basis that sooner or later the monthly job market numbers have to show some statistical bad news … Instead, September’s jump up in both total hours worked and full-time jobs basically held in October. And a spurt in part-time jobs lifted overall employment. In annual terms, total employment is now growing.
I wonder what “statistical bad news” means to these characters. My understanding tells me that the labour market has been steadily deteriorating since the beginning of 2008 although the extent of the decline has been less than we all expected (courtesy of two very timely and large fiscal interventions).
I also wonder what data he is looking at (or what he is taking while looking at it).
According to the ABS Aggregate monthly hours worked, male hours fell by 2656.9 thousand, females hours grew by 711.5 thousand with an overall loss of working hours of 1945.4 hours. That is a decline in total employment.
The hours worked perspective is particularly important because many families are relying on both adults working with the secondary breadwinner typically being part-time. The ability to service nominal contractual commitments has been very sensitive to the volume of available hours. It is not much use keeping your job (as a person) if the hours offered do not allow you to service your debt commitments.
This is why I consider it madness (apart from other reasons) to be hiking interest rates at this stage of the “recovery”. There is so much slack in the labour market and it is getting worse (as I explain below) that the most disadvantaged end of the labour market is likely to be severely impacted by the central bank policy shift.
The following table breaks the employment data down into full-time, part-time, gender and provides various time period summaries.
It is true that total employment in persons rose by a relatively modest 24.5 thousand jobs this month but 88 per cent of that rise was in part-time employment. As I discuss below this rise in part-time employment is hardly voluntary (in the sense that workers are choosing to work part-time).
Between September and October, underemployment (as measured by the ABS rose by 12.1 thousand persons). Further, unemployment rose by 11.1 thousand persons which means that broader underutilisation rose by 23.2 thousand (almost the increase in employment).
In other words, the employment growth hailed by the business and media commentators as being “strong” is about as tepid as you could imagine.
Over the last two months and this is the trend all the commentators are pushing total employment rose by 64.3 thousand (net) but 44.1 thousand of that net rise was part-time with declining hours of work on offer.
So, I don’t consider this to be a booming or even strong labour market and certainly does not in my view justify a rise in interest rates. What it tells me is that employment growth is very low relative to labour force growth and as labour productivity starts rising again (with overall growth) it will be even harder to absorb the huge build up in labour market slack.
We are even starting to hear the calls of skills shortages again coming from the business lobby who are too lazy to offer proper training slots to the now 13.5 per cent of workers who are underutilised. Instead, the debate is focusing on increasing our rates of migration. We never learn.
But overall, and I suppose I have to say something positive, the economy is growing again and that is a good sign. But an economy that produces casualised part-time jobs which do not satisfy the desired of the available workforce and fails to produce enough working hours overall to absorb that willing workforce is not a model we should be happy about.
Unemployment
While it is clear that this recession is not as severe as the last two major downturns (1982 and 1991), it is still worthwhile considering how we travelling in relation to the 1991 and 1982 episodes? Regular readers will know that I chart the progress of the unemployment against the previous two recessions (1991 and 1982) to detect similarities and differences. This helps us guage the likely direction of the labour market and also assess the impact of the two fiscal stimulus packages.
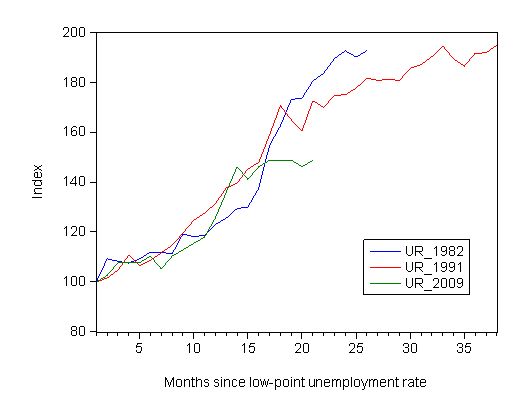
The following graph updates my 3-recessions graph. It depicts how quickly the unemployment rose in Australia during each of the three major recessions in recent history: 1982, 1991 and now 2009. The unemployment rate was indexed at 100 at its lowest rate before the recession in each case (June 1981; November 1989; February 2008, respectively) and then indexed to that base for each of the months until it peaked. It provides a graphical depiction of the speed at which the recession unfolded (which tells you something about each episode) and the length of time that the labour market deteriorated (expressed in terms of the unemployment rate).
From the start of the downturn to the 21-month point (the length of the current deterioration since February 2008), the official unemployment rate has risen from a base index value of 100 to a value 148.7. A 48.7 percent rise. At the same stage in 1991 the rise was 72.6 per cent and in 1982 80.5 per cent. So things are quote different this time.
While the unemployment rate was tracking the severity of the 1991 recession up until month 16, it is now clear that it is rising more moderately compared to the rate of decline back then. Note that these are index numbers and only tell us about the speed of decay rather than levels of unemployment. Clearly the 5.8 per cent at this stage of the downturn is lower that the unemployment rate was in the previous recessions at a comparable point in the cycle.
Underemployment
What about underemployment?
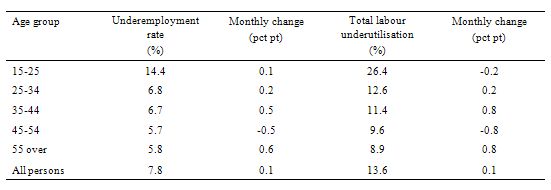
The following table was constructed from the ABS Labour underutilisation by Age and Sex data. It shows the underemployment rate and the total labour underutilisation rate (in percent) and the change in each (in percentage points) between September and October.
It should be noted that the total labour underutilisation measure is the ABS definition (unemployment and underemployment) and hence excludes hidden unemployment. We will be next updating the CofFEE Labour Market Indicators in November when the data is available next month which provides more comprehensive measures of labour wastage than those provided by this ABS data. But the ABS data is indicative.
Underemployment rose for all age groups barring the 45-54 year olds (and the improvement for the latter cohort was shared across males and females).
Overall 26.4 per cent of the 15-25 years aged group is underutilised and largely ignored by government policy. Talk about worrying about leaving a burden for our future generations. The largest problems we leave to our children is our refusal of our government to provide enough jobs for them to build capacity and careers. It is patently clear that the private sector is not providing enough work. That leaves only one sector – and they are in denial about the problem.
The ABS data also shows that total labour underutilisation rose by nearly 1 percent in the last month for 35-44 year olds, the age cohort that is likely to be carrying a significant proportion of the household debt burden. Similarly for older workers their circumstances declined dramatically over the last month.
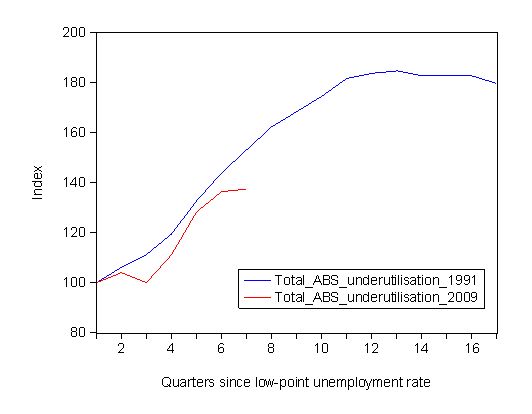
The following graph compares the 1991 and 2009 recessions on the basis of the ABS total labour underutilisation measure indexed to 100 at the low-point unemployment rate quarter. The quarterly indexes provide a broader view of the extent of the labour market deterioration.
From the start of the downturn to the 7-quarter point (the length of the current deterioration since February 2008), the ABS measure of total labour underutilisation rate has risen from a base index value of 100 to a value 137.4, a 37.4 per cent rise. At the same stage in 1991 the rise was 53.6 per cent. However, taking into account the broader measure, the difference between the two recessions is less stark.
The index numbers only tell us about the speed of decay rather than levels of labour underutilisation. We went into the 1991 recession with a total ABS labour underutilisation rate of 9.8 per cent (with the unemployment rate being 5.6 per cent). At the comparable stage in the downturn (after 7 quarters) that rate had risen to 15.9 per cent (with the unemployment component being 9.6 per cent).
In the current downturn, we began in February 2008 with a total ABS labour underutilisation rate of 9.9 per cent (with the unemployment rate being 3.9 per cent). This has now risen (after 7 quarters) to be 13.6 per cent (with the unemployment component being 5.8 per cent).
So you can see why I have been calling this the underemployment recession.
Conclusion
All the talk in Australia among the commentators and business economics now is that the government has to engage in policy contraction. The expectation (and all the chatter) is that the RBA will push rates up by 0.25 per cent in December (a 0.75 per cent rise since September). I guess they will but they should not have started hiking in the first place.
Clearly from a modern monetary theory’s perspective the data released today confirms in my mind the need for a further fiscal stimulus focused on direct job creation.
Any chance of that? Sadly, none at all.


Do not worry Bill , a public apology to this “stolen generation” will be given 50 years from now