I haven't provided detailed commentary on the US labour market for a while now. To…
There is nothing good in today’s labour force data
The glow from last week’s National Accounts figures is now gone with the yesterday’s Retail Sales data and today’s Labour Force data showing that the Australian economy is far from being healthy and might better be termed hanging on by the skin of its teeth with strong fiscal support. The data also confirms why I am now calling this the underemployment recession. I could use this blog to show further flaws in the Austrian School’s approach to the labour market but I will leave that theme until another time.
The Labour Force summary facts for the seasonally adjusted data are:
- Total employment is now decreasing (a net 27,100 jobs lost in the last month) – and the trashing of full-time employment continues (net 30,800 jobs lost in the last month) while part-time employment increased by 3,800.
- Total unemployment decreased by 2,100 persons and the unemployment rate was steady at 5.8 per cent.
- The Labour Force Participation Rate fell by 0.3 percentage points.
- Total monthly hours worked continue to plummet – falling 4.0 million hours in the last month.
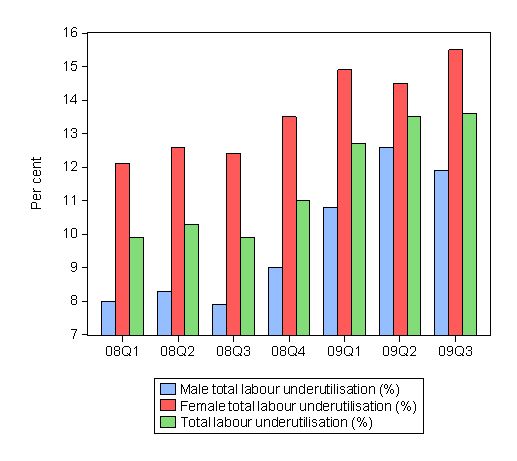
- The ABS Total Labour force underutilisation rate (sum of official unemployment and underemployment) continued to increased and is now 13.6 per cent. So with the unemployment rate constant, underemployment continues to rise. The male labour force underutilisation rate is at 11.9 per cent and the female labour force underutilisation rate is at 15.5 per cent.
So whichever way you want to spin a story the trends and the outcomes are very severe.
Many journalist have rung me today and asked the same question (more or less) – With the unemployment rate constant and official unemployment falling isn’t that a great outcome?
My reply has been that falling unemployment may not be a good sign if the participation rate is falling off. This tells me that hidden unemployment is rising and from a significance perspective there is not difference between a person who is unemployed and a person who is hidden unemployed. They both would take a job if it was offered. The fact that the ABS counts one in the labour force and the other not in the labour force is a statistical artefact only.
I know the neo-liberals think that activism is a sign of commitment. So the hidden unemployed demonstrate by their lack of job search that they are not committed to work. I disagree totally.
The human condition is frail and when vacancies are non-existence and you do not need to satisfy the ABS survey conditions for being classified as unemployed (search and willingness) to get any benefits, then why would you want to face continual rejection from employers (most of which don’t even bother answering your job applications).
So today’s stable unemployment rate is not a good sign in that respect.
Also when you examine the employment side of the labour market you quickly see that full-time employment is being trashed very quickly. The combination of negative employment growth (over the last year) and declining participation rates in the last few months is the sign of a weak labour market. Sometimes unemployment rises indicate a strengthening labour market because participation increases are outstripping employment growth.
But now we have the opposite. The decline in participation is faster than the drop in employment and so unemployment falls.
Overall not the time the central bank should be even talking about tightening monetary policy, not that a deteriorating labour market is anything that has bothered them much in the past.
Hours gap
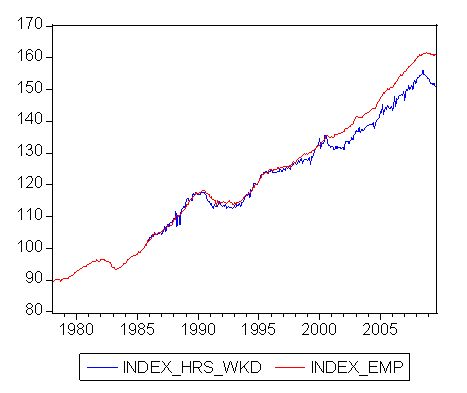
The plunge in aggregate monthly hours worked continues. The following graph updates the data from earlier blogs and show the growing discrepancy between total employment in persons and total hours worked.
How does the Australian labour market adjust?
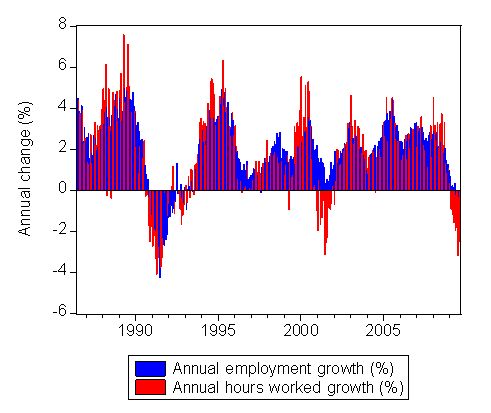
I think the next graph is particularly interesting. The red bars represent the annual growth (%) in hours worked while the blue bars are the annual growth (%) in employment since July 1986. You get a very graphic representation of the way the labour market adjusts and the way that adjustment pattern is changing over time as more casual employment is created relative to full-time.
In the 1991 recession, it was hours that were cut first as firms waited to see if the drop in revenue was going to last. Once the recession deepened they started to lay off workers. Since then the adjustments have been dominated by hours-adjustments. In the brief 2000 downturn (one quarter of negative GDP growth in December 2000), all the adjustment was in hours as persons employed continued to grow.
What this means is that underemployment is now the preferred method of dealing with fluctuations in revenue within a particular range.
And more recently, since the current downturn began (February 2008), employment growth in persons has been positive until June 2009 but there has been a large shedding of hours worked.
This is why I am calling this recession our first underemployment recession. I am sure if the fiscal intervention had not have been as early and as significant, we would have followed the same pattern as in 1991. But what the fiscal stimulus has done is to worsen underemployment. It is moot whether this is better
than seeing unemployment rise.
It will lock this underemployment in. It is as damaging to those who are on the margin of solvency with respect to their nominal contractual commitments. But on the other side, the workers are still getting some hours and income which probably beats unemployment.
But the message I keep getting from this data is that the government is not doing enough with respect to fiscal policy to stop this labour wastage from mounting.
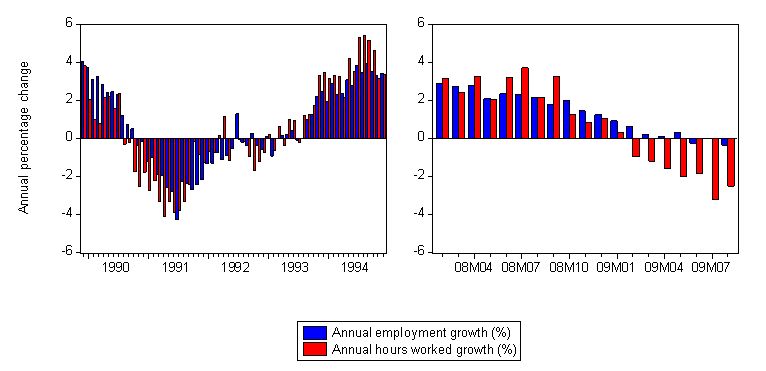
To compare the two recessions (1991 and 2009) in more detail I assembled the following graph. It shows the adjustments in hours and employment from December 1989 to December 1994 (so you see the descent into the trough and the early recovery period) in the left panel and the same adjustments from February 2008 to August 2009 in the right panel (the starting points were the low-point unemployment months).
The vertical axis scales are identical for comparison.
So as the economy was dying in 1990 firms started quickly cutting hours worked but very soon after (by December 1990) employment overall fell. In the recovery phase, you can see that firms were adjusting hours upwards faster than persons employed which is one of the reasons that unemployment kept rising throughout this period. There was so much slack in the system that employment growth was very weak for several years.
In the current recession the pattern looks similar but at the same stage (April 1991) employment had already started to fall significantly. At present employment is only showing minor falls. The pattern is not much different if I took month-to-month percentage changes.
Broad underutilisation increases
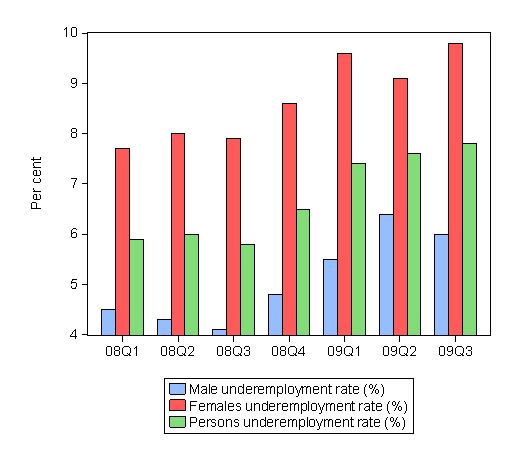
As noted above, the ABS Labour Underutilisation series increased in the third quarter of 2009. Which means that underemployment is rising along with unemployment. The ABS estimate that 7.8 per cent of workers who are classified as employed (remember you only have to work one hour per week to be so classified) are now underemployed.
This means they desire more hours of work than they can get. The CofFEE measures (which are in hours rather than persons) estimates this to be around 5 per cent at present which suggests that most of the underemployed desire full-time or close to full-time work.
On this morning’s Radio National Breakfast program, Gary Morgan (from the Morgan polling company) said that their polling was suggesting that:
… there’s 14.4 per cent of the population who are unemployed or under-employed, and an under-employed person is a person who wants more work … In other words, they work say one hour. The ABS says that a person’s employed if they work one hour in the reference week when they survey. We say there are many people who are working one, two, three or four hours who’d like to work many more hours, but there are not jobs available for them.
That is clear and has been since the 1991 recession when underemployment really became a problem in Australia. Throughout the growth period underemployment has hovered (in ABS persons measure) around 6.8 per cent on average.
Of-course the ABS measure doesn’t include the hidden unemployed and I currently estimate that to add about 1.6 per cent to the total labour underutilisation rate. So while the ABS estimate total labour underutilisation to be 13.6 per cent, once you add those who have left the labour force but want to work (the discouraged workers) the broad estimate of total labour underutilisation is closer to 15.2 per cent.
Think about that for a moment before concluding we have a miracle economy. The latest estimates from the US for similar concepts place their labour underutilisation rate around 16.5 per cent. We are really splitting hairs to think we are that much better off here.
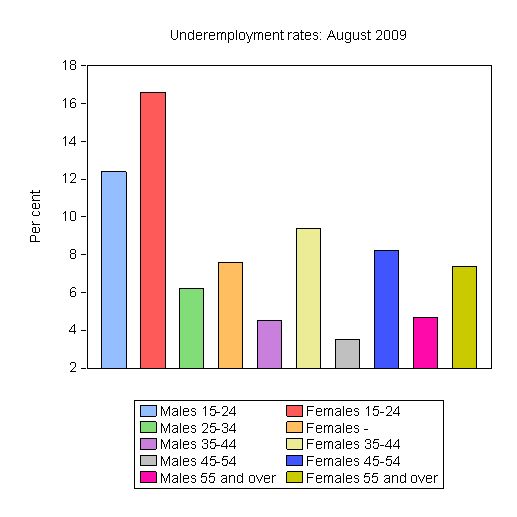
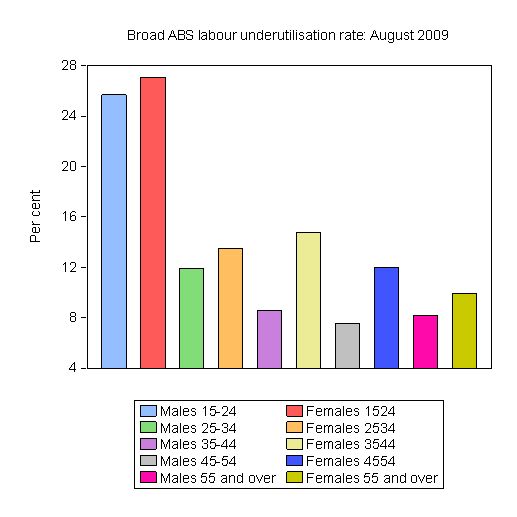
So who is underemployed? The following graph shows the ABS underemployment rate (%) at August 2009 by Age and Gender. It shows that the 15-24 year olds are bearing the brunt of it, particularly females.
In terms of the evolution of underemployment over the course of this downturn (since February 2008) the following graph (quarterly data) shows how the hours shedding impacted initially on females but over the last several quarters the problem is generalising.
What about the ABS Total Labour Underutilisation estimates which sums unemployment and underemployment? The following graph shows the ABS Total Labour Underutilisation rate (%) at August 2009 by Age and Gender. As expected, 15-24 year olds are bearing the brunt of it, particularly females. 27.1 per cent of young females and 25.7 per cent of young males are either unemployed or underemployed.
If we are worried about the rising dependency ratio and the intergenerational challenges in front of us then casting our youth off in this sort of fashion from skills development, stable work and incomes is the worst thing we could do. This parlous state arises from the on-going failure of fiscal policy to provide enough jobs and sufficient working hours for those who want them. It stands as our greatest failure as a modern state.
In terms of the evolution of ABS Total Labour Underutilisation estimates over the course of this downturn (since February 2008) the following graph (quarterly data) shows how the hours shedding and unemployment rises has followed a similar pattern to that displayed by underemployment.
Conclusion
This should cruel all those that are daily writing that it is time for the central bank to push up interest rates. It also should cruel those who are calling for the stimulus packages to be “called in”.
What the data tells me is that while there are signs that output growth has resisted a technical recession and may even have reached the floor in the current cycle, the labour market is still in decline. Although this downturn is clearly different to the 1991 free-fall and we have only fiscal policy to thank for that, the broader labour underutilisation measures are fairly dire, especially for young Australians and prime-age females.
Further, the trashing of full-time jobs and the rising underemployment among males is a major worry. There is so much slack in the labour market now that it will take a few years to catch back up. With the debt levels that many Australian households are currently carrying the sharp decline in working hours is as bad as losing one’s job.
I repeat my call for a third employment-focused stimulus.
I will have more to say about this tomorrow.
Bill, this is why bernanke has been talking about a jobless recovery. In any case the technical output growth is probably inventory driven.
Also in relation to miracle economies, consider the demographics. The following links show USA and Oz population pyramids for 1990,1995, 200,2005,2010,2020, 2050.
http://www.nationmaster.com/country/as/Age_distribution
http://www.nationmaster.com/country/us/Age_distribution
Note the bulge in the mid age range showing the passing demographic wave of the baby boom. The widest point of population bulge (it is no longer pyramid shaped) in 2005 in the USA was in 40-50 age group. In oz in 2005 the widest point of the bulge is in the 35-40 age group. The demographics of oz are trailing that of the US by about 5-10 years. I predict that when oz demographics roughly match those currently found in the US, the miracle will be well and truely over. Likewise the japanese were well ahead and their miralce has long since evaporated.
The miracle (or more properly, demographic dividend) occurs IMO when the largest percentage of the population is in the prime earning and spending range aged 30-50. After age 50, while earnings may remain robust savings would be increased. That is, the demographic dividend is more like a loan, which must be repaid, except policymakers of our time have not realised that. Hence, banking crises.
Finally scroll down to the 2050 pyramids and the picture is universally scary. These latter stages should correspond to much stronger labour market given the paucity of the picture at the bottom of the pyramids from 2020-2050, but probably within the context of declining real capacity.
I make these points firstly because I thiink them highly relevant to disucssions on employment and output (especially when comparing nations) and also in the long run to expectations. From a chartalist viewpoint it seems expectations of the future are critical. Sooner or later the reality of the demographic future will be better understood among normal consumers and taxpayers, and that seems to me to carry potential implications for ricardian equivalence and intergenerational equity questions which which are central to your way of thinknig about deficits.
Hi Bill
Can you help me grasp something which I’m sure is probably quite simple? How does the participation rate affect the unemployment rate? I’ve always assumed that the unemployment rate was a percentage of the total labour force but that doesn’t make sense (to me) if the participation rate affects the unemployment rate. Is the participation rate a factor in the calculation of the unemployment rate?
Also, how does the ABS know that people have given up looking for work? Do they ask a question relating to this?
You say in this article: ‘The human condition is frail and when vacancies are non-existence and you do not need to satisfy the ABS survey conditions for being classified as unemployed (search and willingness) to get any benefits, then why would you want to face continual rejection from employers (most of which don’t even bother answering your job applications).’
I agree with what you are saying about the demoralising effects of constant rejection, but Centrelink and its outsourced compliance arm, Job Services Australia, are not as compassionate or understanding as you are. Job seekers are subjected to rigorous job search requirements and must be applying for work in order to qualify for Newstart Allowance. Some categories are excepted, but most unemployed people have to be actively looking for work, even if they have given up hope of actually getting a job. Knowing this adds to my confusion about how people identify the group who have given up looking. Perhaps some pensioners and self-funded retirees have stopped looking for a bit extra on the side, but those people don’t have job search requirements like unemployed people do.
There is one factor that is probably keeping the unemployment rate flat. My understanding is that job seekers who are doing training courses are temporarily excused from job search obligations for the duration of the course. I will check this with Centrelink next week. So, unemployed people who are receiving Newstart Allowance (and those who are not) who are doing training courses will answer ‘No’ when the ABS rings them and asks them if they are looking for work, and ‘No’ when they ask if they are available to start a job in the next week (or whatever the question is). This group is not counted as unemployed and it must be significant in size, and getting larger.
The government has recently expanded access to training courses for unemployed people. Putting aside the issue of whether this is of any value at all to most jobseekers, my cynical view is that their main agenda with that is to help keep the unemployment rate artificially lower than it really is.
Thanks for all your great work on this topic. It is great to see you getting more publicity.