Economics and business correspondents regularly serve as apologists for poor policy. Their motivation is to…
Inflation rises in Australia – but transitory factors and natural disasters are the reason
Today, my on-going inflation watch turns to Australia, given the release today (July 28, 2021) of the latest – Consumer Price Index, Australia – for the June-quarter 2021. The data is consistent with what we are seeing across many nations as supply chains are disrupted by the pandemic. Energy prices are adjusting back upwards and because the base from which we are judging these quarterly rises was lower as a result of price suppression during the downturn, the recovery in the pre-pandemic price levels deliver larger than usual price increases (when the base is higher). In Australia’s case, a major recent flood and a long drought before that have also complicated matters by driving up food prices. All these impacts are transitory. The CPI rose by 0.8 per cent in the June-quarter 2021 and over the 12-months to June 2021 it rose 3.8 per cent. But the key to understanding the trends in the data is to appreciate that the less volatile series were still rising at rates below the RBAs inflation targetting range – the Trimmed Mean rose just 0.5 per cent and the Weighted Median rose 0.5 per cent. So nothing to see here. The most reliable measure of inflationary expectations are flat and below the RBA’s target policy range.
The summary Consumer Price Index results for the June-quarter 2021 are as follows:
- The All Groups CPI rose by 0.8 per cent.
- The All Groups CPI rose by 3.8 per cent over the 12 months to the June-quarter 2021.
- The major determinant was the 6.5 per cent rise in automotive fuel.
- The Trimmed mean series rose by 0.5 per cent in the June-quarter 2020 and by 1.6 per cent over the previous year (steady).
- The Weighted median series rose by 0.5 per cent in the June-quarter 2020 and by 1.7 per cent over the previous year (steady).
The ABS Media Release notes that:
Rising fuel prices accounted for much of the increase in the June quarter CPI, with prices surpassing pre-pandemic levels …
The most significant price rises in the June quarter were automotive fuel (+6.5 per cent) and medical and hospital services (+2.4 per cent) due to the annual increase in private health insurance premiums. Electricity prices (+3. 3 per cent) also rose due to the continued unwinding of the Western Australian Government’s $600 electricity credit …
The annual CPI movement was significantly influenced by COVID-19 related price changes from this time last year. Key drivers included the full unwinding of the Federal Government’s free childcare package implemented in the June quarter last year, as well as a full return from the drop in fuel prices seen in the same quarter. …
So, note first, that movements in the CPI are strongly influenced by administrative decisions (policy) taken by government in the form of excises, indexed adjustments and other more ad hoc policy shifts.
In this case, reversals of COVID support payments and the annual government-approved increases to private health insurance premiums.
Thus, administrative decision not related to the balance between aggregate spending and the productive capacity of the economy to meet that spending through the provision of goods and services can shift the inflation rate
Which means that all those who argue that Modern Monetary Theory (MMT) is fatally flawed because the only defence against any inflationary effects of fiscal deficits are tax hikes, which might be politically difficult to introduce at certain times, haven’t really understood the full array of tools available to a government that is intent on controlling an inflationary outbreak.
The other point to note is that inflation has not surged in Australia, despite the Reserve Bank of Australia purchasing $A68,250 million worth of federal government bonds in secondary markets and $A11,098 million worth of state/territory government debt since March 2020.
Since January 2018, the RBA has increased its holdings of Australian government securities (debt) from $3,748 million to $181,747 million, a massive increase.
In other words, the central bank has been significantly funding government spending at both federal and state levels.
No structural inflationary pressures evident.
Which accords with the historical record where central banks in Europe, the UK, Japan, the US have been engaged in large-scale bond purchases and inflation is benign, and, in Japan’s case, has been for 30 years.
Trends in inflation
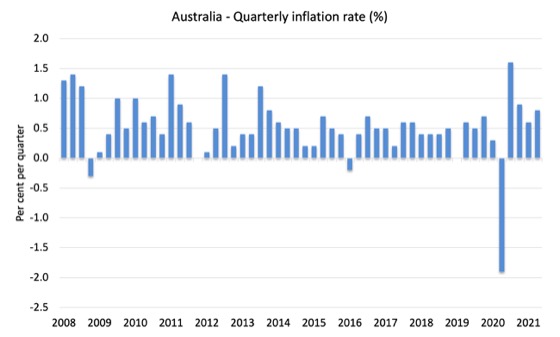
The headline inflation rate increased by 0.8 per cent in the June-quarter 2021 and 3.8 per cent over the 12 months. But the rise is transitory (mostly an adjustment in fuel prices as transport resumes).
There is no upward trend in the inflation rate evident.
The following graph shows the quarterly inflation rate since the June-quarter 2008.
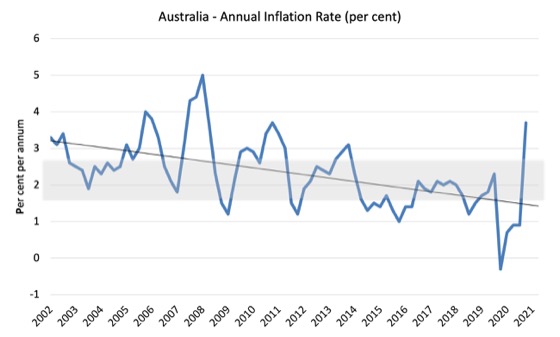
The next graph shows the annual headline inflation rate since the first-quarter 2002. The black line is a simple regression trend line depicting the general tendency. The shaded area is the RBA’s so-called targetting range (but read below for an interpretation).
The trend inflation rate is quite steeply downwards.
Once we take out the so-called ‘volatile’ items (such as, food and fuel), the annual inflation rate is only 1.6 per cent. Well below the RBA’s target range.
What is driving inflation in Australia?
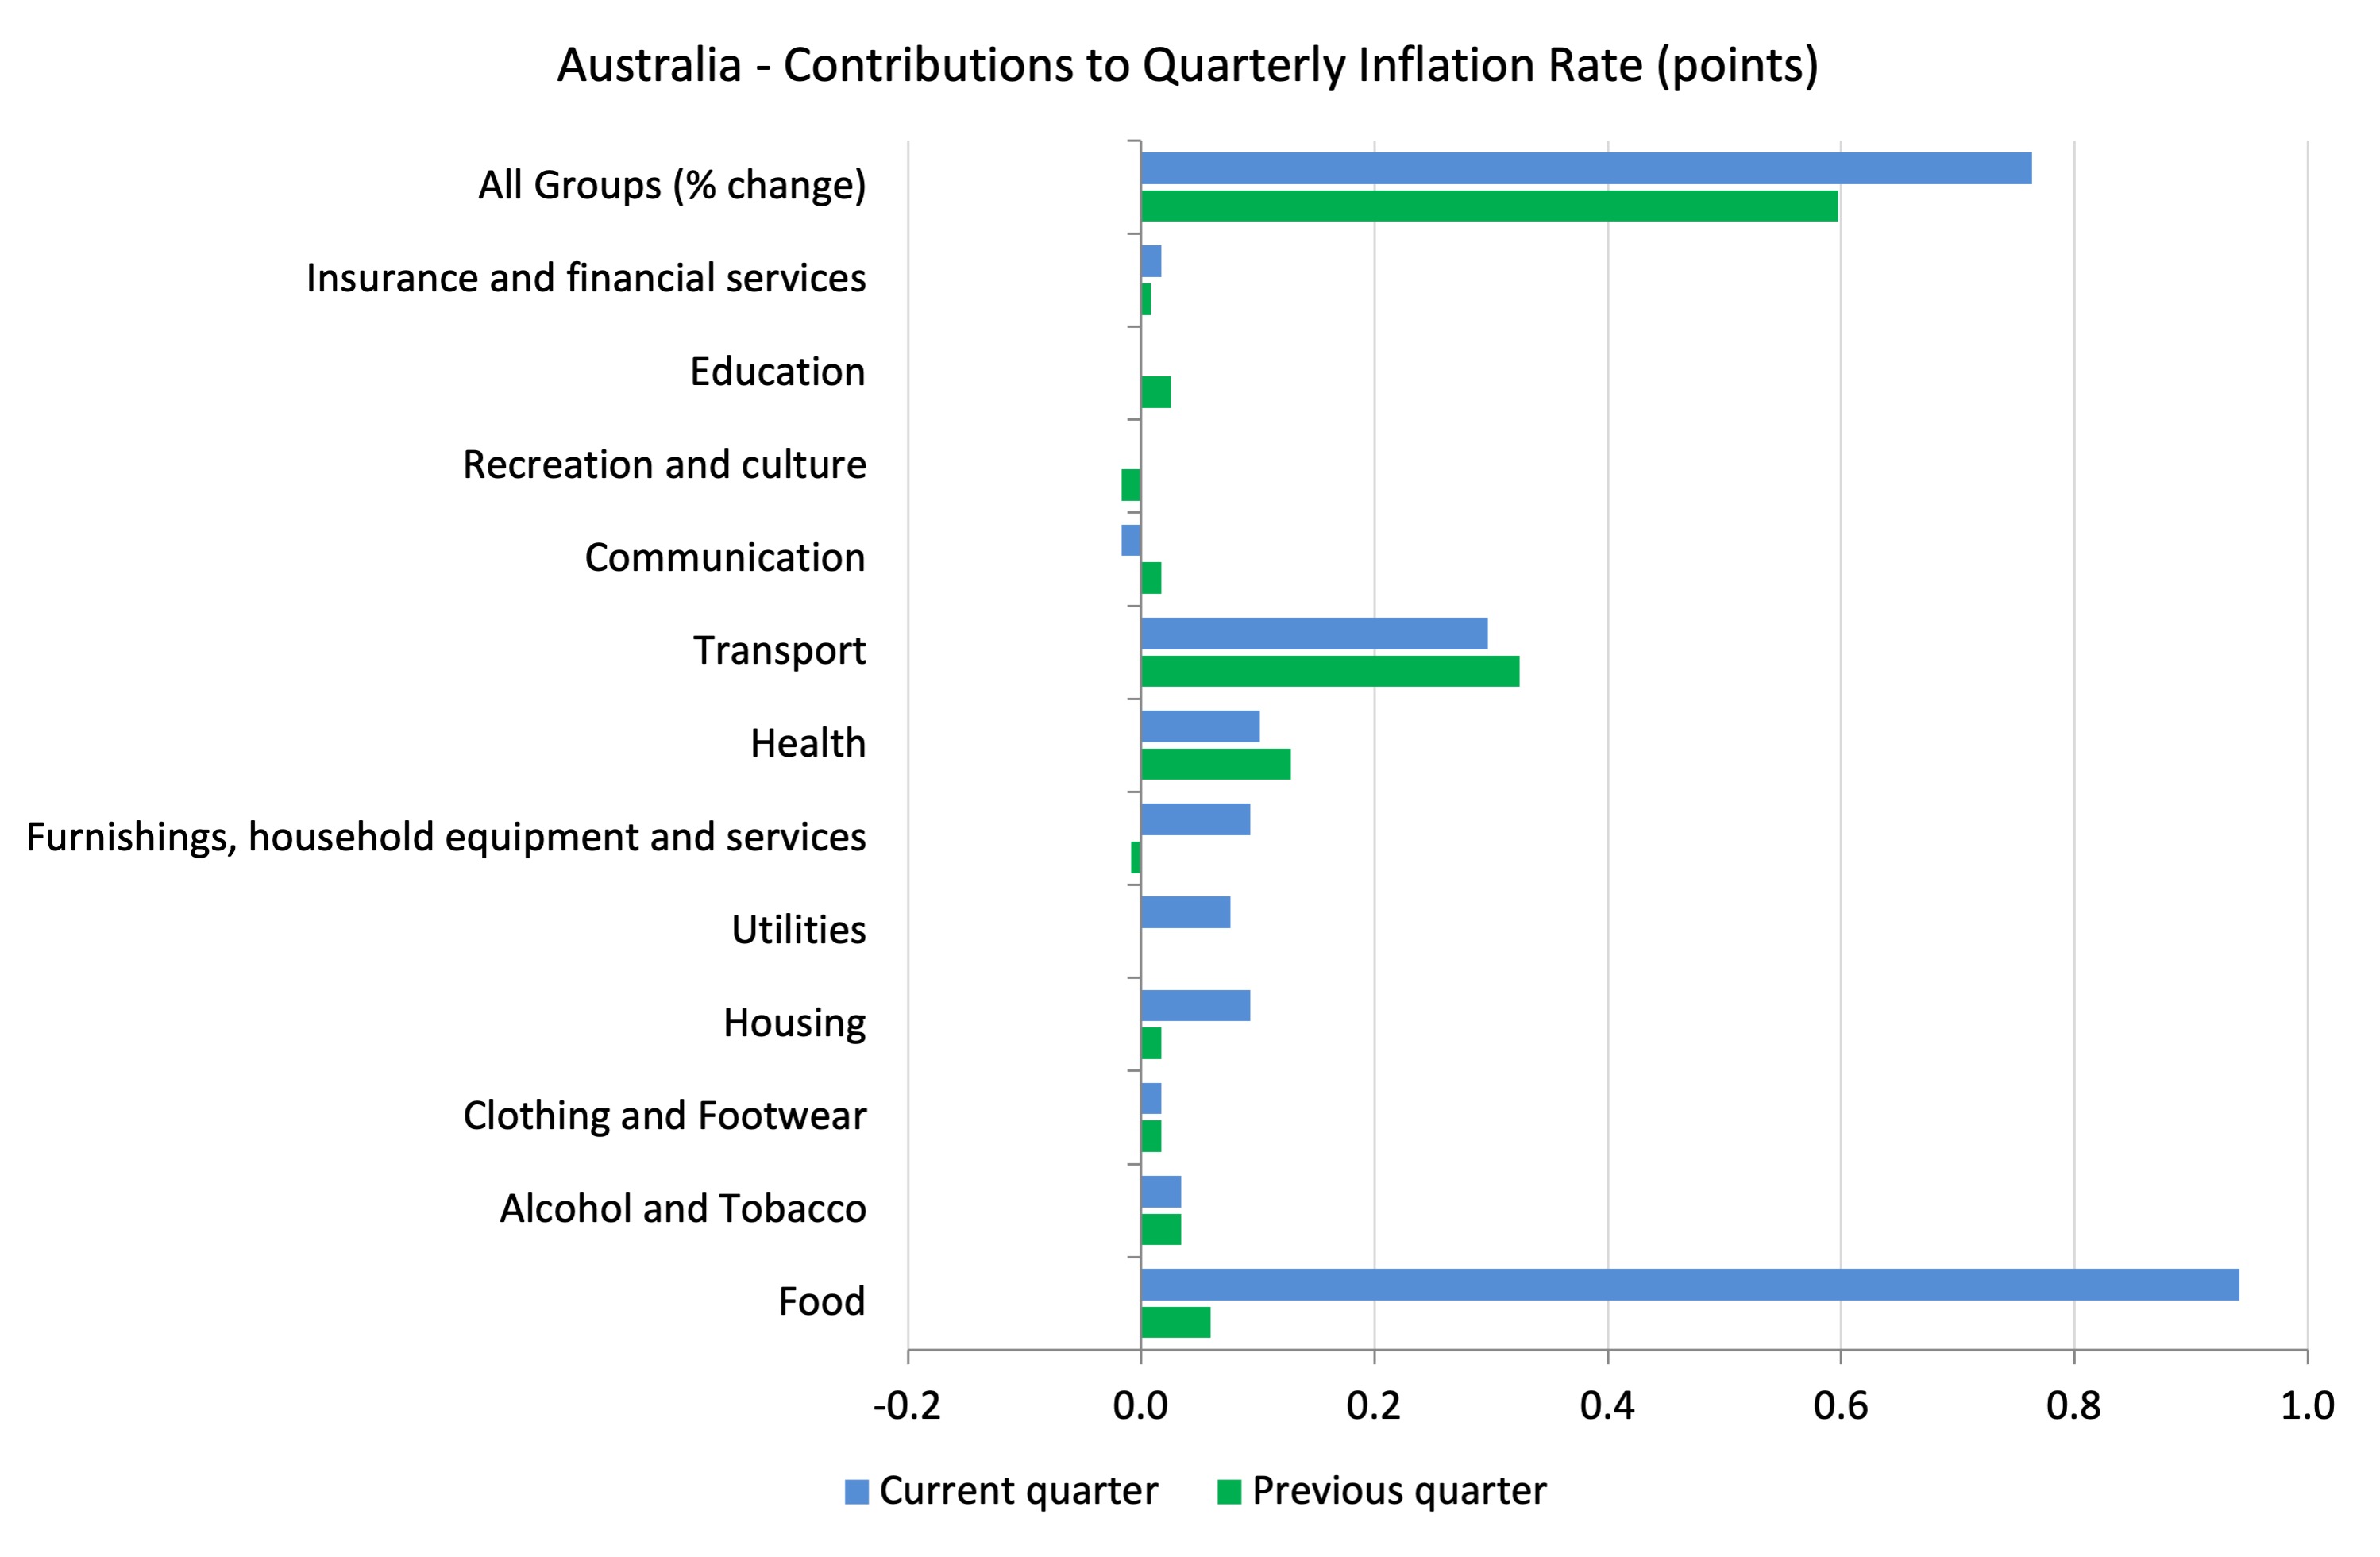
The following bar chart compares the contributions to the quarterly change in the CPI for the June-quarter 2021 (blue bars) compared to the March-quarter 2021 (green bars).
Note that Utilities is a sub-group of Housing.
The rise in food prices has arisen because of the extensive flooding in the food-growing areas earlier this year, a temporary shortage of farm workers dur to international border closures and the fact that the farms are rebuilding cattle herds after a long drought.
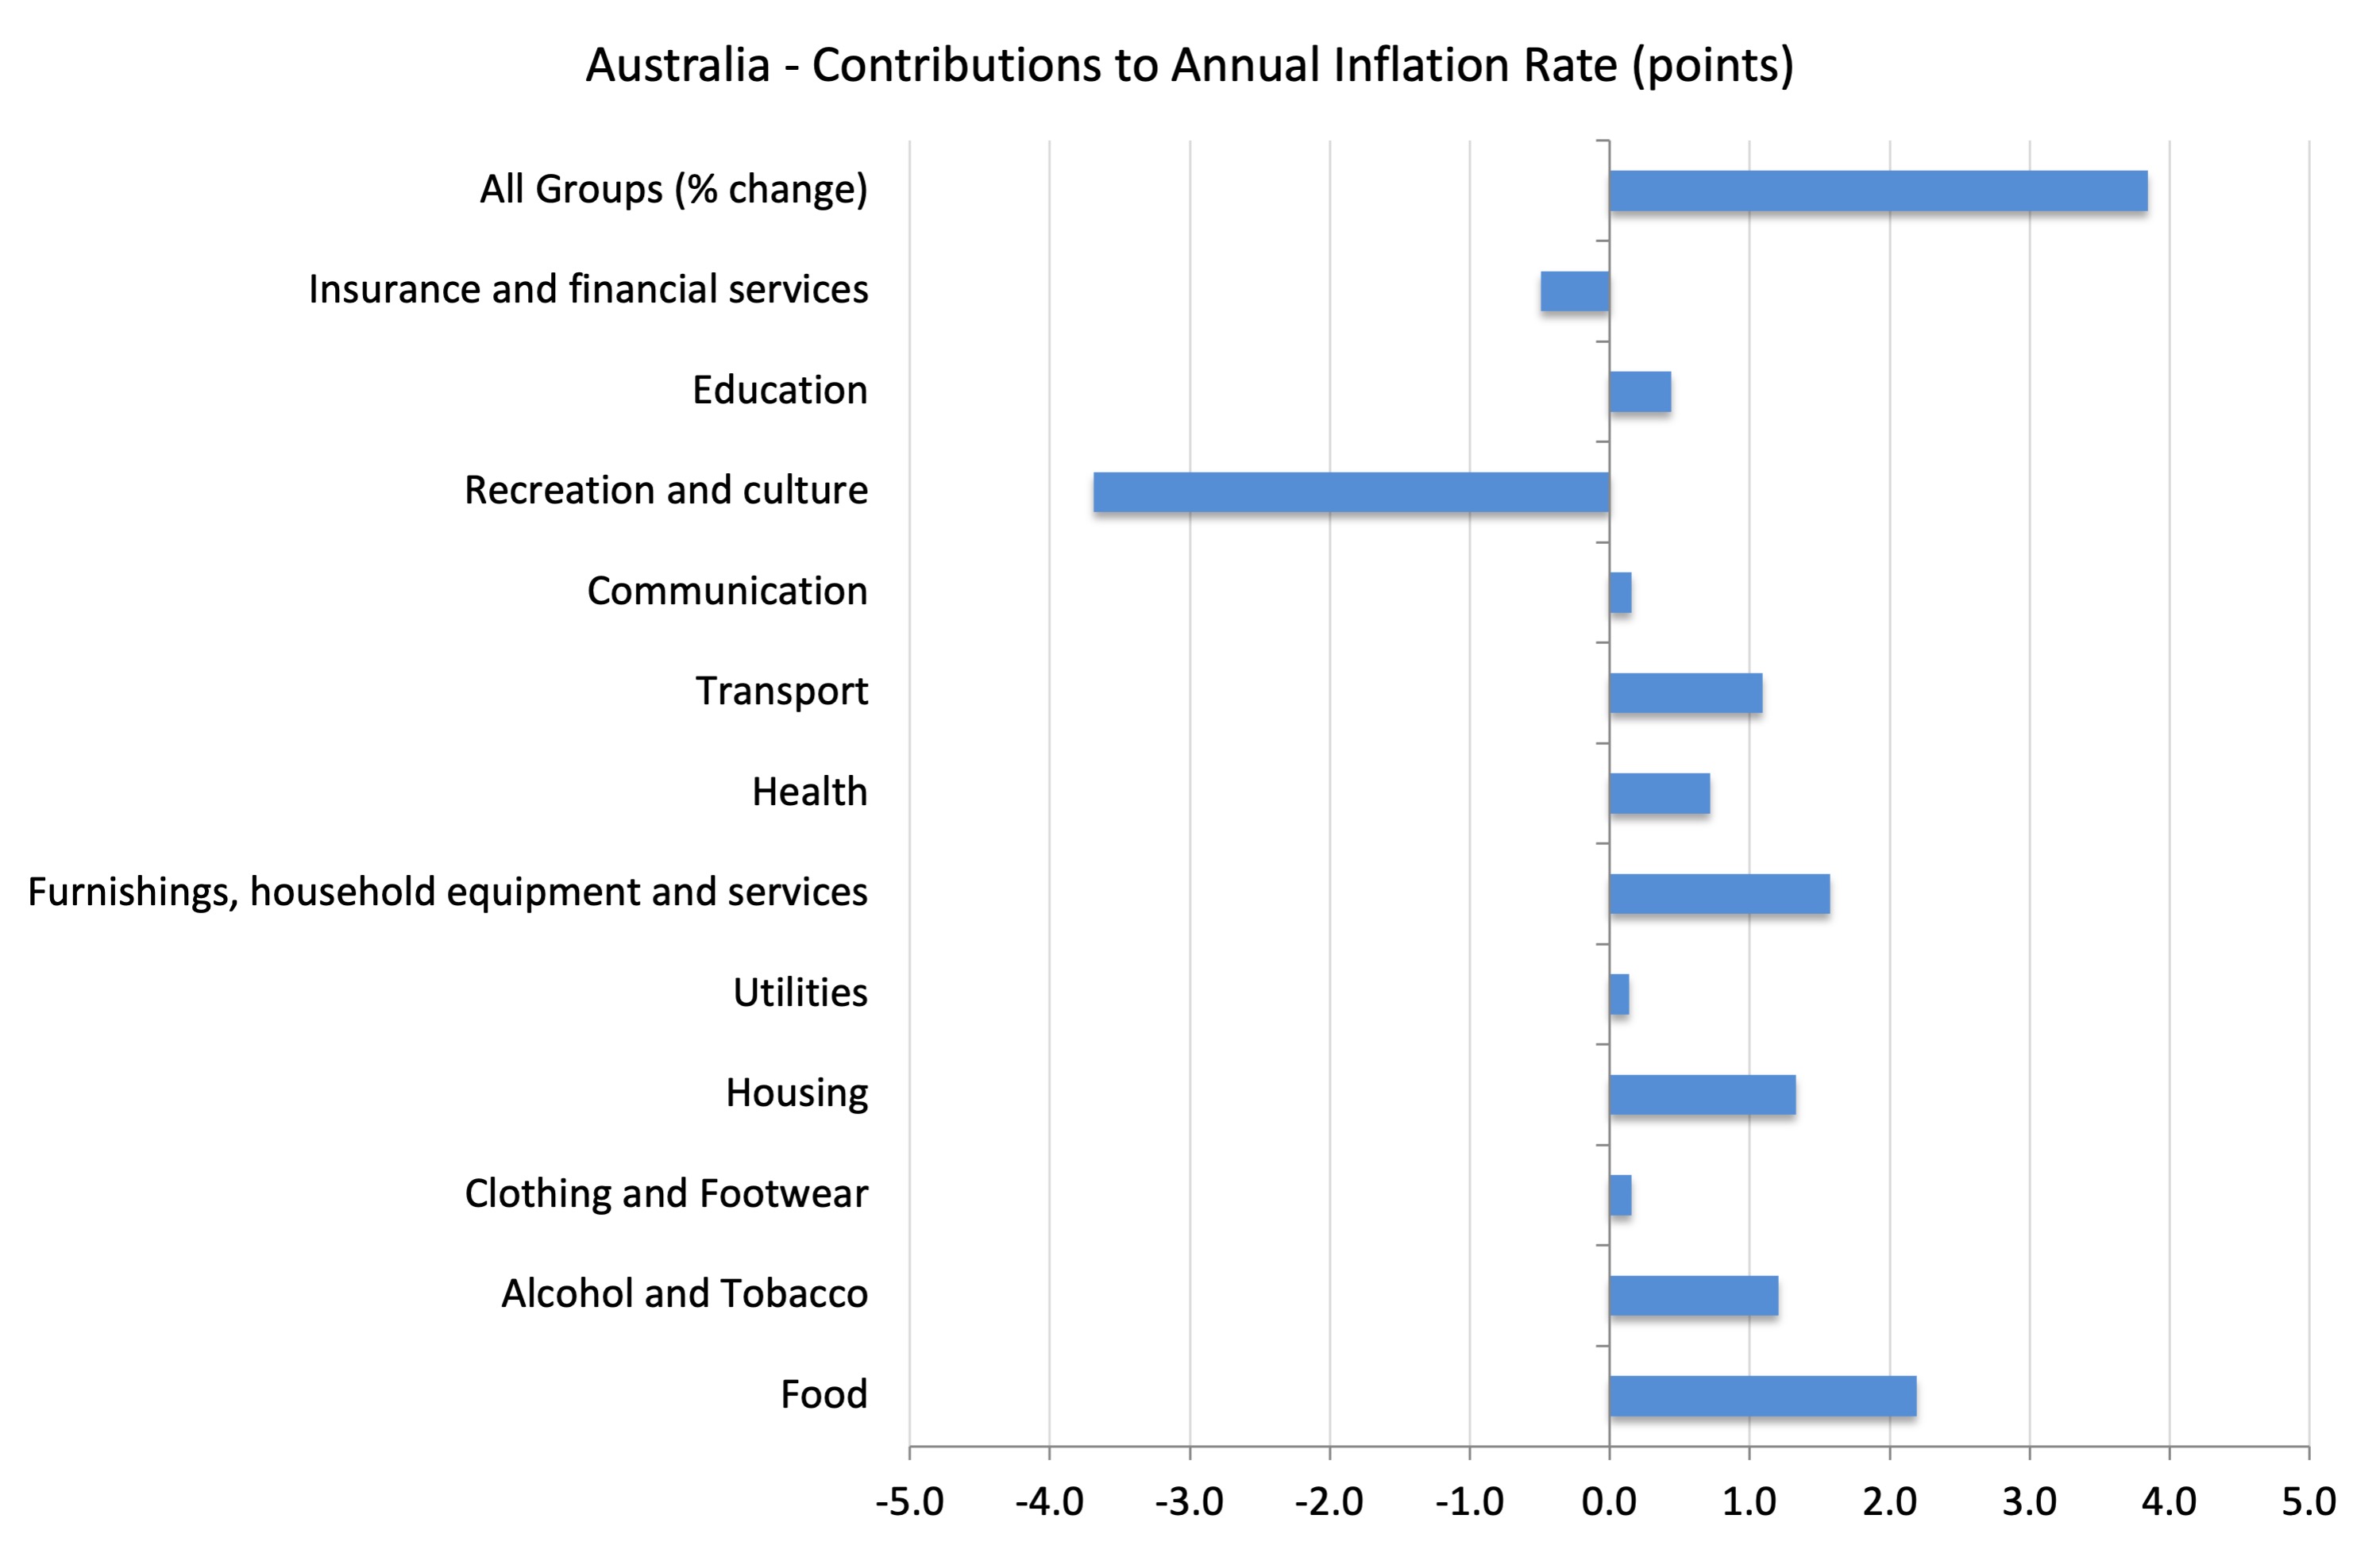
The next graph provides shows the contributions in points to the annual inflation rate by the various components.
Inflation and Expected Inflation
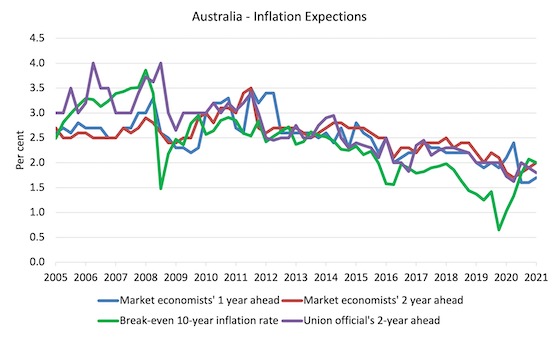
The following graph shows four measures of expected inflation expectations produced by the RBA – Inflation Expectations – G3 – from the June-quarter 2005 to the June-quarter 2021.
The four measures are:
1. Market economists’ inflation expectations – 1-year ahead.
2. Market economists’ inflation expectations – 2-year ahead – so what they think inflation will be in 2 years time.
3. Break-even 10-year inflation rate – The average annual inflation rate implied by the difference between 10-year nominal bond yield and 10-year inflation indexed bond yield. This is a measure of the market sentiment to inflation risk.
4. Union officials’ inflation expectations – 2-year ahead.
Notwithstanding the systematic errors in the forecasts, the price expectations (as measured by these series) are trending down in Australia, which will influence a host of other nominal aggregates such as wage demands and price margins.
While the business inflation expectations for 3 months ahead is 2.8 per cent, one- and two-year ahead expectations are well below the lower band of the RBA targetting range (2 per cent).
It is well known that the ‘market economists’ systematically get movements in the economy wrong and one wonders if their organisations actually bet money on their analysis!
The most reliable measure – the Break-even 10-year inflation rate – is now at 2.0 per cent, around the lower bound of the RBA targetting range and down from 2.1 per cent in the March-quarter 2021.
It has been at or below the lower bound of the RBA’s policy target range since the June-quarter 2018.
The other expectations are still lagging behind the actual inflation rate, which means that forecasters progressively catch up to their previous forecast errors rather than instantaneously adjust, a further piece of evidence that refutes the mainstream economics hypothesis that decision makers use ‘rational expectations’ (that is, on average get it right).
Implications for monetary policy
What does this all mean for monetary policy?
Clearly, the market economists were punting on a rise in the interest rate and have only started to realise in the last few quarters that this is unlikely to happen any time soon (as disclosed by their inflationary expectations above).
The private banking economists that are continually wheeled out in the media to comment on prospective interest obviously talk up interest rate rises because their organisations benefit, which poses the question as to why they are used in this way and held out as independent authorities.
But, the inflation trends provide no basis for any expectation that the RBA will hike interest rates anytime soon.
The Consumer Price Index (CPI) is designed to reflect a broad basket of goods and services (the ‘regimen’) which are representative of the cost of living. You can learn more about the CPI regimen HERE.
Please read my blog post – Australian inflation trending down – lower oil prices and subdued economy – for a detailed discussion about the use of the headline rate of inflation and other analytical inflation measures.
The RBA’s formal inflation targeting rule aims to keep annual inflation rate (measured by the consumer price index) between 2 and 3 per cent over the medium term. Their so-called ‘forward-looking’ agenda is not clear – what time period etc – so it is difficult to be precise in relating the ABS data to the RBA thinking.
What we do know is that they do not rely on the ‘headline’ inflation rate. Instead, they use two measures of underlying inflation which attempt to net out the most volatile price movements.
But, in recent months, the RBA has signalled that it is moving towards the way the US Federal Reserve Bank has shifted into prioritising low unemployment and waiting before inflation becomes an issue.
To understand the difference between the headline rate and other non-volatile measures of inflation, you might like to read the March 2010 RBA Bulletin which contains an interesting article – Measures of Underlying Inflation. That article explains the different inflation measures the RBA considers and the logic behind them.
The concept of underlying inflation is an attempt to separate the trend (“the persistent component of inflation) from the short-term fluctuations in prices. The main source of short-term ‘noise’ comes from “fluctuations in commodity markets and agricultural conditions, policy changes, or seasonal or infrequent price resetting”.
The RBA uses several different measures of underlying inflation which are generally categorised as ‘exclusion-based measures’ and ‘trimmed-mean measures’.
So, you can exclude “a particular set of volatile items – namely fruit, vegetables and automotive fuel” to get a better picture of the “persistent inflation pressures in the economy”. The main weaknesses with this method is that there can be “large temporary movements in components of the CPI that are not excluded” and volatile components can still be trending up (as in energy prices) or down.
The alternative trimmed-mean measures are popular among central bankers.
The authors say:
The trimmed-mean rate of inflation is defined as the average rate of inflation after “trimming” away a certain percentage of the distribution of price changes at both ends of that distribution. These measures are calculated by ordering the seasonally adjusted price changes for all CPI components in any period from lowest to highest, trimming away those that lie at the two outer edges of the distribution of price changes for that period, and then calculating an average inflation rate from the remaining set of price changes.
So you get some measure of central tendency not by exclusion but by giving lower weighting to volatile elements. Two trimmed measures are used by the RBA: (a) “the 15 per cent trimmed mean (which trims away the 15 per cent of items with both the smallest and largest price changes)”; and (b) “the weighted median (which is the price change at the 50th percentile by weight of the distribution of price changes)”.
Please read my blog – Australian inflation trending down – lower oil prices and subdued economy – for a more detailed discussion.
So what has been happening with these different measures?
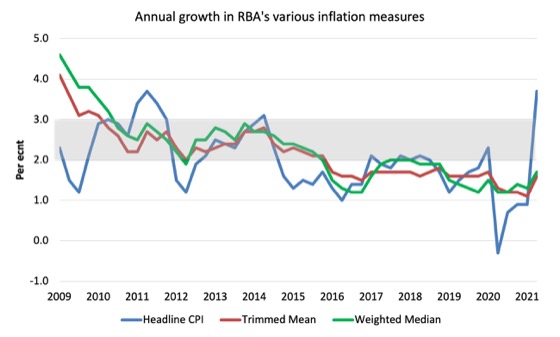
The following graph shows the three main inflation series published by the ABS since the June-quarter 2009 – the annual percentage change in the All items CPI (blue line); the annual changes in the weighted median (green line) and the trimmed mean (red line).
The RBAs inflation targetting band is 2 to 3 per cent (shaded area). The data is seasonally-adjusted.
The three measures are all currently below the RBA’s targetting range:
1. CPI measure of inflation rose by 3.8 per cent.
2. The RBAs preferred measures – the Trimmed Mean (1.6 per cent) and the Weighted Median (1.7 per cent) – are well below the lower bound of the RBAs targetting range of 2 to 3 per cent.
How to we assess these results?
First, once we take out the once-off or temporary influences on the general price level, we are left with a relatively stable trend in the non-volatile measures.
The “core” measures used by the RBA have been benign for many quarters even with an on-going significant fiscal deficit, record low interest rates, and the newly introduced QE program.
Remember, that during the early months of the pandemic, prices dropped (as they often do during a recession).
That lowers the base level of prices, which makes any price rises that follow look larger than they actually are once we stabilise for the cycle.
As firms adjust the prices upward again to their more usual levels, clearly there is a jump in the inflation rate as that adjustment is underway.
But that is not an on-going issue.
Second, inflationary expectations are benign.
Conclusion
Even with the larger fiscal deficits, record low interest rates and a central bank engaging in QE, inflation continues to be benign in Australia.
The major sources of price increases are temporary – adjustments back to pre-pandemic levels or the product of flooding and drought.
That is enough for today!
(c) Copyright 2021 William Mitchell. All Rights Reserved.
I hope your analysis also applies to the U.S. I promised to apologize to Larry Summers for some of the less than flattering things I said about his opposition to Covid relief spending here if it turned out he was right about inflation for a change. And I really, really, really do not want to apologize to him even if he has no idea who is apologizing or for what. Which is hopefully the case if it turns out an apology is owed.
Kind of technical question- in the U.S. there have been many reports that used car prices are way up and that those are a significant part of increased inflation here. So I am a little confused because sales of used cars would not be part of GDP statistics? But still count for CPI statistics? If someone could help me out on this detail of accounting.
There has also been a lot of reports that computer chips are in short supply and that this has been holding back new car production to an extent. But in keeping with what Bill has said- prices on new cars have not escalated to the same extent as used cars. I assume manufacturers are interested in maintaining market share as opposed to raising short term prices immediately?
People are buying used cars because new cars are not available. This is a short term thing, manufacturers will be able to resume production in due course. In effect cars are being bought twice, at new car prices….
The other two measures of inflation lag behind the headline. They tend to be high in recessions and low in recoveries and expansions. Supply chain problems are also being caused by trade war and relocation of the supply chain. Losses in oil & gas fracking are no longer being tolerated by investors and lenders for the time being. There’s a supply bottleneck for housing since many homes have been authorized but not started due to shortage of materials and labor.
@Jerry Brown: from memory, if you buy a used car, in terms of GDP measurement, that would contribute towards Private Consumption Expenditure. If you imported that used car, the increase in C would be offset by the increase in Imports (M). In terms of new car prices, there are a myriad of factors at play. Preference factors, competition and expected availability of supply are but some.
Thanks Esp. This is the part I have no confidence in my understanding of. So let’s say we are not importing or exporting used cars. And you buy my very used car for $100 and are quite happy with that and drive it around for years. In my present understanding that would not add to GDP as there was no new products or services involved with our transaction.
But say you bought my car and fixed it up and sold it to someone else for $500. Now you have added to GDP 400 dollars.
And say you bought my car for $100 and did nothing to it but for some reason the price of used cars went up and you could and did resell it for $500? That is where I think I am confused. I want to say that it doesn’t add to GDP unless you are doing a whole lot of work as a salesperson. But I don’t know.
Hi Jerry, sorry I stand corrected (lack of sleep is affecting me!!!). Real GDP is all about the change in output so used goods resold would not add to GDP.
Your process of fixing up the car (buying bits and pieces, paying for repairs and upgrades) would contribute to GDP.
If price went up, there would be no change to real GDP.
Guys, what if instead of a car we were talking about a house, a ‘used’ house.
It would seem strange if GDP didn’t pick up the rising cost of houses.
So, it seems like used house sales should be part of GDP. Right?
Nope Steve. Sales of preexisting homes do not add to GDP. But new home construction does. And renovations on an old home does also. So if you were trying to sell your old house and spent money making repairs to fix it up prior to selling- that amount you spent adds to GDP.