The recent extreme weather in the northern hemisphere, the twin monster tropical storms in Japan,…
US labour market – stronger in the first two months of 2020 but still scope for expansion
On March 6, 2020, the US Bureau of Labor Statistics (BLS) released their latest labour market data – Employment Situation Summary – February 2020 – which reveals a mixed picture – payroll employment growth has maintained its momentum since December, adding a further 273 thousand jobs and the unemployment rate fell marginally (although steady at the one-decimal point level). But the employment-population ratio fell by 0.1 points and the Broad labour underutilisation ratio (U-6) rose in January by 0.1 point to 7 per cent because there were more underemployed workers. Further, while real wages grew marginally, they lag behind labour productivity growth, which means there is scope for faster wages growth without triggering inflationary impulses. And the polarisation between high-pay and low-pay continues. So getting workers into paid employment is one thing. Paying them decent wages and providing them with secure jobs is another. I conclude that there is still scope for expansion even though the unemployment rates are at levels not seen since the 1960s.
Overview for February 2020:
- Payroll employment rose by 273,000 – a step up from the 2019 monthly average.
- Total labour force survey employment rose by 45 thousand (net).
- The seasonally adjusted labour force fell by 60 thousand (as the new benchmarks work their way through).
- Official unemployment fell by 105 thousand to 5,787 thousand.
- The official unemployment rate was “little changed at 3.5 per cent”.
- The participation rate was steady at 63.4 per cent but remains well below the peak in December 2006 (66.4 per cent).
- The broad labour underutilisation measure (U6) rose by 0.1 points to 7.0 per cent largely because of a rise in the number in the part-time for economic reasons cohort (the US indicator of underemployment).
For those who are confused about the difference between the payroll (establishment) data and the household survey data you should read this blog post – US labour market is in a deplorable state – where I explain the differences in detail.
Payroll employment trends
The BLS noted that:
Total nonfarm payroll employment rose by 273,000 in February, after an increase of the same magnitude in January. In 2019, job growth averaged 178,000 per month. In February, notable job gains occurred in health care and social assistance, food services and drinking places, government, construction, professional and technical services, and financial activities.
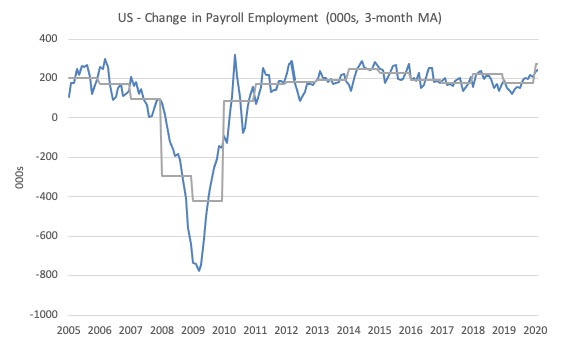
The first graph shows the monthly change in payroll employment (in thousands, expressed as a 3-month moving average to take out the monthly noise). The gray lines are the annual averages.
This month saw the change in payroll employment sustained at 273 thousand and well ab0ve the average monthly change for 2019 (178 thousand).
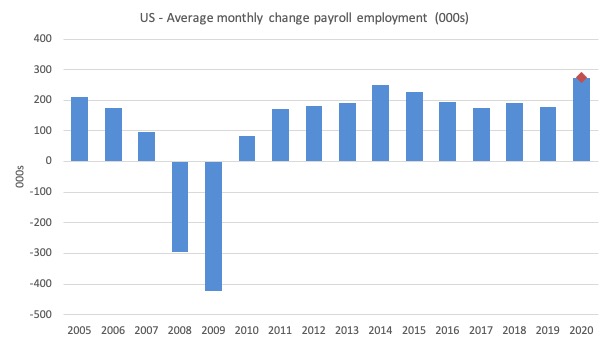
The next graph shows the same data in a different way – in this case the graph shows the average net monthly change in payroll employment (actual) for the calendar years from 2005 to 2020 (the 2020 average obviously is just the January result).
The red diamond is the current month’s increase.
The slowdown that began in 2015 continued through 2017 was reversed last year. The 2018 average was 223 thousand compared to 179 thousand in 2017.
The final average for 2019 was 178 thousand.
So it looks like 2020 has started well in terms of quantity of jobs.
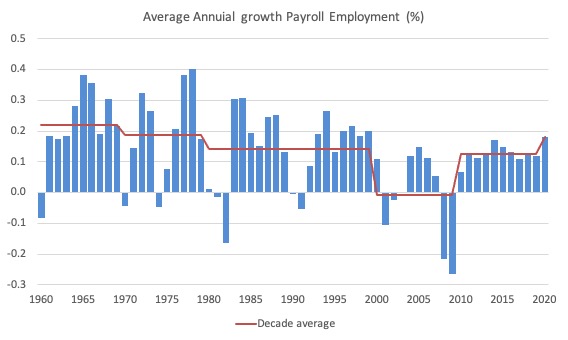
To put the current recovery into historical perspective the following graph shows the average annual growth in payroll employment since 1960 (blue columns) with the decade averages shown by the red line.
It reinforces the view that while payroll employment growth has been steady since the crisis ended, it is still well down on previous decades of growth.
Labour Force Survey – employment growth remains positive
The BLS report that:
Both the unemployment rate, at 3.5 percent, and the number of unemployed persons, at 5.8 million, changed little in February. The unemployment rate has been either 3.5 percent or 3.6 percent for the past 6 months.
Employment as measured by the household survey rose by 45 thousand net (0.03 per cent) while the labour force declined by 60 thousand (-0.04 per cent).
As a result (in accounting terms), total unemployment fell by 105 thousand and the unemployment rate fell from 3.58 per cent to 3.52 per cent, which is why at the one-decimal point level, the BLS say that the rate was “little changed”.
The last time the unemployment rate was this low was in August 1969.
The next graph shows the monthly employment growth since January 2008. The red line is the average labour force growth over the period December 2001 to December 2006 (0.09 per cent per month).
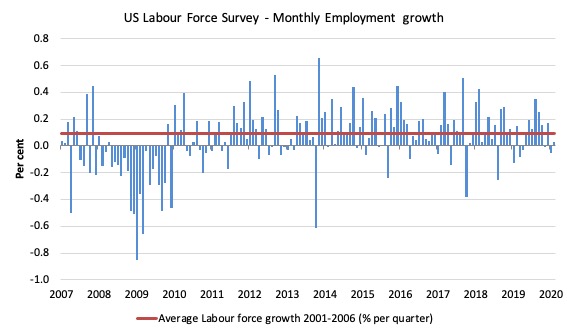
The summary conclusion: Notwithstanding the boost in jobs, there is still no coherent positive and reinforcing trend in employment growth since the recovery began back in 2009. There are still many months where employment growth, while positive, remains relatively weak when compared to the average labour force growth prior to the crisis or is negative.
There are also months where employment growth is negative.
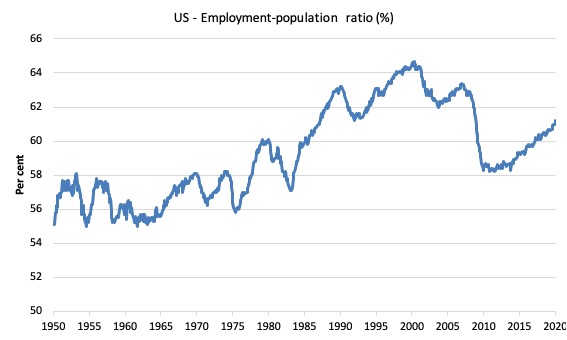
The recent population benchmarking did not impact on the ratios, including the Employment-Population ratio.
This is a good measure of the strength of the labour market because the movements are relatively unambiguous because the denominator population is not particularly sensitive to the cycle (unlike the labour force).
The following graph shows the US Employment-Population from January 1948 to February 2020. While the ratio fluctuates a little, the February 2020 ratio rose fell by 0.1 points to 61.1 per cent.
This is still above the value recorded in November 2008, before the GFC created havoc.
Over the longer period though, we see that the ratio remains well down on pre-GFC levels (peak 63.4 per cent in December 2006), which is a further indication of how weak the recovery has been so far and the distance that the US labour market is from being at full capacity (assuming that the December 2006 level was closer to that state).
It is usually a positive sign though when total employment outstrips or keeps up with the underlying growth in the working age population.
Unemployment and underutilisation trends
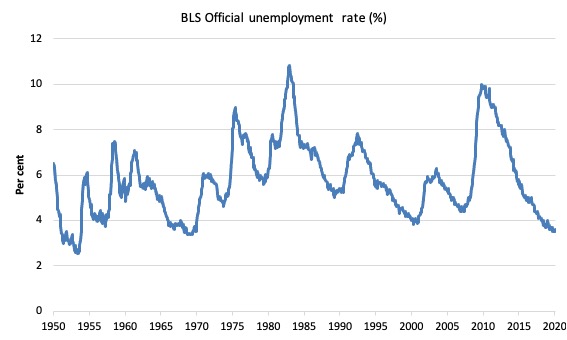
The first graph shows the official unemployment rate since January 1950 which is currently at 3.5 per cent, steady on the previous month.
The US labour market is now maintaining unemployment rates not seen since the late 1960s.
With inflation stable, the continued low unemployment rates make a mockery of official NAIRU estimates of full employment coinciding with an unemployment rate of 4.6 per cent.
 a>
a>
The official unemployment rate is a narrow measure of labour wastage, which means that a strict comparison with the 1960s, for example, in terms of how tight the labour market, has to take into account broader measures of labour underutilisation.
The next graph shows the BLS measure U6, which is defined as:
Total unemployed, plus all marginally attached workers plus total employed part time for economic reasons, as a percent of all civilian labor force plus all marginally attached workers.
It is thus the broadest quantitative measure of labour underutilisation that the BLS publish.
In December 2006, before the effects of the slowdown started to impact upon the labour market, the measure was estimated to be 7.9 per cent.
In February 2020 the U6 measure increased by 0.1 points to 7 per cent. This was driven, in part, by the rise in the category ‘Part-time for economic reasons’ – a measure of underemployment in the US data context) – it rose by 136 thousand or 3.1 per cent.
There was also a sharp increase in the category – Discouraged NLF search and available not available – which taken together with the rise in underemployment suggests there is still a weakness in the labour market notwithstanding the strong employment growth.
U-6 was 8.0 per cent at the beginning of 2019.
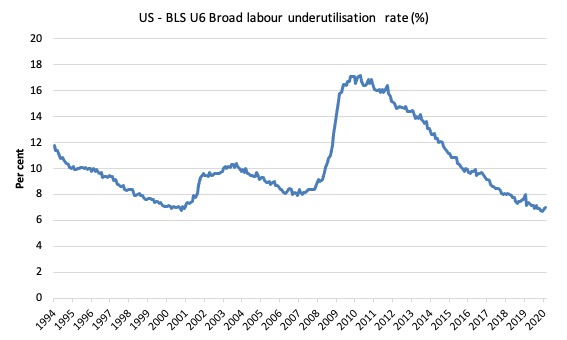
The U-6 measure is now below the pre-GFC level, and, while, signalling improvement, there is still some scope to go before full capacity is reached.
Feature this month: Occupational wage bias intensifies through 2019
We have previously analysed the issue of job quality in the US labour market.
It is one thing to be creating jobs in volume but another to be creating well-paid, secure jobs.
The – US Job Quality Index – is an innovative approach that “assesses job quality in the United States by measuring desirable higher-wage/higher-hour jobs versus lower-wage/lower-hour jobs” on a monthly basis.
Their – February 2020 Report – finds that:
… the U.S. Private Sector Job Quality Index (JQI)® has been revised to a level of 79.41, down by -0.13% from its revised level one month earlier and reflecting a slightly higher proportion – relative to the prior month – of U.S. production and non-supervisory (P&NS) jobs paying less than the mean weekly income of all P&NS jobs, relative to those jobs paying above such mean.
However, in terms of the dynamics, the analysis finds that:
… of the 228,000 increase in all private sector, non- farm payrolls in February 2020 shows that approximately 42.15% of the change in such private sector jobs was in industry sectors offering P&NS jobs with an average weekly income below the mean weekly income of all P&NS jobs (i.e. “Low Quality Jobs”).
Thus proportion has been falling since December 2019 and:
… shows a welcome improvement over the second half of 2019 and January 2020, during which Low Quality Job formation stood at well over 50% on average. The source of the improvement was rooted in a 61,000 boost in goods producing jobs in February. This increase would indicate an improvement to the overall JQI next month.
As regular readers will know I have been tracking the sectoral and occupational employment changes in the US in relation to earnings for some time now. I am working on a very disaggregated version of that approach.
But for now I just updated my research into the cyclical shifts in employment at the main occupational levels for the US today.
And the results are very interesting.
In the past, I have demonstrated that the proportion of jobs in the total employment in sectors that pay below-average pay has increased.
But at that level of aggregation, we are unable to say whether these jobs in question were high-pay or low-pay.
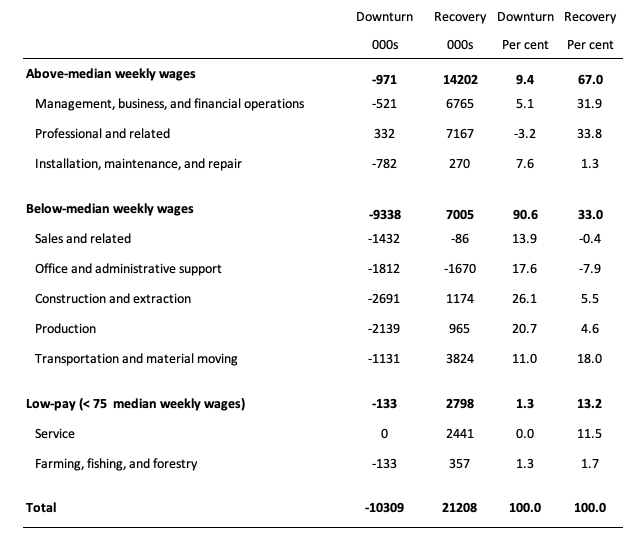
The next table helps to expand on that understanding.
It shows the net job losses (in the downturn) and net job gains (in the recovery to date) for the major occupations in the BLS classification.
I have sorted the occupations relative to median weekly earnings as at the December-quarter 2019.
Low-pay is 75 per cent of the median.
Summary results:
1. In the downturn 90.6 per cent of the jobs lost were in occupations that paid below median weekly earnings (1.3 per cent of those were in low-paid occupations). Very few jobs (relatively) were lost in the higher paying occupations.
2. Given 86.1 per cent of the total jobs lost in the downturn were in sectors paying above average pay. The inference is that the jobs lost were predominantly the lower paying jobs in those sectors (although we cannot strictly compare mean and median in a wage distribution given the skewness).
3. In the upturn to date, the net jobs added have not yet replaced those lost in the occupations with below median weekly earnings. 67 per cent of the net jobs added have been in occupations with above median weekly earnings. That proportion has risen in the last three months.
4. While only a small number and proportion of jobs were lost in the low-pay occupations, the recovery has seen a much larger number of those jobs being added. Of the 33 per cent share of below median earning jobs added in the recovery, the proportion that are in low-pay occupations is currently 13.2 per cent.
5. This tells us that there is a polarisation going on in the occupational employment structure with a bias towards low-pay jobs in the below median weekly earnings occupations and towards jobs in the above median weekly earnings. This supports the evidence provided by the Job Quality Index data.
6. That is there has been a hollowing out around the overall median pay levels.
Additional feature this month: Wage movements
One of the ways of assessing whether the US economy is close to full employment is to examine the growth in wages, which tells us whether the supply-side of the labour market (workers) is enjoying gains in bargaining power.
The other indicator is the rate at which workers are quitting their jobs, which provides a signal of mobility and confidence among workers. The most recent data is not yet available.
The BLS reported that:
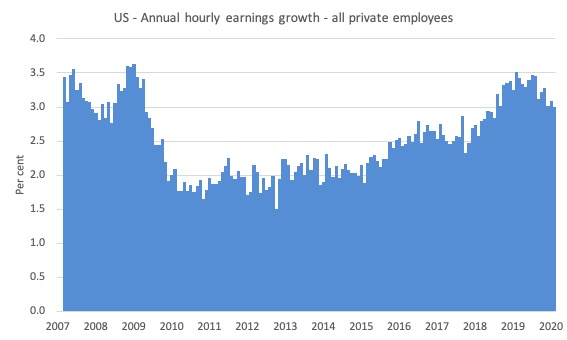
In February, average hourly earnings for all employees on private nonfarm payrolls increased by 9 cents to $28.52. Over the past 12 months, average hourly earnings have increased by 3.0 percent. Average hourly earnings of private-sector production and nonsupervisory employees increased by 8 cents to $23.96 in February.
The following graph shows the annual hourly earnings growth for all private employees since March 2007.
The recent trend is downwards and dispels any notion that the US has reached the end of their expansionary capacity.
Noting that the above graph is in nominal terms – the BLS Real Earnings Summary – tells us that:
Real average hourly earnings for all employees increased 0.1 percent from December to January, seasonally adjusted … This result stems from an
increase of 0.2 percent in average hourly earnings combined with an increase of 0.1 percent in the Consumer Price Index for All Urban Consumers (CPI-U) …Real average weekly earnings increased 0.1 percent over the month due to the change in real average hourly earnings combined with no change in the average workweek.
And, from the – Productivity and Costs, Fourth Quarter and Annual Averages 2019, Revised – report we find that:
Nonfarm business sector labor productivity increased 1.2 percent in the fourth quarter of 2019 … as output increased 2.4 percent and hours worked
increased 1.2 percent.
So real hourly earnings growth is still lagging behind the annual productivity growth, which is another sign of labour market slack and weak bargaining power.
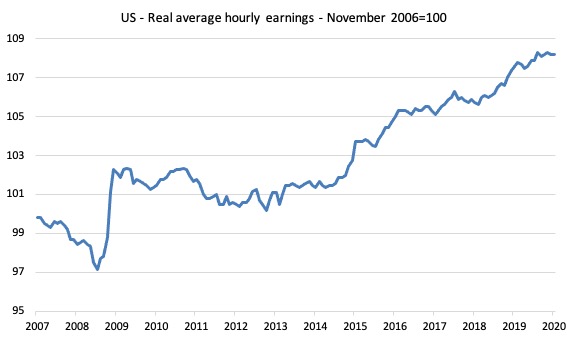
The following graph shows movements in real average hourly earnings (indexed at 100 the pre-GFC peak – November 2006) up to January 2020.
The faster growth as the recovery gained speed ended in early 2016. A more recent growth spurt is observed over the first half of 2017.
But that has now given way to zero to negative growth in real wages.
The February 2020 US BLS labour market data release reveals a mixed picture.
Payroll employment growth has maintained its momentum since December, adding a further 273 thousand jobs and the unemployment rate fell marginally (although steady at the one-decimal point level).
But the employment-population ratio fell by 0.1 points and the Broad labour underutilisation ratio (U-6) rose in January by 0.1 point to 7 per cent because there were more underemployed workers.
Further, while real wages grew marginally, they lag behind labour productivity growth, which means there is scope for faster wages growth without triggering inflationary impulses.
And the polarisation between high-pay and low-pay continues.
So getting workers into paid employment is one thing.
Paying them decent wages and providing them with secure jobs is another.
I conclude that there is still scope for expansion even though the unemployment rates are at levels not seen since the 1960s.
That is enough for today!
(c) Copyright 2020 William Mitchell. All Rights Reserved
When Ireland was showing rapid, strong recovery it was prudent to be sceptical (but of course they are part of the EU). Trump’s voters seemingly have much to celebrate and strong reasons to not reject his economic plan. So, any analysis/predictions on what could collapse the trends recorded above? Or is it truly party popper time for the US economy under Trump?
The stock market also looks quite unhealthy (oil prices collapsing) at the moment with traders now flocking to government bonds. Coronavirus panic.
If I was the CEO or CFO of a large corp. I would be hiring now to make the suckers/voters think Trump is managing the economy well.
Then as soon as the election was over I would lay a bunch of people off.
It would be a shot term loss for a larger long term gain. As I see the situation.
The US has a job quality issue, which translates into an income quality issue, which further translates into an unhealthy economy issue.
Dear Steve American (at 2020/03/09 at 2:40 pm)
I find your suggestion that we should make the employment security of ordinary Americans (or anyone) a political toy to play with, just to get rid of a President that was voted in by the people, to be morally unsustainable and rather reprehensible.
It would be much better to have a coherent opposition that can sustain consistent arguments to expose the poverty of the elected President.
Also to think of the voters as “suckers” is the classic sort of disdain that led to the Tories in the UK defeating the Labour Party in December.
best wishes
bill
An off topic question, here in Brasil, there’s a debate over the public debt. Government is now making austerity policies to privilege payment of public debt, and that’s how financial market are making lots of money, plus there are fraudulent debts. And others thay say otherwise, that government doesn’t pay so much to public bondholders and that’s not really an issue to worry. How to answer that?
Bill, I understood Steve American’s comment as pointing out that CEO’s and CFO’s of large US corporations know they have benefited quite well financially under Trump- far more so than the average worker has. And that if he was one of their cynical corporate advisors, that is the advice he would give them so they could maintain that increasing disparity for another four years. Anyways, the last US President who was voted in by a majority of the voters was named Obama. Not Trump.
But it would be a morally reprehensible thing to do. Even if I misunderstand Steve.
Rafael,
Not only in Brazil, but in every country in the world (except maybe China which has public banks), there is “a debate over the public debt”, because mainstream economists think the government can *only* be financed by taxing (or borrowing from) the private sector.
They have it back to front; in fact spending comes *before* taxation, the true purpose of which is to restrain excess demand on resource availability, if necessary.
Despite the fact that Abba Lerner in the 1940’s already knew otherwise, as noted by Keynes who (in 1943) said: “Lerner’s argument is impeccable, but heaven help anyone who attempts to explain it to the common man…..”
MMT is of course a direct descendent of Lerner’s “functional finance”, so you need to spread the good news about public financing via the currency-issuing capacity of the consolidated government sector – treasury and central bank, as described in MMT – to your elected politicians…..
Bill,
Jerry read my intent well.
I’m a progressive so there is no way I would ever be the CEO of a large or huge corp. in America today.
Bill, you failed to grant my assumption. I said, “If I were the CEO of a large corp.” …
If I had said, “If one is the CEO of a large corp, it follows (in this day & age) that therefore one is (i.e. he is) ‘morally reprehensible’ “, would you disagree with me?.
For just one example, in your opinion are the leaders of the oil industry morally reprehensible for their stance on AGW, aka ACC, over the last 40 years?
My point is that no one seems to grok that it is possible that the CEOs of America are hiring for the next 10 months and then will reverse and lay-off the least profitable of their then current workers.
I have said this *here* before and literally *nobody* responded to my post. It seemed to have been ignored, so I phrased it differently to get it noticed. I guess it worked.
Neil halliday
i know. i’m aware with MMT principles.
But in practical terms, with the limitations in spending with taxation that governs input themselves, is really true that people are using public debt to get a lot of money ?
Steve_American
Monday, March 9, 2020 at 14:40
You must live in a different world to me my friend.
I have never come across a CEO who betrays the short-term outright cynicism you describe, but then I don’t associate with the lions of huge corporations.
My small and medium leaders are, by contrast, earnestly trying to control the demand for their products, not the voting intentions of their consumers – and their horizons are generally shorter-term than those politicians who make promises that stretch way out into the hazy future.
So who is in the best position to manipulate voter intentions?
I have also noticed that those running my type of companies are inclined to view their workers as their armies, engaged in a competitive fight for survival and success – and though they can’t pay them better than the going rate they still appreciate the predicament of their lesser remunerated brethren.
In my experience, where gigantic employment upheavals have left workers desolate and without hope, it has often been associated with decisions at ministerial level to abort the support of steel, mining, shipbuilding and rail industries because they could not sustain their place in life’s ever changing world.
Rafael,
Austerity plays into making the state being de-funded and working badly, so that it leaves essential services to corporations; it’s the neo-liberal long-con. Brazil can’t run out of Reais to do both.
It’s trickier to avoid corporate welfare when you rely on foreign currency parities, but I’d think Brazil is industrialized enough to be able to it reasonably quick. Because, now that I thought of it, it won’t be the first, or the last time an oil price crash is going to hurt a lot.
Bernie’s gone, defeated by the instinctive greed (in all of us) that is part of the “human condition”.
Because hardly anyone knows about the alternative offered by MMT, which doesn’t run foul of this universal instinctive greed.
And resistance to the idea, even among ‘top tier’ economists, that the nation can fund its own social (non-market) policies, independently of, and alongside, the private sector.
Gogs,
To my way of thinking, corps. now make large campaign contributions and spend huge amounts on lobbyists.
Is it so much of a stretch to think that they would also increase their payroll (by somewhat less) to make the economic numbers look better until the election? And, they will get some value, even if it is just new paint on all their corporate building’s walls, etc.
Another example of large corp. CEOs being greedy are the Koch brothers, or now brother because one died.
After they have spent literally $100K/year for years on lobbying, PACs, etc. what is another $100K now?